Cryptocurrency News
January 19th Hot Topics:
The judge in the SEC v. Binance case will hear arguments on whether cryptocurrencies are considered securities.
Boston Fed: Open to starting rate cuts before July if inflation falls faster than expected.
Nine spot Bitcoin ETFs saw a 34% increase in trading volume today, while GBTC decreased by 24%.
Fidelity's Bitcoin spot ETF's AUM surpasses $1 billion.
BTC options worth $8.9 billion and ETH options worth $5.2 billion are set to expire soon.
Trading Insights
How can we judge whether the institution is washing the market or selling off?
Range of fluctuations: Washing the market generally has a smaller range, while selling off generally has a larger range. During a wash, the institution suppresses the price, causing it to drop quickly, but there will be support below. When the institution wants to sell off, the price will rise rapidly, and there will be obvious stagnation at the top.
Profit margin for the institution: Washing the market generally has a profit margin of less than 20%, while selling off generally has a profit margin of more than 50%, even 100%.
Ratio of trading volume between internal and external markets on the same day: During a wash, the trading volume in both markets is similar, while during a sell-off, the internal market volume is generally greater than the external market, and large sell orders often appear.
Trading volume: The trading volume during a wash gradually decreases, while the selling volume can remain at a high level.
Divergence trend of moving averages: During a wash, the divergence trend remains upward, and the long positions remain unchanged. During a sell-off, the trend has been disrupted or has started to decline.
Whether there is price support: During a wash, it generally does not effectively break the 10-day moving average in the mid-low price range, and in the mid-high price range, it does not effectively break the 20-day moving average. During a sell-off, it will quickly break the short-term moving averages such as the 5-day and 10-day, and a cross will appear at the high level.
Search for the public account: Big White Coin
BTC
Analysis
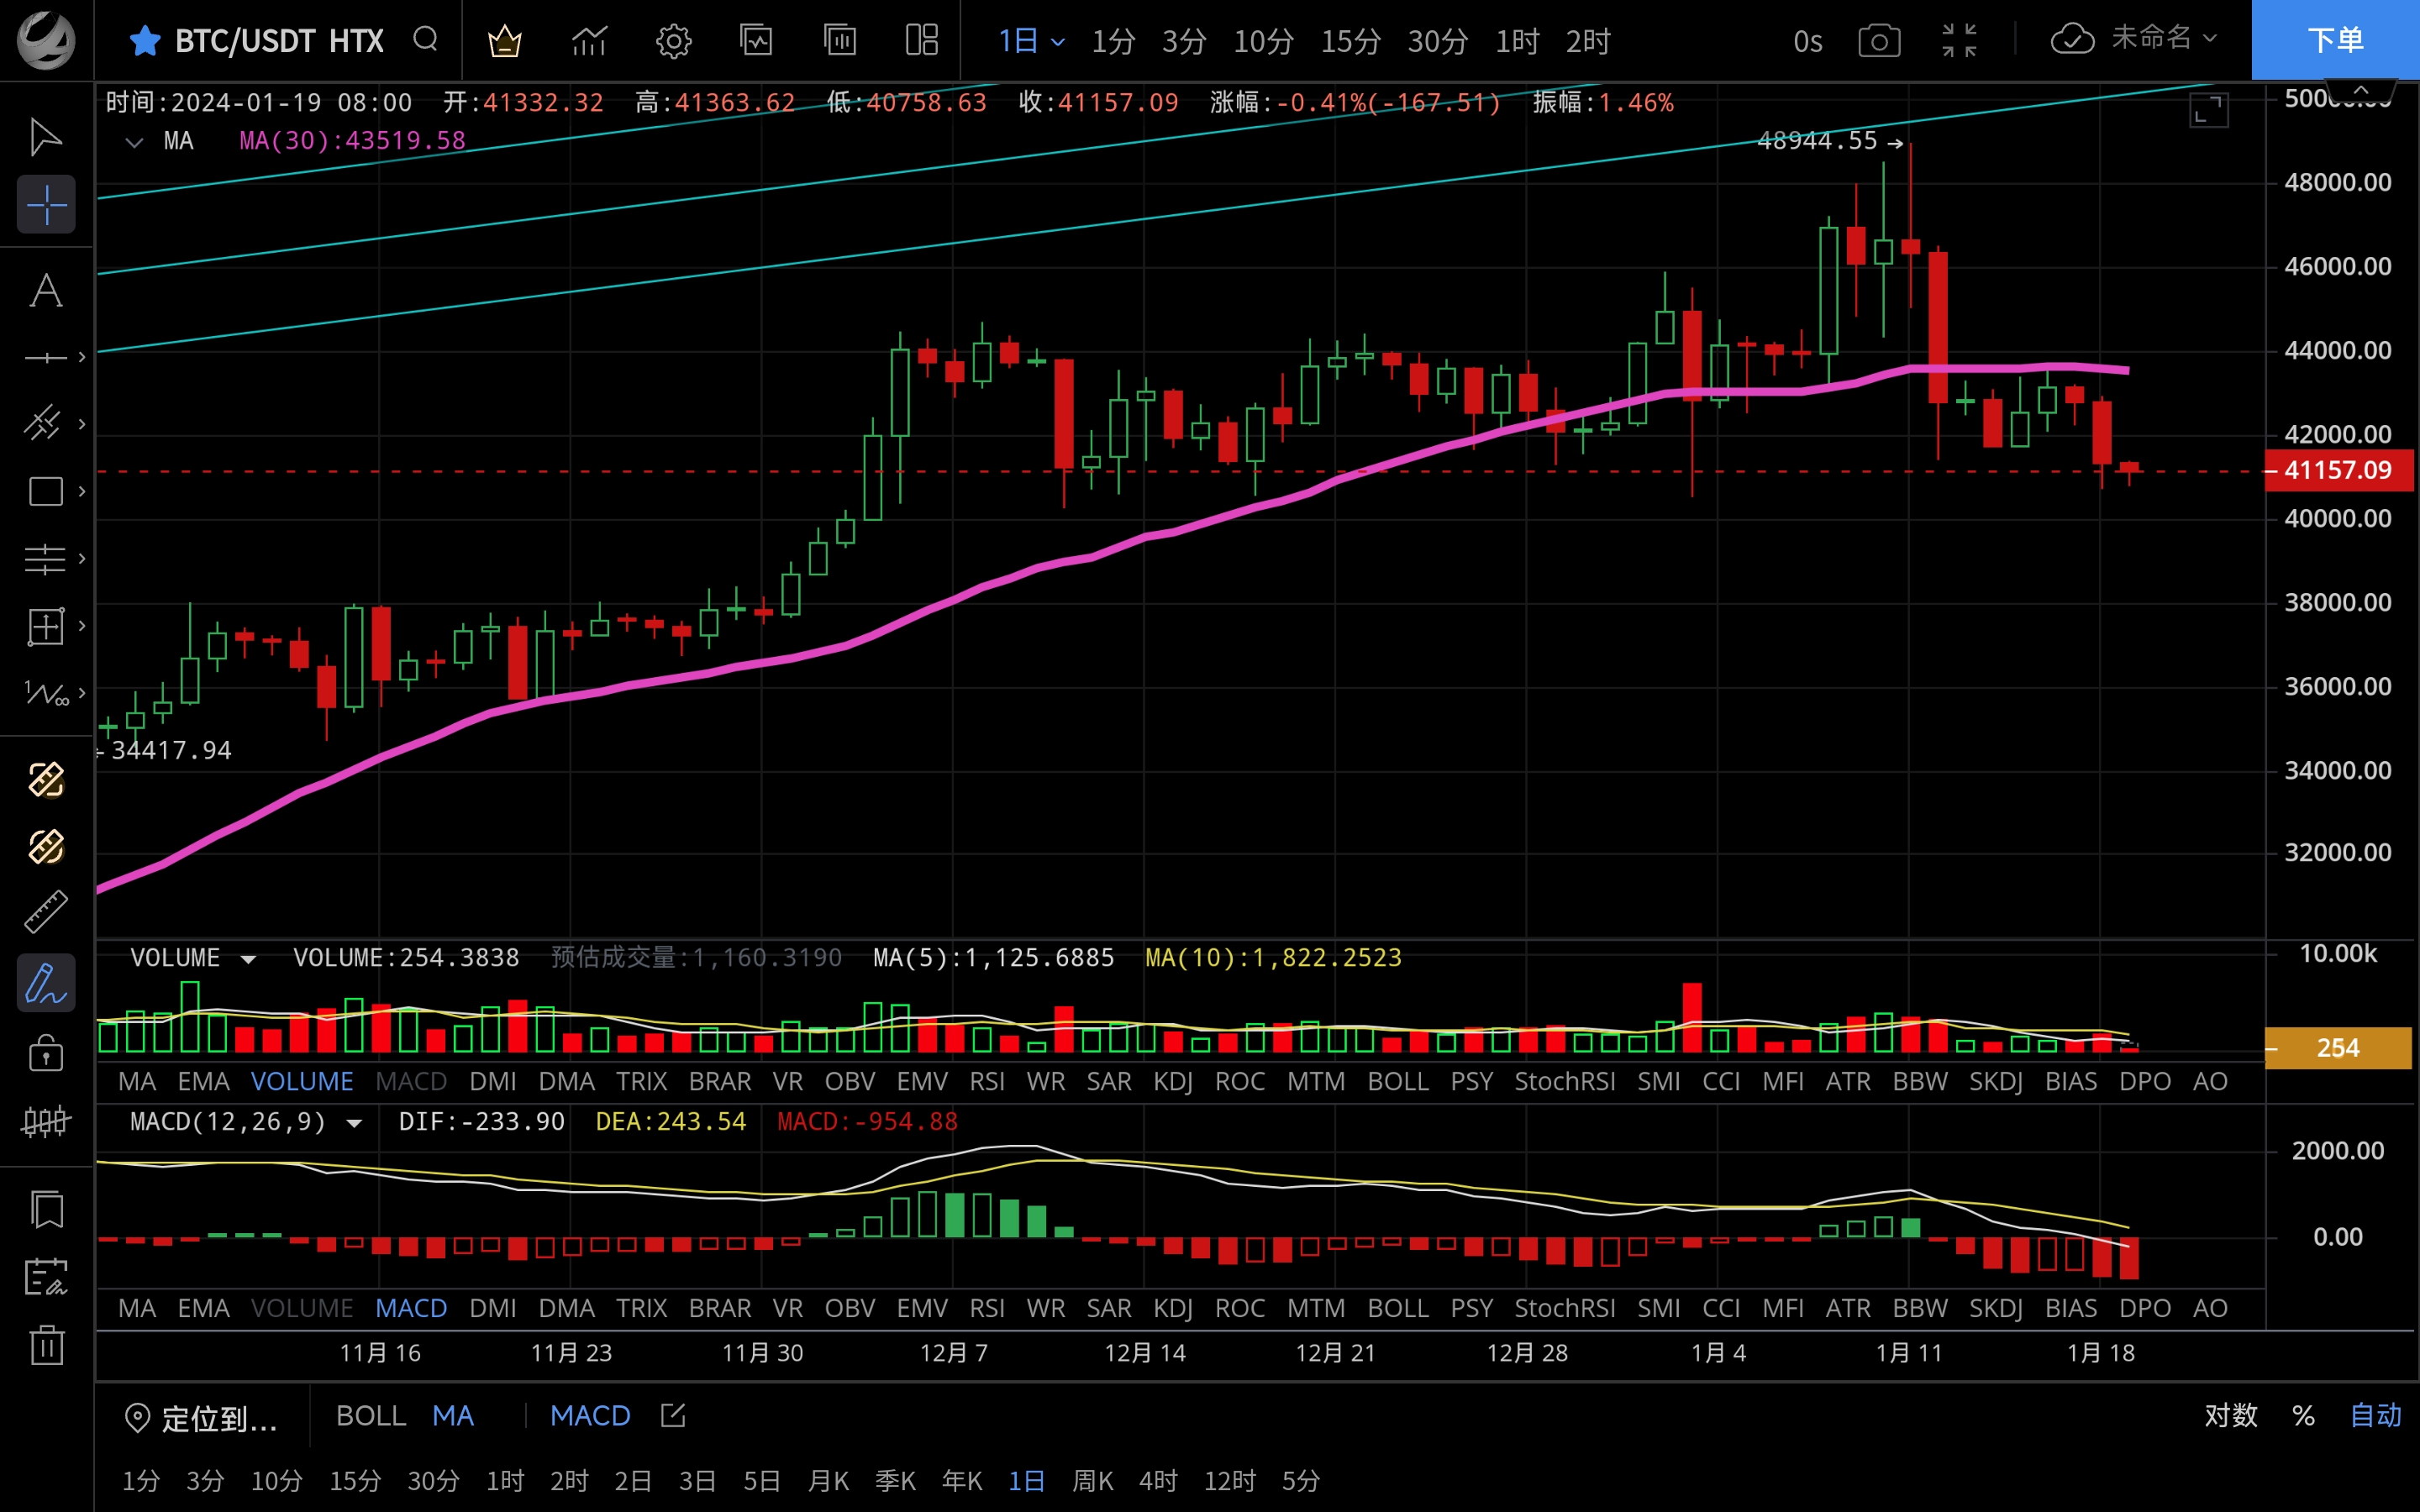
Bitcoin's price fluctuated little during the day yesterday, reaching a peak near 42900 and then falling back. In the early morning, the bears exerted force, leading to consecutive declines, with the lowest point near 40700 finding support and rebounding. Congratulations to friends who followed yesterday's short-selling strategy, gaining a profit of 2000 points. Currently, the price is running near 40880. The four-hour candlestick chart has formed a double bottom rebound from bearish to bullish, but there is obvious resistance above, and the rebound is not strong. The candlestick chart turns bearish again and tests the lower side. The MACD bearish trend gradually increases in volume, and the two lines cross downwards. The MA7 moving average guides downward, indicating a short-term downward trend. The daily chart has not yet stopped falling. If 40500 is broken, there is a chance to test the support at 40000. Long positions in the near term should be cautious of risks. The trend is biased towards bearish, so the strategy suggests mainly shorting on rallies and buying on dips as a secondary approach. Resistance above is at 41300-42000, and support below is at 40500-40000.
ETH
Analysis
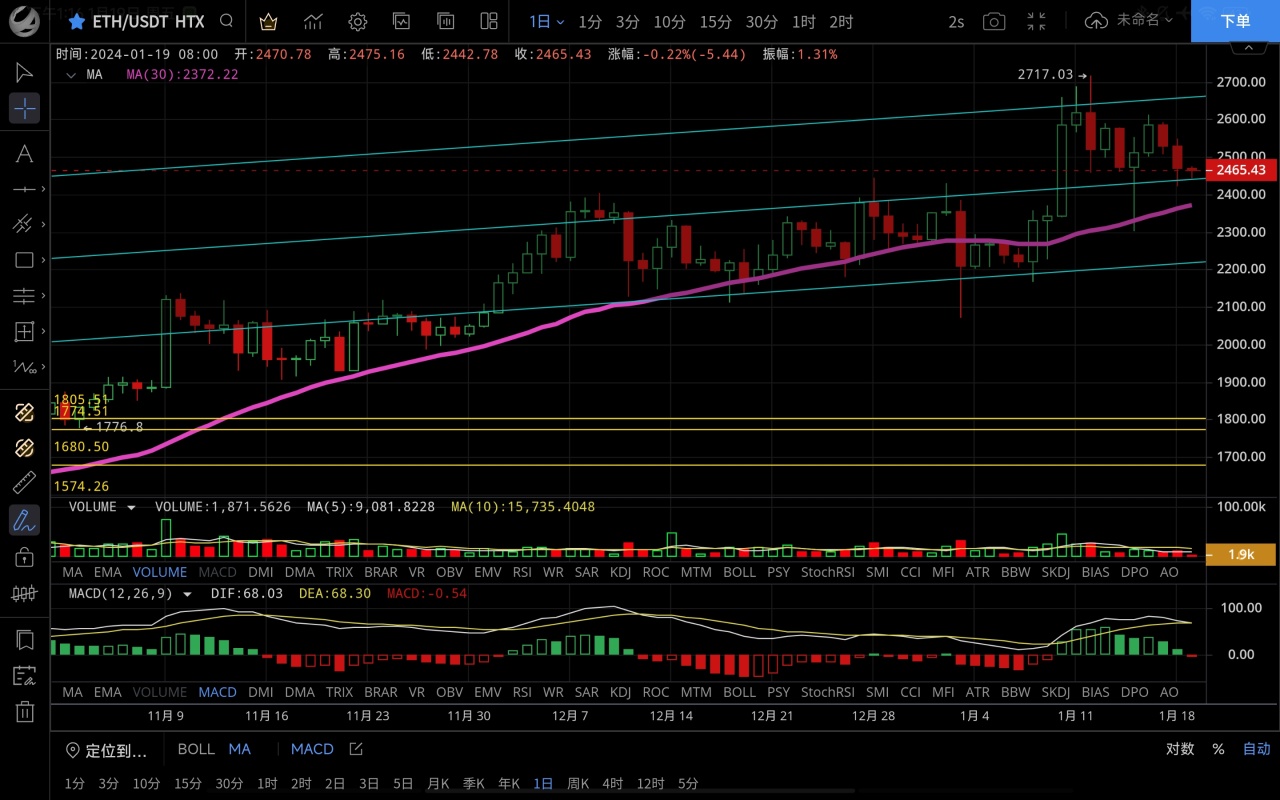
Ethereum's trend is consistent with the strategy. During the day yesterday, the price rebounded to a high of 2548 but was resisted, then the market oscillated and fell back, dropping to a low of 2421 and rebounding at the support level. Congratulations to friends who followed the short-selling strategy at the high level. Currently, the price is running near 2457. The four-hour chart retraced to the MA90 moving average support, and the candlestick turned from bearish to bullish, with the low point rising. The MACD bearish trend runs with no volume, and the short-term trend shows signs of stopping the decline. If 2500 is not broken, you can enter a short position. The daily chart shows consecutive declines, indicating a bearish trend, but the downward momentum is limited. If the candlestick can close below the MA14, it is expected to test near 2370. The strategy suggests treating high levels as short and low levels as long. Resistance above is at 2500-2530, and support below is at 2440-2400.
Disclaimer: The above content is for reference only and does not constitute specific operational advice, nor does it bear legal responsibility. Market conditions change rapidly, and the article has a certain lag. If there is anything you don't understand, feel free to consult.
免责声明:本文章仅代表作者个人观点,不代表本平台的立场和观点。本文章仅供信息分享,不构成对任何人的任何投资建议。用户与作者之间的任何争议,与本平台无关。如网页中刊载的文章或图片涉及侵权,请提供相关的权利证明和身份证明发送邮件到support@aicoin.com,本平台相关工作人员将会进行核查。


