I, a commoner, have been working in Nanyang, striving to survive in the chaotic market, not seeking fame in the coin circle, but seeking to be true to myself. I really like a quote from Robert T. Kiyosaki, "The love of money is the root of all evil, and poverty is the root of all evil." I believe everyone in the coin circle is here to profit. I hope that my market analysis in the coming days can help everyone gain a lot in the coin circle. The sea of learning is boundless, and there is no end to learning. Continuously increasing one's knowledge and combining it with one's own trading habits is the only way to survive and achieve one's ambitions in the coin circle.
First, let's analyze the recent market trends of Bitcoin, Ethereum, Ordi, and dydx.
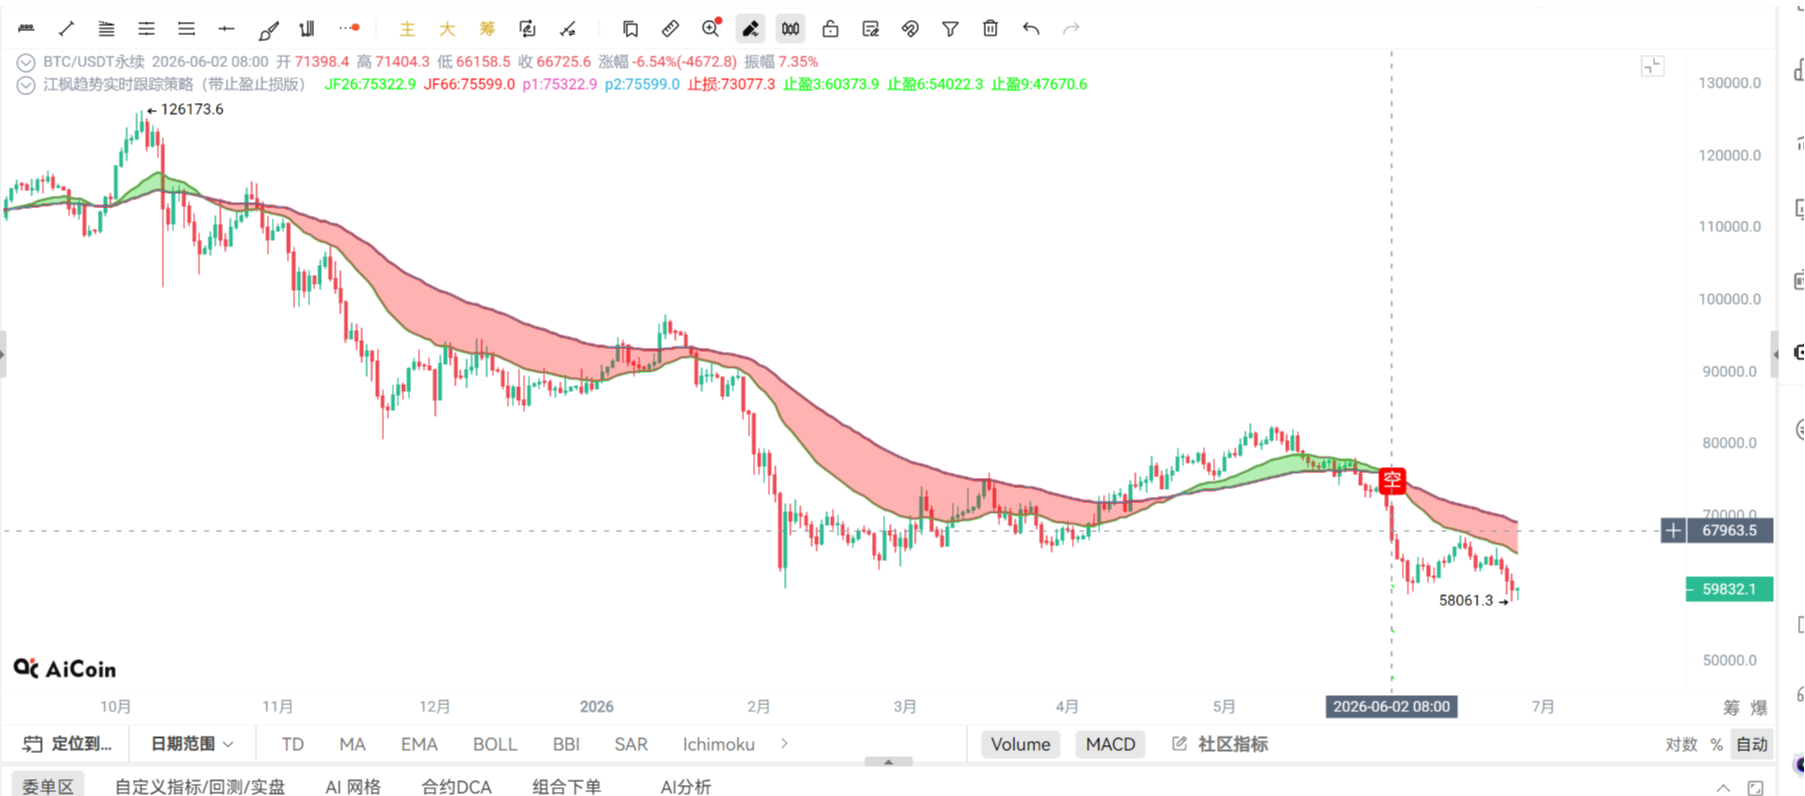
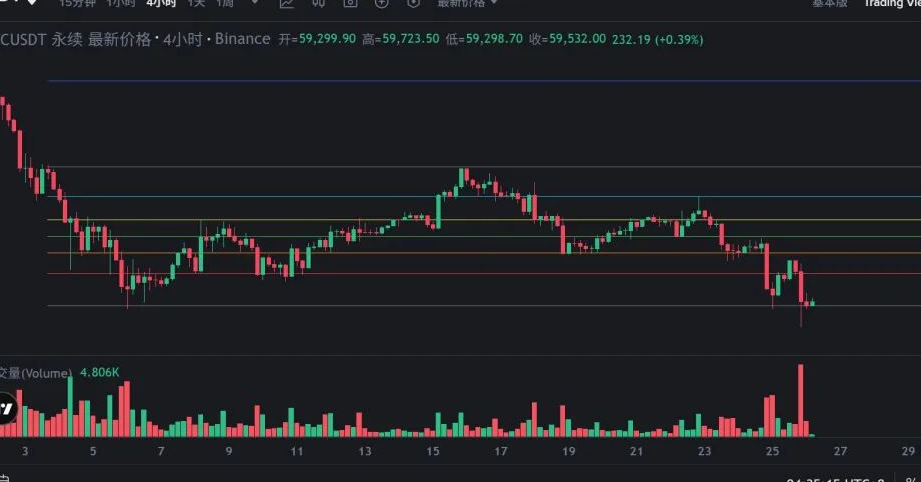
For Bitcoin (BTC), it has been fluctuating between 42000 and 43500 recently. It's worth noting that the daily MA30 moving average of BTC has not risen, indicating a weak market. The possibility of it going down to around 38000 is increasing. In the short term, it's important to be cautious. It may be safer to consider shorting at around 43500. Overall, it's a bearish market. My suggestion is to focus on short positions, with a suitable entry point around 43100-43200.

As for Ethereum, from a daily perspective, it has not fallen below the MA30 moving average around 2380. If it breaks this level, Ethereum may weaken. Currently, its trend is still stronger than BTC's, but due to BTC's weakness, Ethereum's recent performance may not be good. On the 4-hour chart, it has already fallen below the MA30 moving average at 2530. If it doesn't recover, it's likely to touch the MA120 moving average around 2420. Overall, it's a bearish market. My suggestion is to focus on short positions, with an entry point near 2550 and a target around 2420.

For Ordi, the oscillation period has been too long. On the daily chart, it has not fallen below the MA30, but on the 4-hour chart, all three lines have crossed, indicating a possible major turning point. If it doesn't break below the MA120 moving average, there's no need to panic. However, if it does break below, it's better to exit. On the hourly chart, the trend is not very favorable, and all three lines have fallen without showing signs of stabilization. My suggestion is to refrain from shorting Ordi until it effectively falls below 70. If it does, consider shorting.

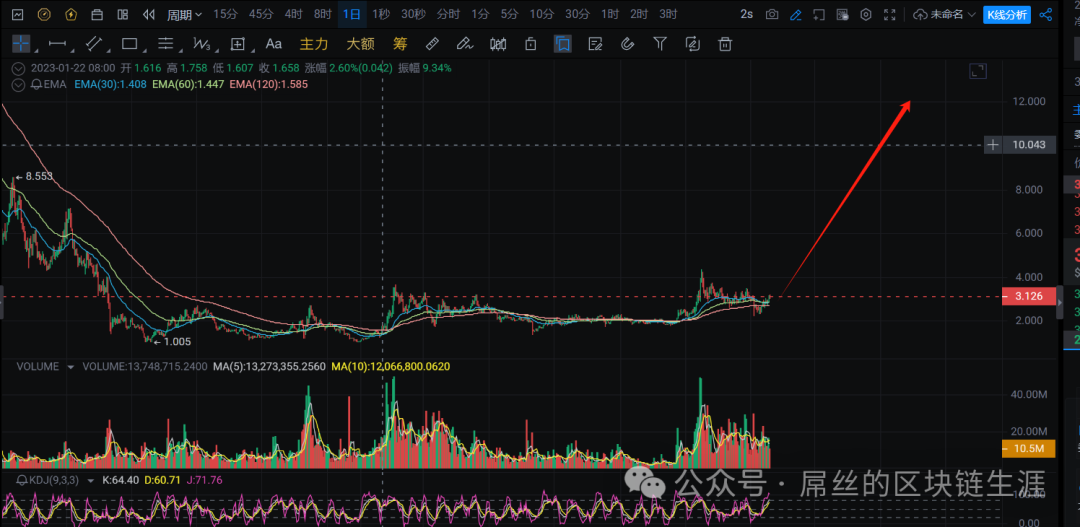
As for dydx, I recommend everyone to keep an eye on it for the long term. On the weekly chart, it's in a low-level oscillation, and it hasn't shown much movement for a long time. From a daily perspective, if it doesn't fall below 2.7, it can be held in spot positions. The potential for an upward movement cannot be estimated for now, but I think it will be significant. I won't analyze the smaller time frames because I don't recommend playing with contracts. I suggest buying some in spot positions. If there's an opportunity for a pullback to 2.8, consider adding to the position. I think it could rise to around $15, but it requires long-term holding.
All the above suggestions are personal opinions and do not constitute investment advice. The coin circle is risky, so caution is needed in trading.
If you need to join the group, you can add the assistant's WeChat.


免责声明:本文章仅代表作者个人观点,不代表本平台的立场和观点。本文章仅供信息分享,不构成对任何人的任何投资建议。用户与作者之间的任何争议,与本平台无关。如网页中刊载的文章或图片涉及侵权,请提供相关的权利证明和身份证明发送邮件到support@aicoin.com,本平台相关工作人员将会进行核查。