ProShares has submitted 5 leveraged ETFs, and the spot ETF has just landed. Are leveraged ETFs coming?
Leveraged spot ETFs refer to ETFs that can be bought in both long and short directions, effectively increasing index volatility. Due to their simple trading nature, they are highly sought after by retail investors. Currently, the daily trading volume of leveraged ETFs for silver and gold is quite large.
The leveraged ETFs applied for by ProShares have a leverage ratio of approximately 2 times, and it can be expected that short-term volatility will increase in the future. This will attract more institutional funds to enter the market to "grab money," making it more difficult to operate trends in the future.
In the past few days, the spot ETF has been approved, and the trading volume has surged. Within three days of listing, it has exceeded 10 billion US dollars, which is more than the combined total of hundreds of ETFs. This indicates that institutions are vying for pricing dominance. On the other hand, the SEC is expected to approve BTC options products within 60 days, which is beneficial for the long-term healthy development of the market.
BTC:
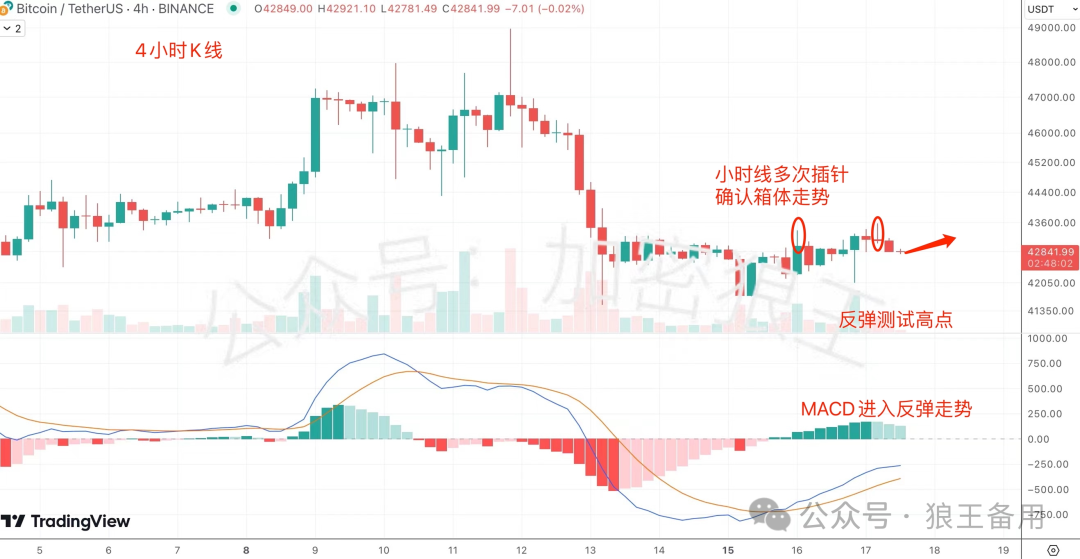
BTC retraced to the 5-day moving average and rebounded. The hourly chart shows consecutive pin bars, confirming a box pattern trend. Accompanied by an increase in bullish volume, BTC needs to test the upper resistance line. The key point of the box pattern is $43,355. Only with a volume breakthrough above $43,355 and breaking the oscillation deadlock, can it quickly surge and strengthen. Next, BTC will rebound to test $43,355.
Resistance levels: $43,355, $44,256, $44,874
Support levels: $41,923, $41,305, $40,753
ETH:
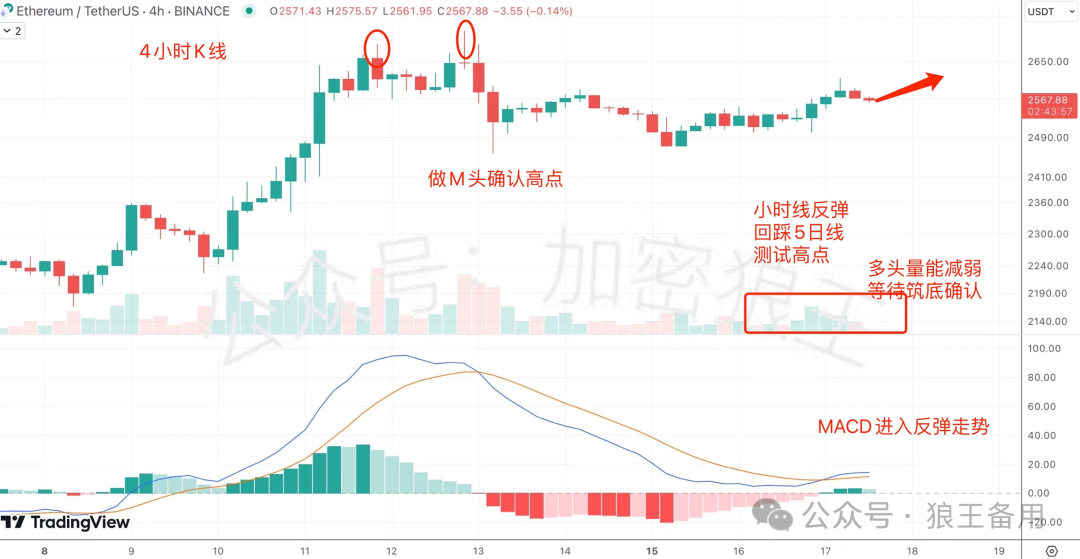
Confirmed support at the 5-day moving average after retracement. The key point of the M-top formed on the 12th of January is $2598.5. Only by holding above $2598.5 can it establish a bottom and strengthen. With weakening bullish volume, ETH is still in a oscillating trend, waiting for bottom confirmation. Next, ETH will rise to test $2598.5.
Resistance levels: $2598.5, $2647.3, $2675.6
Support levels: $2528.6, $2477.4, $2423.3
ORDI:
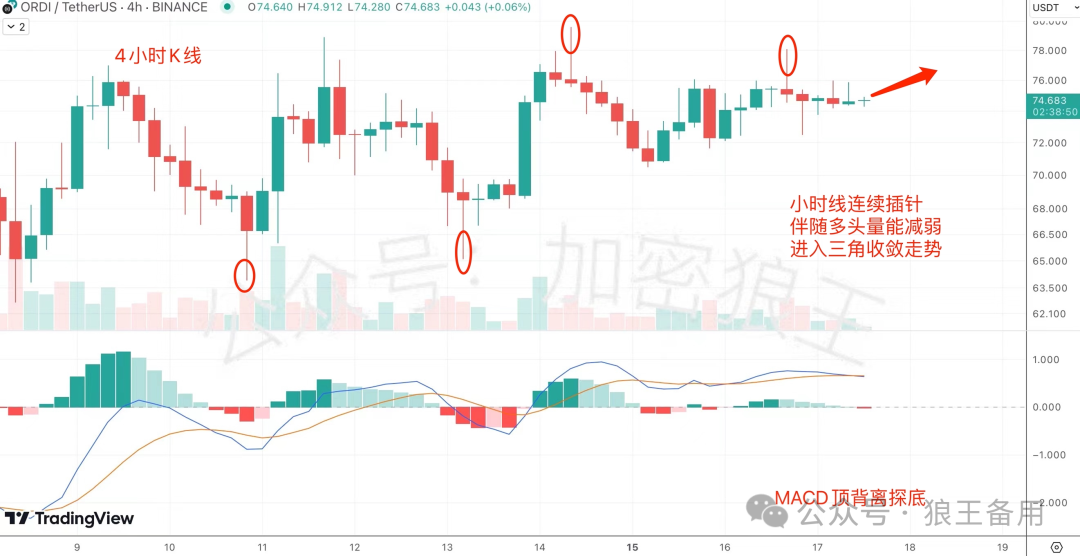
Continuously holding steady along the 5-day moving average. The hourly chart shows multiple pin bars, accompanied by weakening bullish volume. ORDI is still in a triangular convergence trend. The key resistance line formed on the 14th and 16th of January is $76.7. Only with a volume breakthrough above $76.7 can it break the deadlock and return to a bullish trend. Next, ORDI will rise to test $76.7.
Resistance levels: $76.7, $79.5, $82.4
Support levels: $72.8, $70.3, $67.4
ARB's long-term incentive plan has a positive effect on ARB, XRP has shelved its listing plan, pay attention to short-term volatility. Bounce has announced BTC's L2 project, which can be a focus of attention. The mainstream is still in an oscillating trend, so avoid chasing the rise to avoid risks.
免责声明:本文章仅代表作者个人观点,不代表本平台的立场和观点。本文章仅供信息分享,不构成对任何人的任何投资建议。用户与作者之间的任何争议,与本平台无关。如网页中刊载的文章或图片涉及侵权,请提供相关的权利证明和身份证明发送邮件到support@aicoin.com,本平台相关工作人员将会进行核查。


