Daily Sharing
Today's update is a bit late because I went back to my hometown.
Bitcoin hit a new high again today, successfully extending the rebound on the daily chart, similar to our previous expectations. Currently, it seems that the rebound is not over yet and is likely to slowly grind until the news about the ETF on the 10th.
The ninth rebound on the 1-hour chart of Bitcoin seems to have been completed ahead of schedule. Yesterday, we may have misjudged the structure breakdown. However, the ninth rebound was not very standard. After the successful breakthrough, we can consider that the ninth rebound of Bitcoin has been completed ahead of schedule. Currently, we are observing the strength of the 4-hour rebound and whether there will be a "three buys" pattern.
BTC
Due to the rapid changes in the market, this article can only make predictions based on the market changes at the time of publication. Short-term players should pay attention to the latest market changes and use this information as a reference only.
1H:

On the 1-hour chart, the ninth rebound marked by the yellow arrows seems to have been completed ahead of schedule, but the structure of the ninth rebound on the 1-hour chart is not perfect. For Bitcoin, we first need to see a new 4-hour rebound, indicated by the blue arrows, which should at least form the structure of an upward, downward, and upward movement on the 1-hour chart. Currently, the first upward movement on the 1-hour chart has not been completed, so we continue to look for a bullish trend. After the completion of the three movements, we will observe whether there will be an extension of the central movement or a 4-hour pullback.
15M:
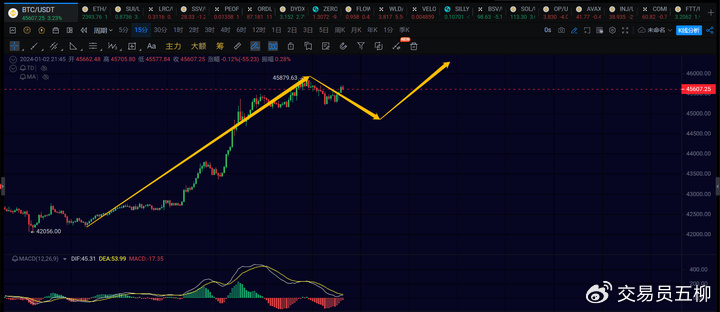
On the 15-minute chart, only the first upward movement on the 15-minute chart has been completed, which quickly rose from 42200 to near 46000. Currently, we are waiting to see if the second downward movement on the 15-minute chart will be completed. If it falls below 45200 again, we will consider that the second downward movement on the 15-minute chart has been completed. If it continues to break through 45879, then we still need to wait for the completion of the second downward movement on the 15-minute chart. We will focus on the area near 46500 for the third upward movement on the 15-minute chart.
ETH
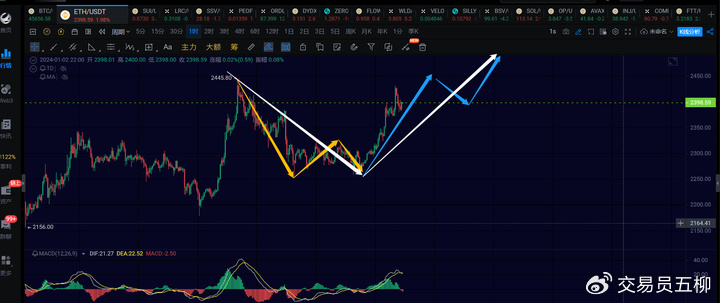
For Ethereum, we are looking for a 4-hour rebound after leaving the central movement. Currently, the first upward movement on the 1-hour chart has not been completed, and there will be a second downward movement and a third upward movement on the 1-hour chart. We can focus on the area near 2500-2600.
On the 15-minute chart, Ethereum still needs one more upward movement on the 15-minute chart to reach around 2440 or higher to complete the first upward movement on the 1-hour chart.
Trend Direction
Weekly Chart: Upward direction, currently continuing the rebound from 15476, pay attention to the subsequent daily chart situation for when it will end.
Daily Chart: Upward direction, the rebound on the daily chart has extended as expected, with the upper target at 46500 or above 48000.
4-hour Chart: Upward direction, currently running the first upward movement of the 4-hour chart after leaving the central movement.
1-hour Chart: Upward direction, the first upward movement on the 1-hour chart has not ended yet, so we will temporarily focus on 46500.
15-minute Chart: Upward direction. Still need one downward movement and one upward movement on the 15-minute chart.
Feel free to follow my public account for further discussion and exchange:

The article is time-sensitive, so please be aware of the risks. The above is only personal advice and is for reference only!
免责声明:本文章仅代表作者个人观点,不代表本平台的立场和观点。本文章仅供信息分享,不构成对任何人的任何投资建议。用户与作者之间的任何争议,与本平台无关。如网页中刊载的文章或图片涉及侵权,请提供相关的权利证明和身份证明发送邮件到support@aicoin.com,本平台相关工作人员将会进行核查。


