I, a commoner, have been working hard in Nanyang, seeking only to preserve my life in the chaotic market, not seeking fame among the nobles, but only seeking to be true to my heart. I really like a quote from Robert T. Kiyosaki, "The love of money is the root of all evil, and poverty is the root of all evil." I believe that everyone in the coin circle is here to profit. I hope that in the days to come, my market analysis can help everyone gain a lot in the coin circle. The sea of learning is boundless, and learning is endless. Continuously increasing one's knowledge and combining one's own trading habits is the only way to survive and achieve one's ambitions in the coin circle.
First, let's analyze the recent market trends of Bitcoin, Ethereum, Ordi, and ACE.
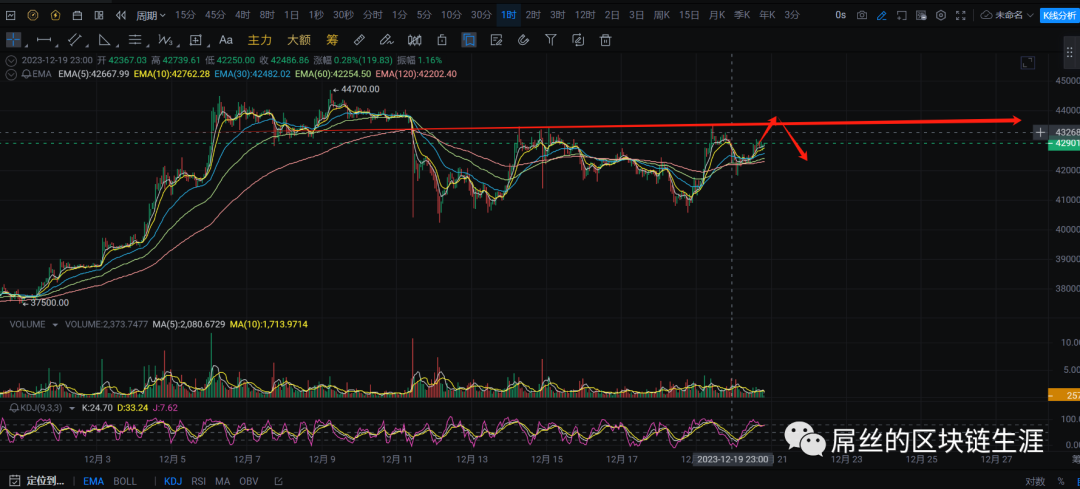
Bitcoin (BTC) yesterday dropped from 43500 to 41900, then rose to around 42850. Looking at the daily chart, the MA30 moving average has not been broken, indicating an overall bullish trend. However, on the 4-hour chart, each high point has been getting lower, leading to repeated market manipulation, causing many people to have wavering wills. The recent trading volume on the 4-hour chart has been extremely weak, indicating a possible major turning point in the next few days. It is advised to set stop-loss orders for futures trading to avoid liquidation in case of a major market movement. On the 1-hour chart, it currently shows a bullish three-line crossover, indicating a bullish trend. The upward trend may continue, but attention should be paid to the key levels of 43500 and the support level of 41800. Once these levels are breached, it signals the beginning of a market reversal. My suggestion is: for those currently holding long positions, set a stop-loss order at 41800. If it falls below 41800, do not hold onto the position. If it breaks through 43500, the 4-hour trend may be restored, and it would be a good time to continue holding long positions.

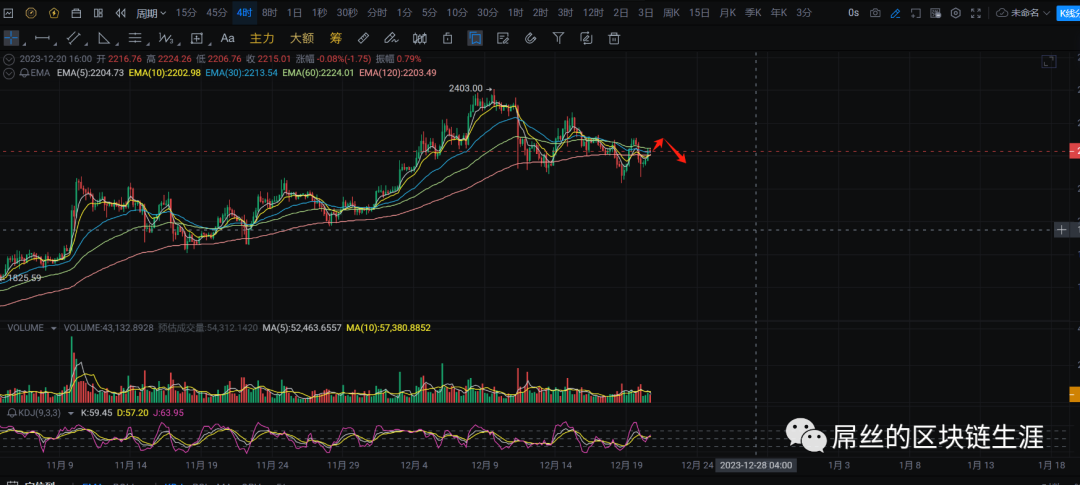
Ethereum (ETH) is currently slightly above the MA30 on the daily chart and has not yet broken through. The trading volume is not particularly high. Looking at the 4-hour chart, the MA30 moving average has once again risen, but the hourly chart currently shows a descending channel. It is advisable to be cautious until the channel is broken. The current support level is not very strong, and attention should be paid to the key level of around 2100. If it falls below this level, it is not advisable to hold onto the position. If it breaks through 2300, the trend will be broken, and long positions can be continued. I personally feel that there will be a period of consolidation here, but I will alert the core group when a turning point occurs. My suggestion is: do not hold long positions until it breaks 2250, and do not short until it breaks the MA30 moving average. If holding long positions, pay attention to the 2250 level.

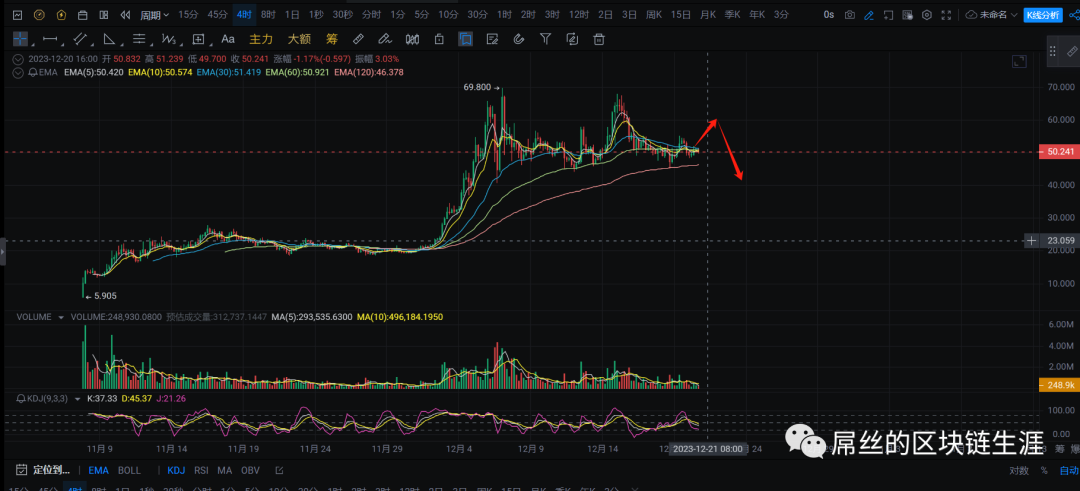
Ordi (Audi), from the daily chart, has approached the MA30 moving average around 40, so special caution is needed during the market reversal. Looking at the 4-hour chart, the current 70 level is a double top, and it is difficult to break through in the short term. The MA120 moving average has not been broken yet, and I believe it is forming a double top pattern. On the 1-hour chart, the price has just crossed the moving average, and there may be a certain amount of upward movement in the short term, but the strength may not be too strong. I think reaching around 58 would be quite good, but I suggest exiting at this point. This is also the only opportunity to exit, and there is likely to be a return to the 40 level in the future. My suggestion is: in the short term, you can enter long positions, set a stop-loss order at 46, and look for an increase to around 56-58.

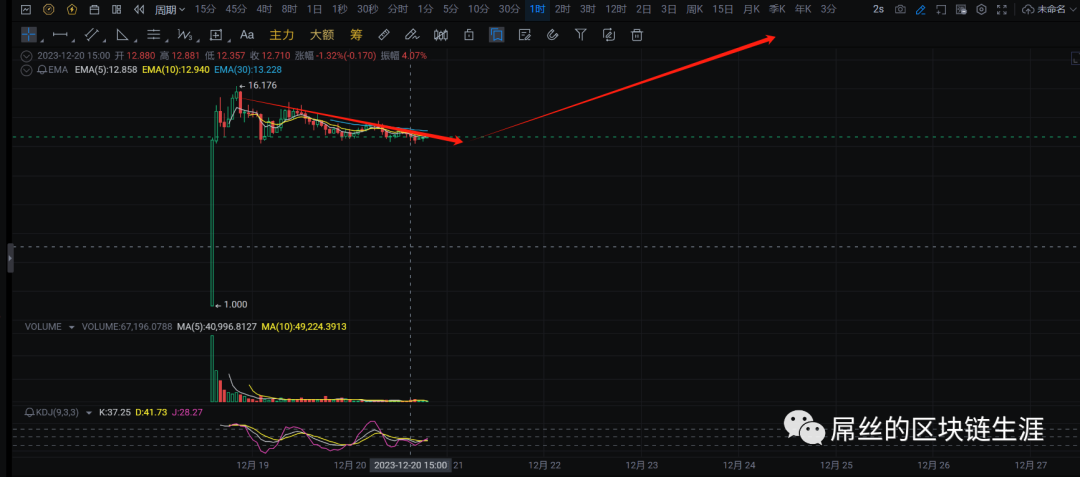
ACE, this coin is currently a new one, and I personally have a positive outlook on it. Although it has dropped from a high of around 16 to around 12, due to the project's lock-up and staking mining, most of the coins are not in circulation. The mining cost is around 7.5U, and it is highly likely that most have already profited and exited. For the market makers who want to control the market, what they are doing now is simply shaking out the weak hands. For those who have invested in Binance, I believe it is a good opportunity to enter boldly when it drops to around 10, with at least a threefold upside potential.

All the above suggestions are personal opinions and do not constitute investment advice. There are risks in the coin circle, so caution is required in trading.

免责声明:本文章仅代表作者个人观点,不代表本平台的立场和观点。本文章仅供信息分享,不构成对任何人的任何投资建议。用户与作者之间的任何争议,与本平台无关。如网页中刊载的文章或图片涉及侵权,请提供相关的权利证明和身份证明发送邮件到support@aicoin.com,本平台相关工作人员将会进行核查。


