Click to watch the video: Master Chen 12.20 Video: Finding Time Cycles in Historical Patterns to Analyze the Future Market Top
Today's video will focus on predicting the future top and the timing of the top of Bitcoin, including sharing some knowledge in the charts.

First, let's take a look at the weekly chart of Bitcoin's naked K-line form. A simple method is to observe the high regularity of Bitcoin's top or bottom cycles. Generally, if there is a large wave of rise or fall, Bitcoin is close to the spring position, especially starting from November, December, or January, there may be a significant drop.
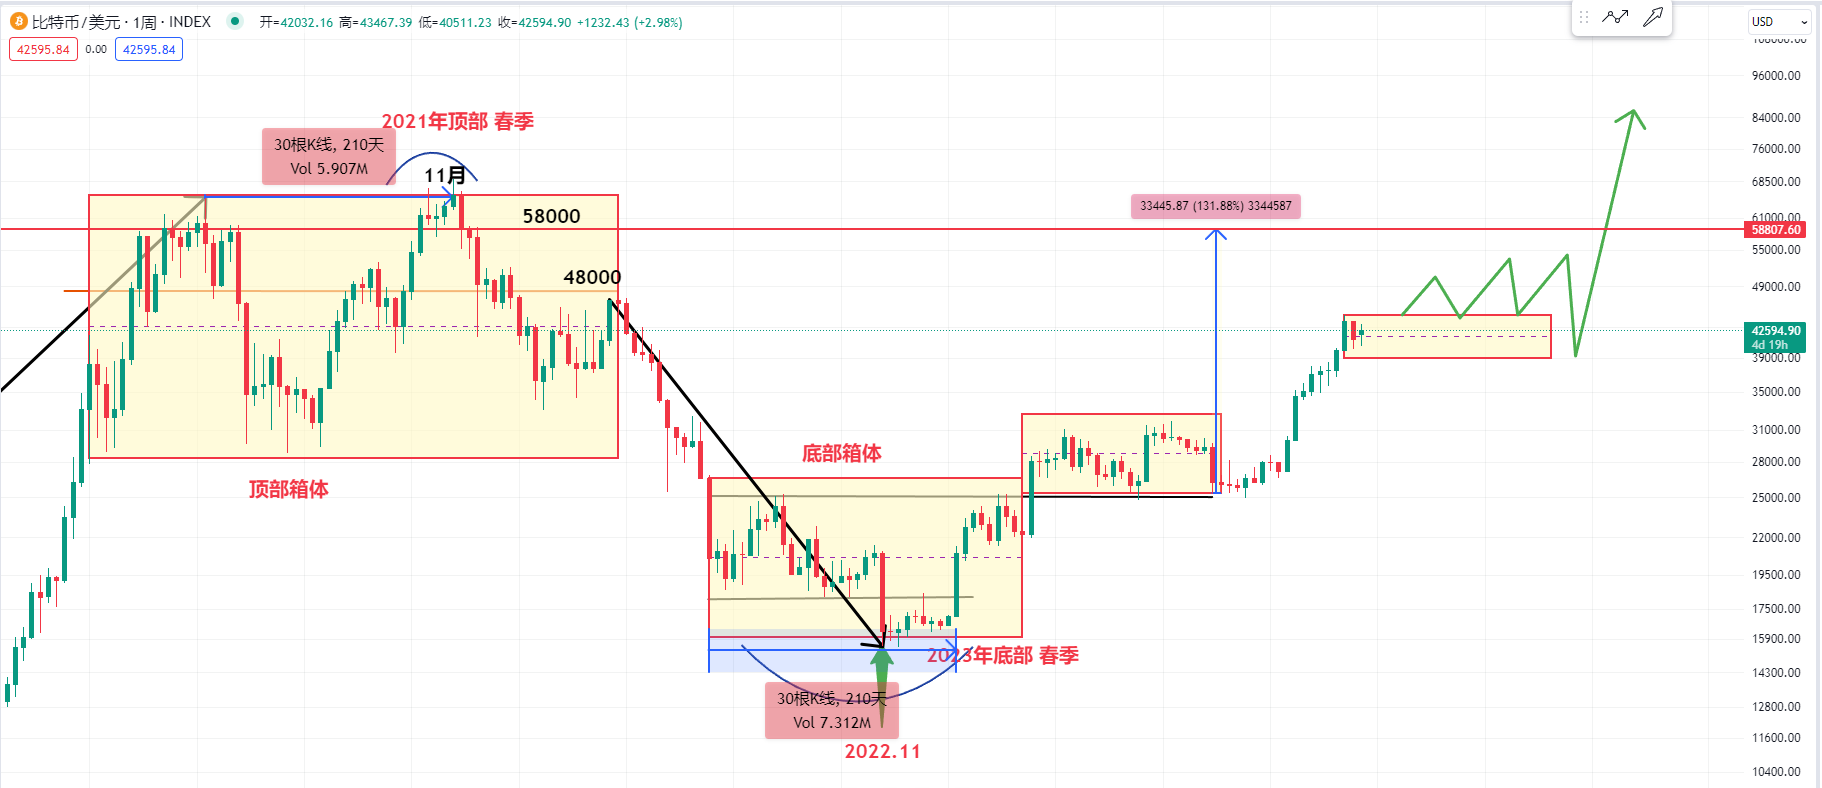
For example, in January 2022, the range of 15,000 to 16,000 is the bottom of Bitcoin in the spring of 2022. Then let's take a look at the top of Bitcoin in 2021, which is also close to the spring position, reaching a high of 69,000 in November 2021. Therefore, starting from November, we need to pay attention when Bitcoin experiences a significant rise, especially in a crazy bull market or a sharp bear market.

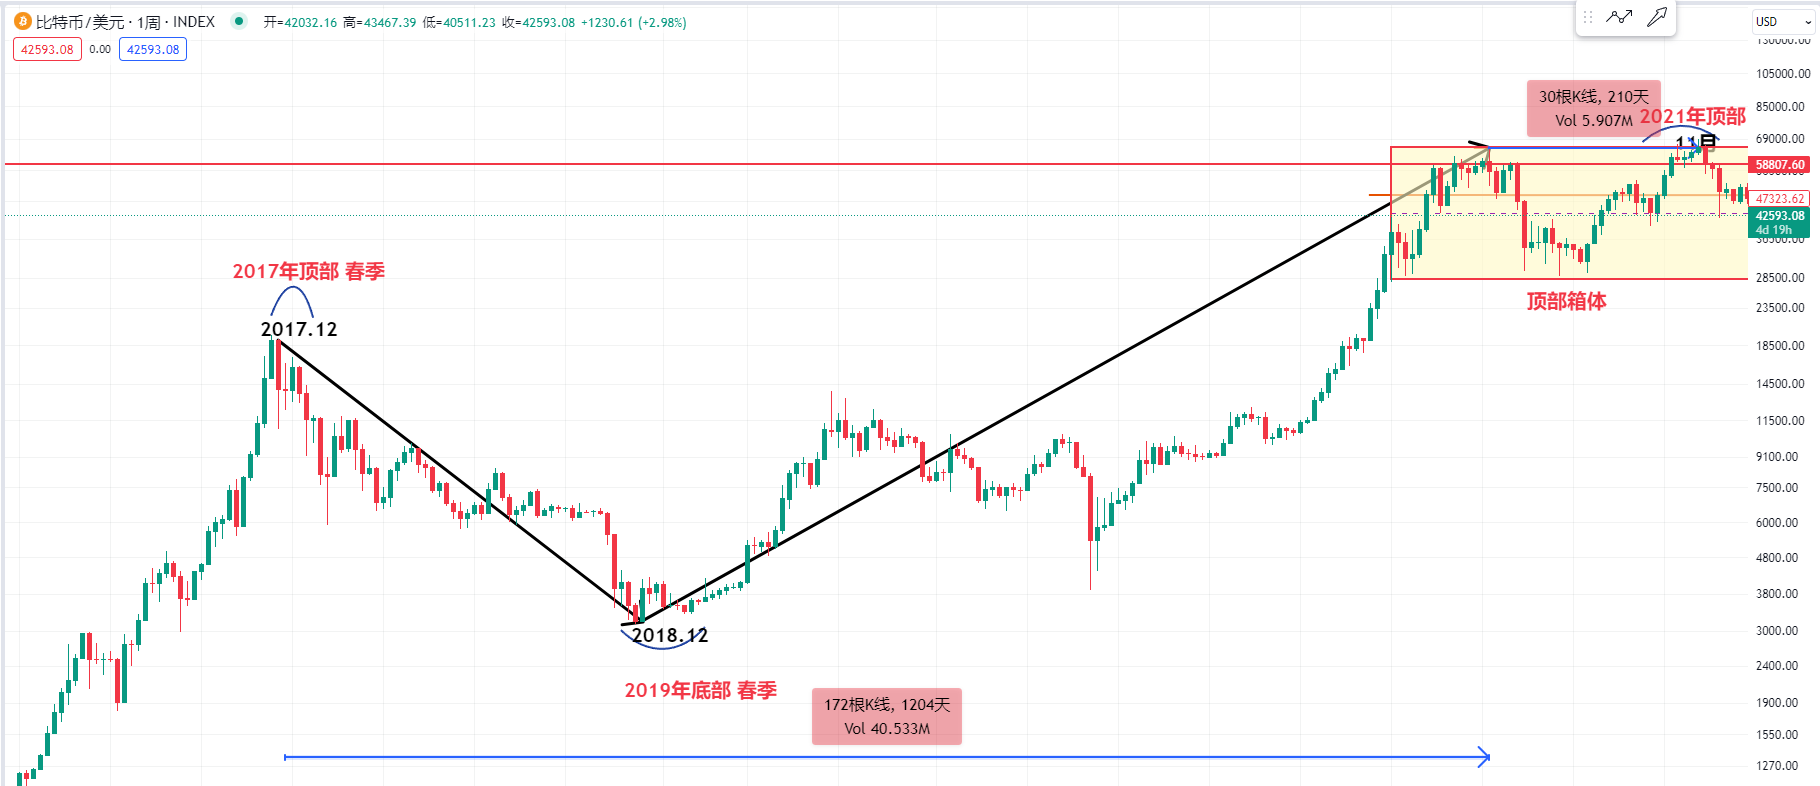
We can also observe the bottom of Bitcoin in 2019, which occurred around December 2018, and the top of Bitcoin in 2017, which also happened in December 2017. It is noticeable that these events all occurred close to the spring season, indicating the possibility of a major drop at the bottom and a potential top near the spring season.

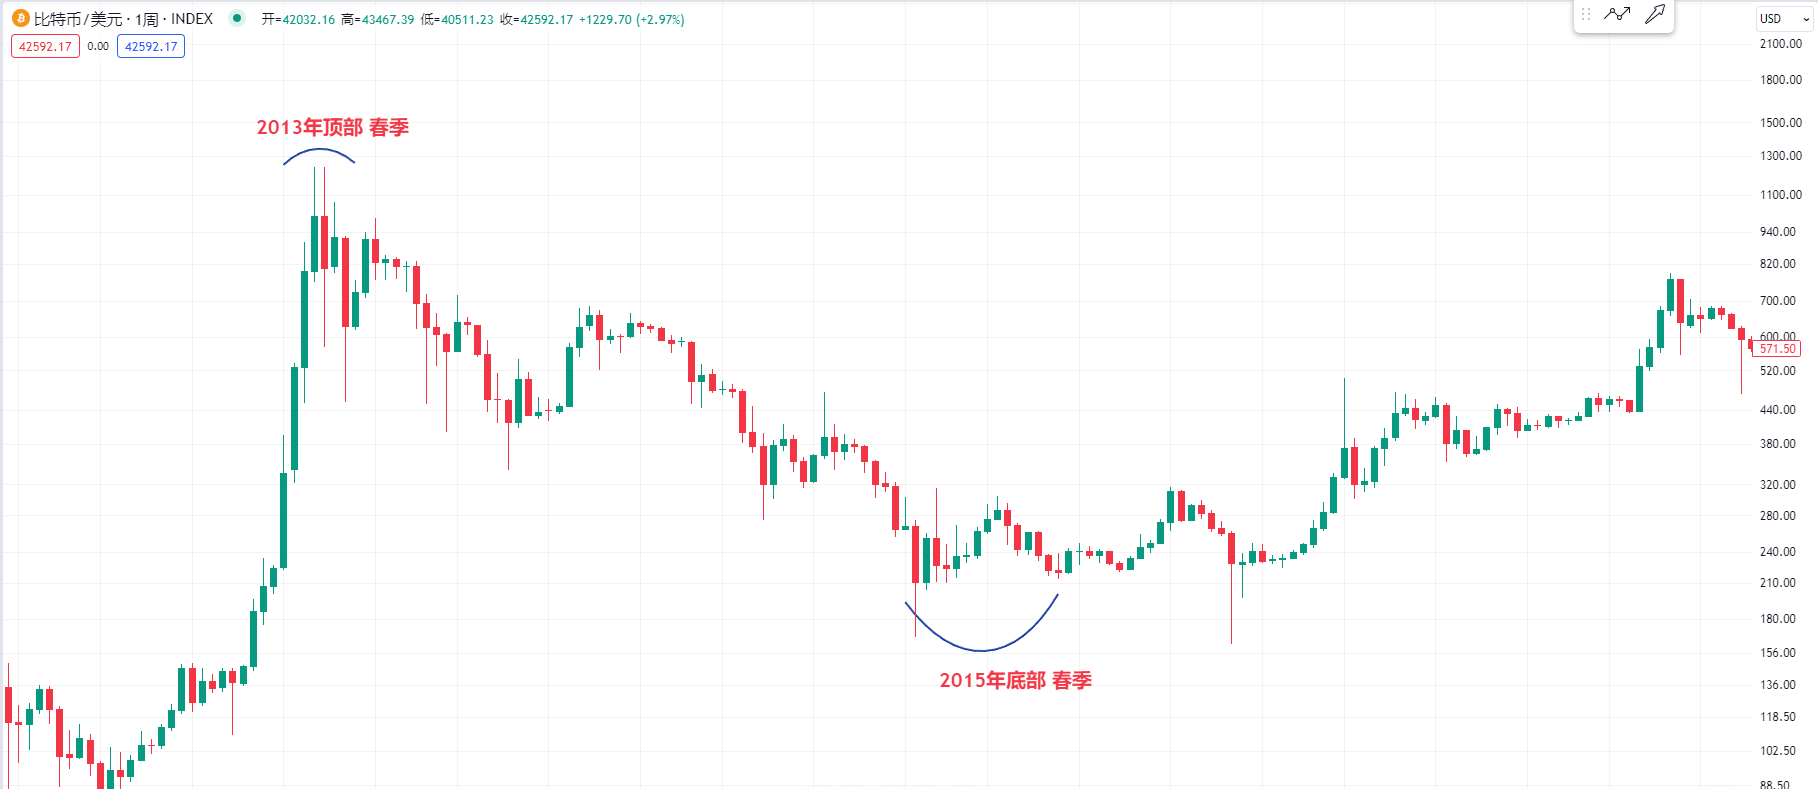
Furthermore, we can see a similar pattern in 2015 and 2013. In January 2015, Bitcoin was near 100 to 200 US dollars, which was the bottom of Bitcoin in the spring of 2015. Then, looking at the top of Bitcoin in 2013, it reached a very high position near the spring of 2013 or in November 2013, indicating the top of Bitcoin.
Therefore, in every bull market or bear market in Bitcoin's history, the cycle of its top and bottom is very high and follows a regular pattern. In my personal opinion, we are still very far from the top at the moment. Also, I want to mention a specific time point today, which is to be cautious about Bitcoin in November 2025, especially in November 2025.

We can see that in a large bear market cycle, the period of possible rise will last at least three years. So, as of 2022 or 2023, only one year has passed, and another year will pass in 2024 and 2025. My view is that we need to pay attention starting from November 2025. Therefore, I am also planning to look for opportunities to short Bitcoin around November 2025.
Because in a bear market, the decline can be very fast, and the profit can be substantial. Unlike the current bull market, which requires a push in funds, especially if it may consolidate for more than 200 days. As it is currently in December, and soon entering January, some friends are worried about a potential drop at this point. I hope it doesn't drop because I have been holding onto the profits. My ideal scenario is that it will consolidate in this range for some time, or it will break through 48,000 before halving and then possibly consolidate at a high point before a new drop, creating a low point for the crazy bull market to start again.
Moreover, let's observe the time within this range. Have you noticed a phenomenon? The top box, which I have mentioned before, may consolidate in this range, and I have also mentioned that Bitcoin may erupt in October. Now, Bitcoin has indeed risen as expected in October. After the price rises, will there still be room for growth? My view is that since the time has been replicated, from 48,000 to 25,000, a drop of about 33,000, we can replicate from 25,000 to add 25,000, which is roughly around 58,000. If it surpasses 48,000 and consolidates further, we need to pay attention to the next pressure point, which may not necessarily be at 69,000.
In this case, if there is consolidation around 58,000, we need to pay attention to whether there will be pressure at this point. Of course, my view is that there will definitely be pressure later, including the 69,000, which I have mentioned for some time, will definitely be broken.

Because we can see from the weekly chart of Bitcoin, I have mentioned that in the morphological theory, the high point of 69,000 is roughly in the range of 30,000, and all below it is digging a pit. My view is that breaking the box, that is, the trend of breaking the bottom, will definitely break the high point of 69,000 in the future. Therefore, if Bitcoin really experiences a decline, it will also be an opportunity for spot and medium- to long-term purchases.
For more strategies, you can add real trading accounts.
Candlesticks are king, trends are emperor. I am Master Chen, focusing on BTC and ETH spot contracts for many years. There is no 100% method, only 100% trend following. I update macro analysis articles and technical analysis review videos daily across the web!  Friendly reminder: Only the public account in the column (as shown in the picture) is written by Master Chen. The advertisements at the end of the article and in the comments are not related to the author. Please be cautious in distinguishing between true and false. Thank you for reading.
免责声明:本文章仅代表作者个人观点,不代表本平台的立场和观点。本文章仅供信息分享,不构成对任何人的任何投资建议。用户与作者之间的任何争议,与本平台无关。如网页中刊载的文章或图片涉及侵权,请提供相关的权利证明和身份证明发送邮件到support@aicoin.com,本平台相关工作人员将会进行核查。


