Click to watch the video: Master Chen 12.19 Video: Will the Market Hold Support? Bullish Signal in MACD Indicator?
Yesterday, Bitcoin held the short-term support at $40,500 and rose by 3%. In today's video, we will discuss whether Bitcoin has sounded the call to attack, including why $40,500 is such a strong support and why I remain firmly bullish.

First, let's take a look at the 12-day chart of Bitcoin. The MACD indicator is quite remarkable. It showed a golden cross at the bottom of Bitcoin's $15,000 to $16,000 range last year. I have also mentioned to everyone that if the 12-day MACD drops more than 10 or 20 bars below 20,000, it is a good time to buy Bitcoin. As the top asset globally, if there is a significant drop in the 12-day MACD and a low point, it is a good time to prepare for buying.
Alternatively, if you want to observe for the time being, this indicator is also very accurate. The golden cross of the 12-day MACD at the bottom has a 100% accuracy rate. As long as you buy at the golden cross position, the subsequent profits are very substantial. Additionally, if the MACD is consistently above the zero axis, this is one of the reasons why I remain firmly bullish.
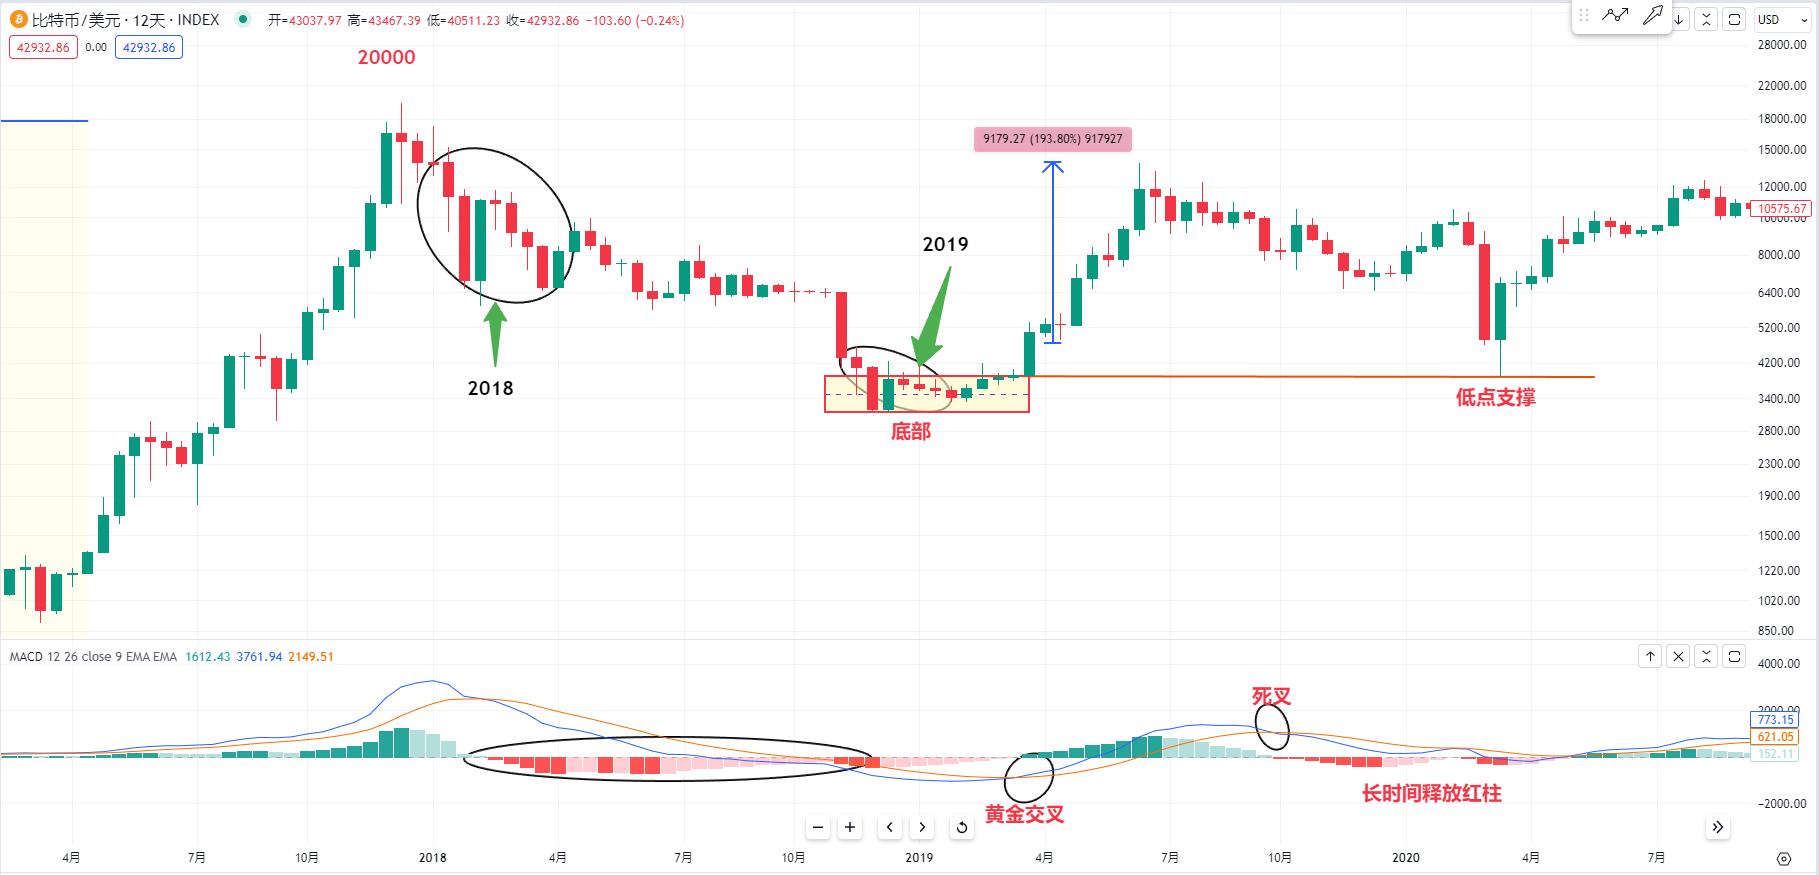
We can see that at the bottom of Bitcoin in 2019, there was a significant bear market. If the 12-day MACD death cross drops more than ten or twenty bars, it is a good time to buy at the bottom of a major collapse, or you can wait for the golden cross. The golden cross at the bottom of 2019 resulted in nearly a 2x increase in price.

Next, let's look at Bitcoin at the bottom in 2015. The MACD dropped by more than ten bars, indicating a bottom for buying, or you can wait for the golden cross, which also has a 100% accuracy rate. The price at the golden cross position is around $250, and the potential profit from buying at $250 and selling at the top should be more than 70 to 80 times.
Therefore, the golden cross at the bottom of $15,000 to $16,000 last year resulted in a significant uptrend, with the first wave rising 100% to $31,000. I have also planned with everyone that you should pay attention to this 12-day MACD. In the history of the bull market, there may only be one death cross when the first wave of the golden cross comes to the zero axis. The death cross may only appear once, as I mentioned when it was around $25,000, I said that you must buy spot.
Because it is a death cross above the zero axis, if you don't buy at this position, when will you buy? We can also combine it with other technical formations, such as the very large head and shoulders bottom breakthrough position, which has support at the neckline. We can buy at the death cross position and not wait for the golden cross position, as the space for the golden cross may have already come up.
So, if you buy at this position, I hope everyone will hold on. Historically, if a golden cross appears, there will only be one death cross in the bull market process.
We can see Bitcoin in the 2019 bull market, where the golden cross appeared at this position, and then there was only one death cross. Alternatively, you can also combine it with other technical formations. This low point is the support at the bottom and also the support at the neckline. So historically, in the 2019 bull market, there was only one death cross because the first wave of the increase was too large, so the time for the release of the red bars for the death cross was too long.
Then we can look at the bull market from 2015 to 2016. It rose to this position, and the MACD indicator did not have a death cross. There was also no death cross in the subsequent bull market. Only at this position, there was a significant drop of nearly 40%, with three death cross red bars. After buying in, there was no more death cross, and it continued to rise to the top of $20,000 for Bitcoin.
So currently, I am also planning. Has the time for the golden cross at this position been enough? If it rises another six times, it will not be inferior to the bull market in 2020. We can observe that the price is almost at $200,000.
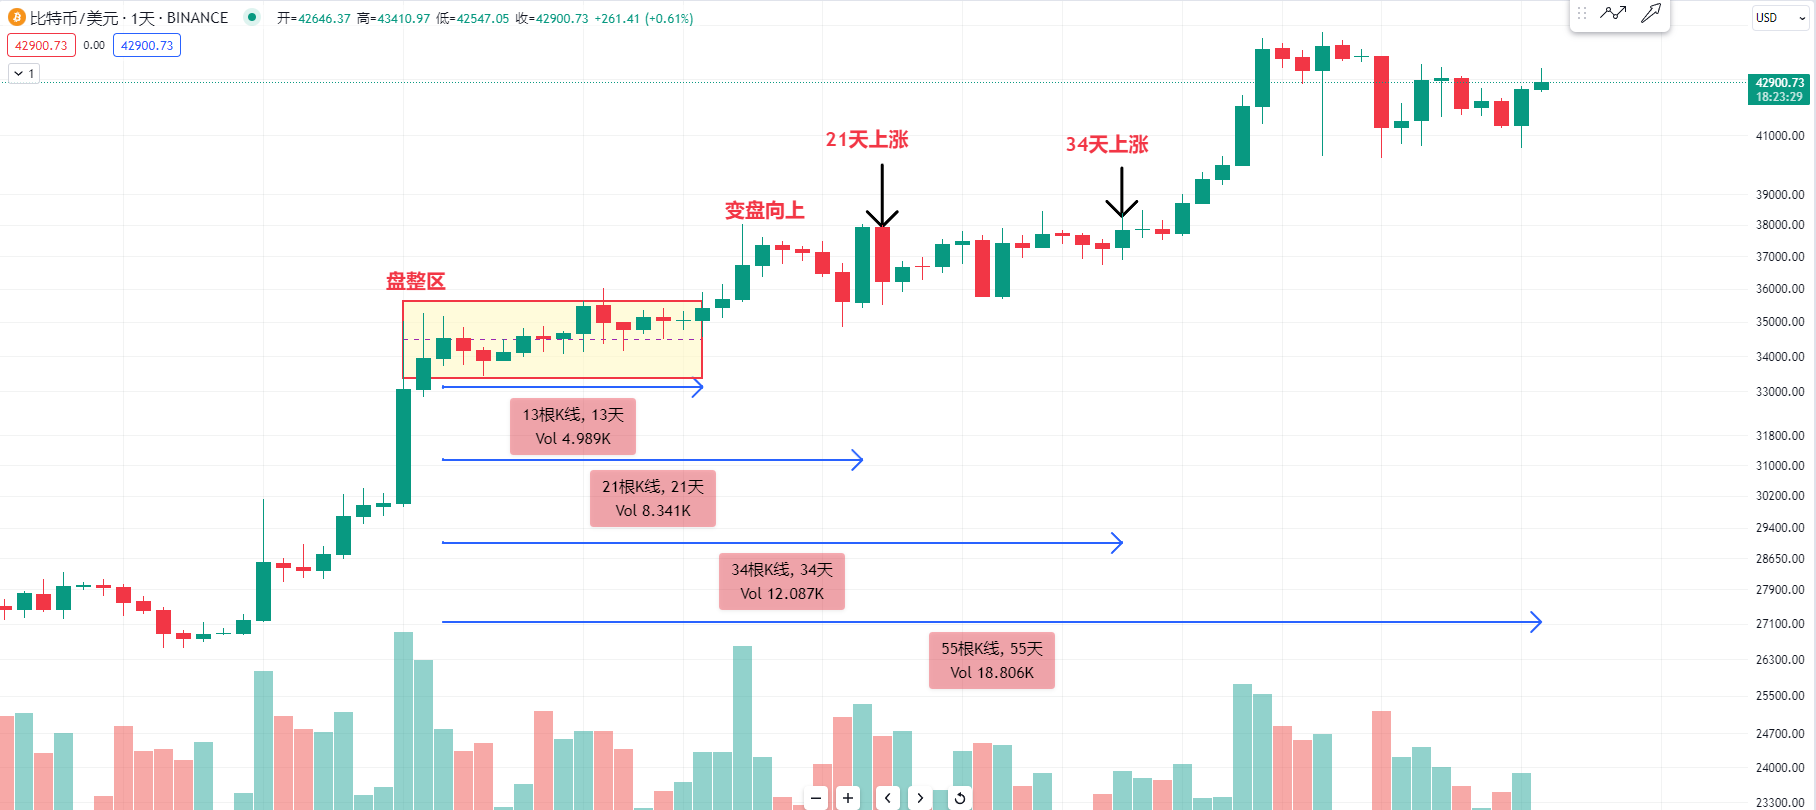
Next, let's look at the daily time period of Bitcoin. I have been mentioning these two days that when Bitcoin rises from $26,000 or $25,000, this candlestick is a consolidation area. It has been consolidating for 13 days, and this position is a turning point for an upward trend. Then, from this candlestick, it rose for 21 days, or from 34 bars, it continued to rise. I have also been judging these two days whether it will rise on the 55th day, but the time yesterday was earlier than expected.

Then we can see why the support below is so strong. I have been saying these two days that the short-term support at $40,500 cannot be broken, and I did not expect the support to be so strong. I have been worried these two days that this position will fall below. Let's observe. Currently, it is a bull market. Sometimes, some of the support levels I provide are reliable. For example, we can see why the support at $40,500 is so strong. It is because this candlestick's significant drop has a large volume. Therefore, many technical analysts are watching this support level to see if it will hold, as it is unclear whether it is the main force selling or retail buying. If the support at this position holds, it is not ruled out that there will be an upward attack. However, in the short term, we also need to observe a pressure level, which is the high point at around $43,800. Will there be pressure at this level, or it is best to quickly break through above $44,000.
For more strategies, you can join the live trading.
Candlesticks are king, trends are emperor. I am Master Chen, focusing on BTC and ETH spot contracts for many years. There is no 100% method, only 100% trend following. I update macro analysis articles and technical analysis review videos daily across the web!  Friendly reminder: This article is only written by Master Chen in the public account (as shown in the picture above). The end of the article and other advertisements in the comments section are not related to the author. Please carefully distinguish between true and false. Thank you for reading.
免责声明:本文章仅代表作者个人观点,不代表本平台的立场和观点。本文章仅供信息分享,不构成对任何人的任何投资建议。用户与作者之间的任何争议,与本平台无关。如网页中刊载的文章或图片涉及侵权,请提供相关的权利证明和身份证明发送邮件到support@aicoin.com,本平台相关工作人员将会进行核查。


