- The Federal Reserve's decision not to raise interest rates
The annual interest rate meeting of the Federal Reserve in 2023 decided to keep the benchmark interest rate unchanged in the range of 5.25% to 5.50%, as expected. In the eight decisions made this year, the Federal Reserve raised interest rates by 25 basis points four times and kept rates unchanged four times. This round of interest rate hikes should be over; the dot plot suggests at least three rate cuts next year (the market is betting on six rate cuts), with an expected cumulative reduction of 150 basis points. Federal Reserve Chairman Powell's stance at the post-meeting press conference also showed a clear dovish shift, acknowledging for the first time that the Federal Reserve has begun discussing rate cuts. The quarterly economic forecast of the Federal Reserve shows that the core inflation rate is expected to decrease to 3.2% in 2023 and further decrease to 2.4% in 2024. The actual GDP growth rate for 2024 is expected to be revised down from 1.5% to 1.4%.
[BTC Analysis Today]
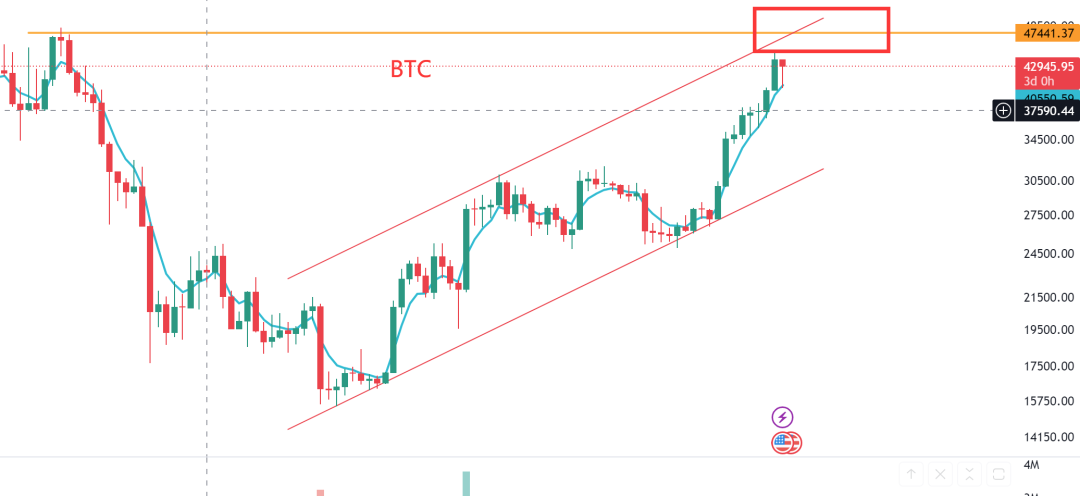
On the daily chart, after quickly reaching 40,000 points, the price of Bitcoin rose again to around 43,000, which is the previous range of oscillation and is considered a high-level oscillation area.
There is support at the lifeline of 40,170U below. If the lifeline is not broken, holding the currency for a rise can continue. However, from the current daily chart, the previous bullish momentum of Bitcoin is significantly greater than the current bullish momentum. This adjustment period should not be too short this time and may last for a month or even until January 10th, after the results of the BTC spot ETF are announced.

On the weekly chart, BTC reached the position near the 5-week moving average, forming a high-level hanging man pattern. The bullish momentum is starting to weaken, and bearish resistance is beginning to appear. The price has risen from 27,200 to the high of 44,700, and there is still room for further upward movement. If there is an opportunity to reach the range of 48,000 to 52,000, it will be a temporary top.
Of course, it is also possible that 44,700 is the current temporary high point. It depends on whether there will be another strong rise to break through 44,700 again and whether the 5-week moving average can hold steady.
[BTC Phase Target Analysis]
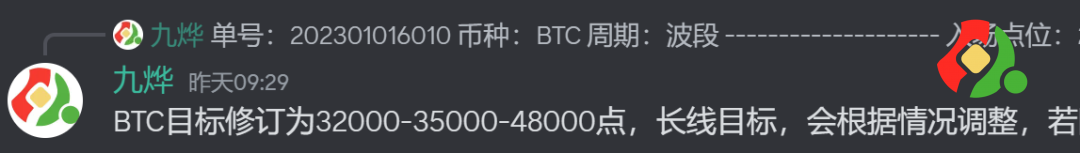
After the start at 27,200, on October 16th, we adjusted the targets based on the actual trend of Bitcoin as follows: 32,000-35,000-48,000 points. The price has now reached near 45,000 points and has also broken through 38,000 points, initiating the third wave of the main upward trend. The daily chart MACD has been repaired, and it is believed that the bullish momentum will remain strong until the expected target of 48,000 and the upper channel range of 51,000.
[BTC Breakthrough After 4 Years]
On the monthly chart, BTC's November monthly closing price was 37,700U, and the upward trend is undeniable. There is no need to imagine a return to below 30,000 points, at least not for now.
The monthly chart shows a bullish trend, with the moving average system forming a bullish alignment, the MACD line gradually starting to cross above the zero axis, and the KDJ turning upwards again. These technical indicators once again confirm the view that Bitcoin's trend has arrived, and it is now in the early stage of a bull market.

Looking back at Bitcoin's price trajectory over the past decade can provide some insight into future price trends. In November 2015, Bitcoin's price rose above the 30-month moving average, and since then, it has not fallen below the 30-month moving average. It surged along the 5-month moving average to its peak of 20,000 points in 2017. At that time, Bitcoin rose from 400 points to 20,000 points, a 50-fold increase.
In April 2019, Bitcoin also crossed above the 30-month moving average, and the price surged from 4,000 points to 69,000 points over the next two years, an 11-fold increase.
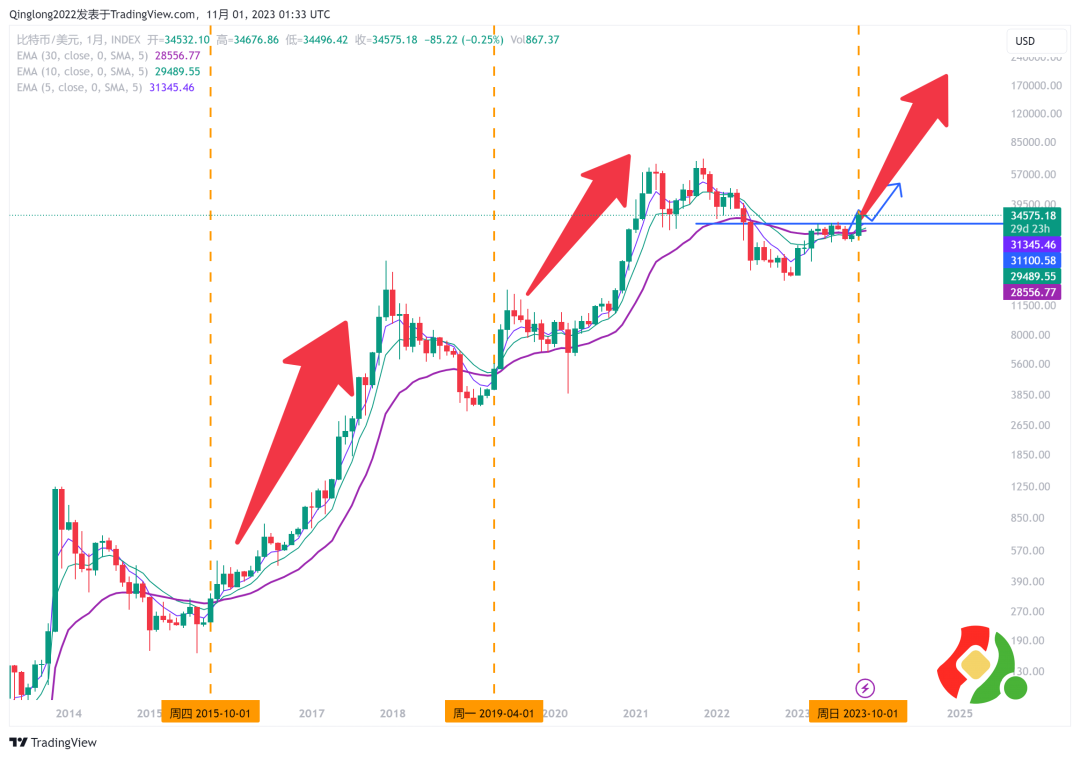
After 4 years, Bitcoin has once again shown a bullish trend with the monthly chart crossing above the 30-month moving average. Bitcoin is now in the early stages of a bull market, and it is truly the beginning of a bull market.
Although history does not repeat itself, it will certainly rhyme, just with different versions, characters, and stories.
[ETH Trend Analysis]
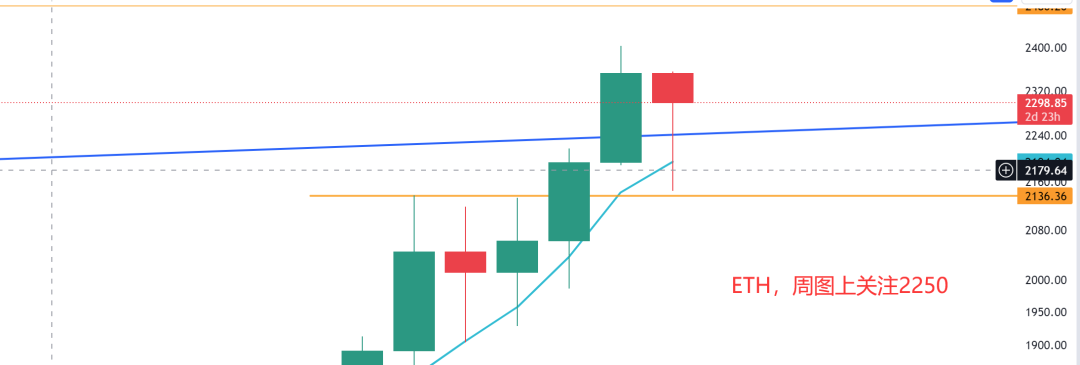
On the daily chart, after a standard retest of the lifeline, Ethereum has stopped falling and rebounded. The upper resistance level is at 2,330U. If this level is broken, it may set a new high. The lower support level is at 2,250U. If the lifeline is not broken, it is advisable to patiently hold the currency for a rise and be prepared for long-term sideways oscillation.

On the weekly chart, Ethereum's moving averages have confirmed the formation of a golden triangle pattern, signaling a strong upward trend. However, after last week's chart retested the 5-week moving average and rose again, a high-level hanging man pattern has formed. The important support level is at 2,250U. If held, it will lead to high-level consolidation, and a new trend will begin. If not held, further observation is needed.
On the monthly chart, it is highly likely that Ethereum will lead the way in December and January of the following year. The moving average system has also formed a bullish alignment, and the MACD indicator has started to cross above the zero axis after the golden cross. The KDJ is also in a golden cross pattern. These are all strong price performances for Ethereum on the monthly chart. Those who entered Ethereum at 1,626U earlier should hold on, and the only risk is not being able to hold on.
[OP Trend Analysis]
OP, as a leading coin in the L2 protocol, was initially purchased at 1.27U. It has experienced two key neckline breakthroughs at this level: the first at 1.42U, where it consolidated for over ten days before finally breaking through; the second at 1.82U, which is a double bottom pattern on the weekly chart. At this level, it consolidated for nearly a month before breaking through. Its breakthrough means that OP will once again open up upward momentum and accelerate its rise.

Looking at the daily chart, OP's price has already broken through the neckline on the weekly chart. The next target will be the height of a W-shaped bottom, with a target of 2.7U. The current highest rebound is near 2.5U, which is just a step away. In the next steps, OP will patiently wait for the breakthrough of 2.7U. If it breaks through, there will be a new high, and subsequent oscillations are likely to occur between 1.9U and 2.7U, and the low-level chips should still be held.
[SOL Trend Analysis]
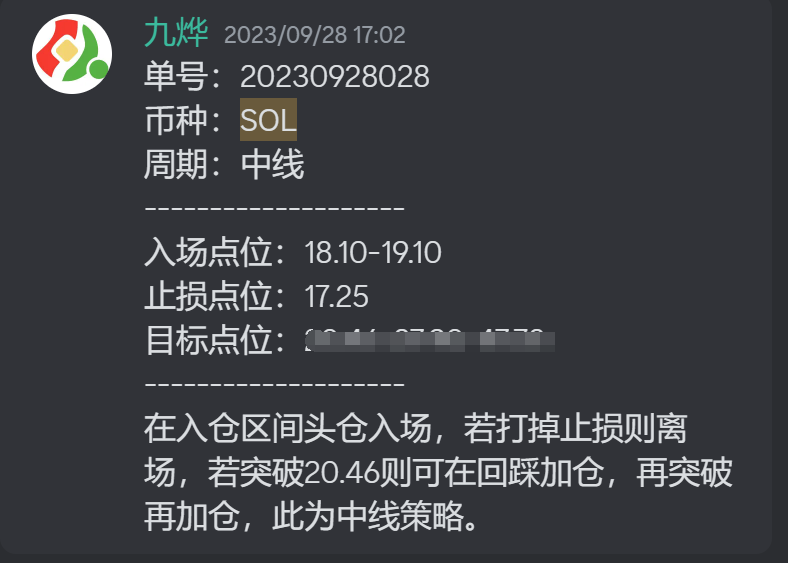
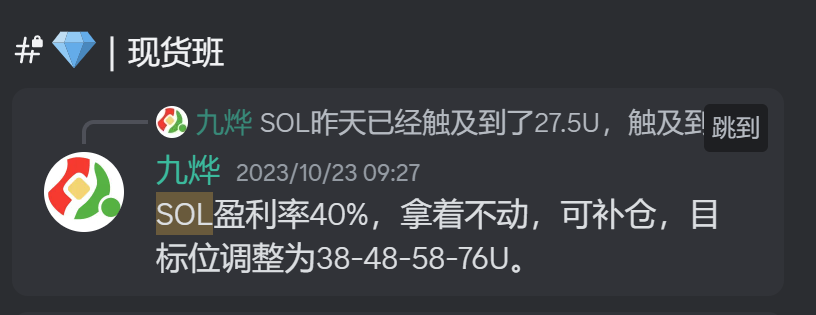
SOL, as one of the most influential public chain projects that is comparable to Ethereum, was affected by the collapse of FTX and experienced a revival in 2023, breaking free from its previous shadow and predicament. Since entering at $19.1, the highest price has risen to $77.78.
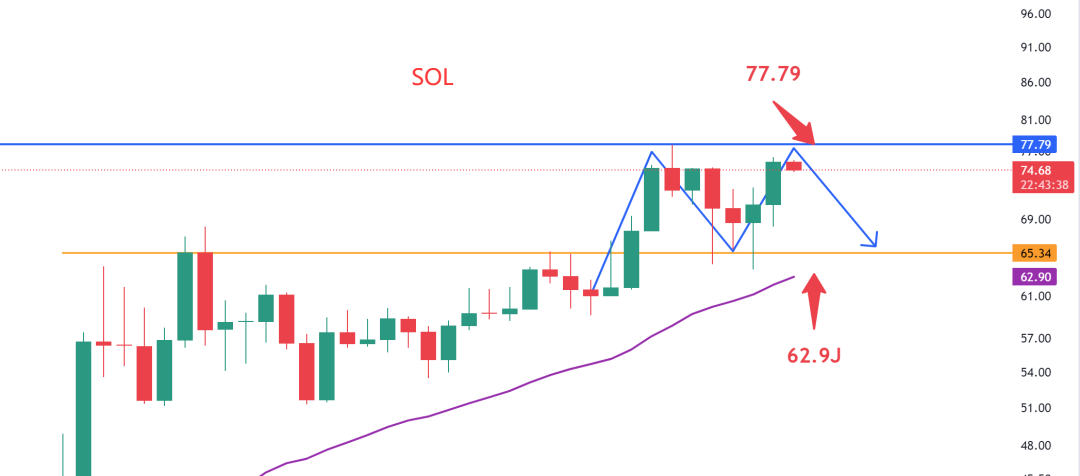
From a technical chart perspective, $77.79 is likely a temporary high point for SOL. The daily chart already shows a weakening of bullish momentum, and those who have chips at the bottom should consider reducing their positions near 77U.
[Quotes from Jiu Ge]
Candlestick language is a result. Whatever we know or don't know, whatever is happening or will happen, will be reflected in the candlestick language. With time verification and continuous price increases, the answers will be revealed.
The best reason for an uptrend is the uptrend itself, and the best reason for a downtrend is the downtrend itself. Once a trend is formed, it will not change easily. Just follow the trend, ignore all external news, focus on the candlestick language, and focus on the trading system. Everything else is just a distraction.
In a bull market, the only risk is not being able to hold on.
Although history does not repeat itself, it will certainly rhyme, just with different versions, characters, and stories.
免责声明:本文章仅代表作者个人观点,不代表本平台的立场和观点。本文章仅供信息分享,不构成对任何人的任何投资建议。用户与作者之间的任何争议,与本平台无关。如网页中刊载的文章或图片涉及侵权,请提供相关的权利证明和身份证明发送邮件到support@aicoin.com,本平台相关工作人员将会进行核查。


