[Institutional BTC Spot ETF Related Reports]
Bitwise has submitted the second revised S-1 document (prospectus) for the Bitcoin spot ETF application to the U.S. SEC, indicating that the dialogue between the SEC and potential issuers is still ongoing.
BlackRock has submitted the second revised S-1 document (prospectus) for its Bitcoin spot ETF application to the U.S. SEC.
Swiss asset management company Pando Asset has filed a 19b-4 document with the SEC, formally joining the competition for a U.S. spot Bitcoin ETF. Last week, the company submitted an S-1 application. Currently, there are 13 potential issuers for spot Bitcoin ETFs.
Hashdex's Head of U.S. and Europe Products, Dramane Meite, stated that the exact timing for the launch of the Bitcoin spot ETF is still unclear. However, in 2023, the launch of the product has shifted to being just a matter of time, and the first spot Bitcoin ETF is expected to land in the U.S. in the second quarter of 2024, followed by a spot Ethereum ETF.
Investment giant BlackRock disclosed in its latest application submitted to the U.S. SEC that the company has secured $100,000 in seed funding for its proposed spot Bitcoin ETF.
Jiuge's View: Expectations for the approval of the BTC spot ETF and related work have been ongoing, and the fact that BTC's price has risen from $28,000 to $44,000 is the best proof.
[BTC Daily Analysis]
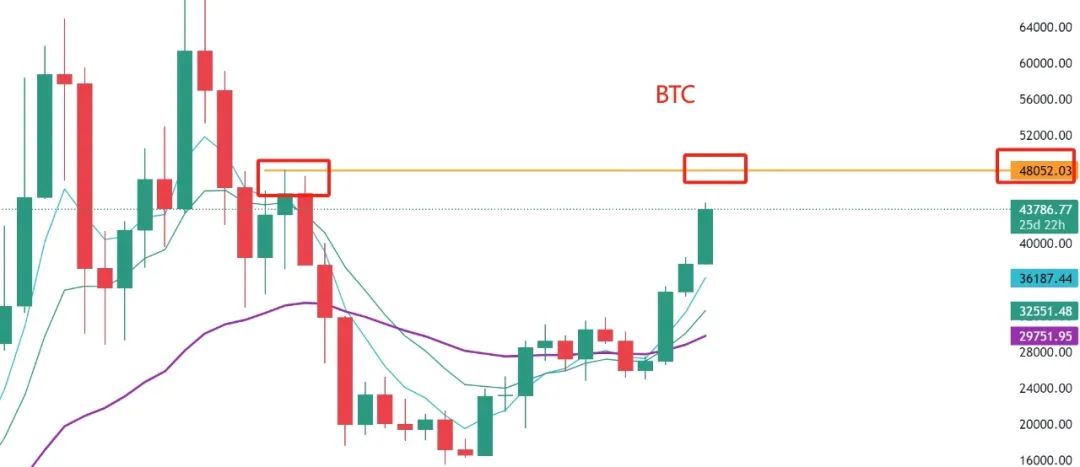
On the daily chart, from the perspective of moving averages, BTC has not fallen below the 30-day moving average since our entry at $27,200, and has finally seen an accelerated upward trend with the re-crossing of short-term moving averages.
The MACD has also completed its indicator repair, forming a golden cross with the moving averages after returning to the zero axis.
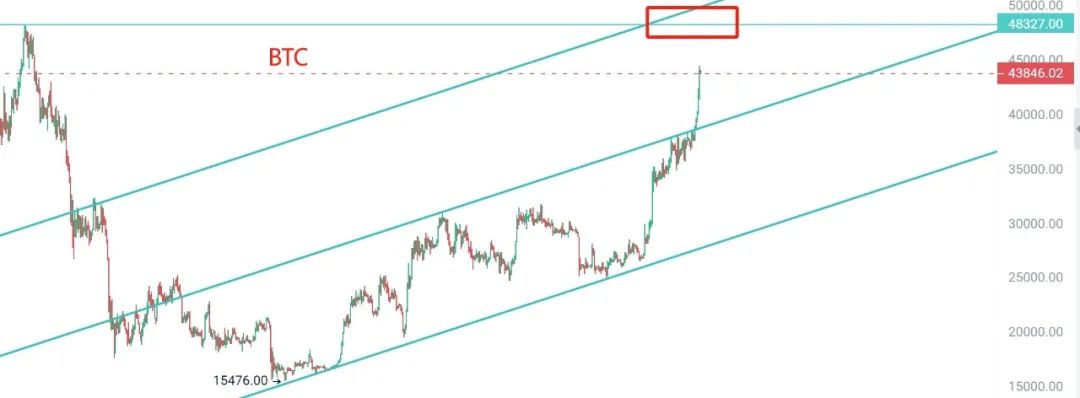
BTC surged to $44,488 yesterday, just a step away from $48,000. Since breaking through the upper bound of the uptrend channel at $38,000, Bitcoin has once again embarked on a new uptrend. From a wave perspective, it also exhibits a three-wave pattern.
[BTC Phase Target Analysis]
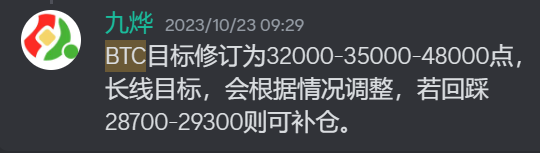
After the $27,200 initiation, on October 23, we adjusted the targets based on the actual trend of Bitcoin as follows: $32,000-$35,000-$48,000. The price has already reached around $45,000, and with the breakout above $38,000, a new uptrend (3rd wave) has begun. With the completion of the MACD indicator repair on the daily chart, Jiuge believes that the bullish momentum will continue until the expected targets of $48,000 and the upper bound of the channel near $51,000 are reached.
[Trend Analysis: BTC's Breakthrough After 4 Years]
On the monthly chart, BTC closed at $37,700 in November, and the upward trend is undeniable. There is no need to entertain the idea of falling below $30,000 again, at least not for now.
The monthly chart shows a single positive candlestick crossing three negative ones, and the moving average system presents a bullish alignment. The MACD line is gradually beginning to cross above the zero axis, and the KDJ has also turned upwards again. These technical indicators once again confirm the view that Bitcoin's trend has arrived, and it is indeed the early stage of a bull market.
Looking back at Bitcoin's price movements over the past decade can provide some insight into future price trends. In November 2015, Bitcoin's price crossed above the 30-month moving average, and since then, it has not fallen below this level. It surged along the 5-month moving average to its peak of 20,000 points in 2017, marking a 50-fold increase from 400 points.
In April 2019, Bitcoin once again crossed above the three-month moving average, and over the next two years, the price surged from 4,000 points to 69,000 points, an 11-fold increase.
After 4 years, Bitcoin has once again seen a single positive candlestick crossing three negative ones on the monthly chart, indicating that it is in the early stage of a bull market, and a true one at that.
History may not repeat itself, but it will certainly rhyme, albeit with different versions, characters, and stories.
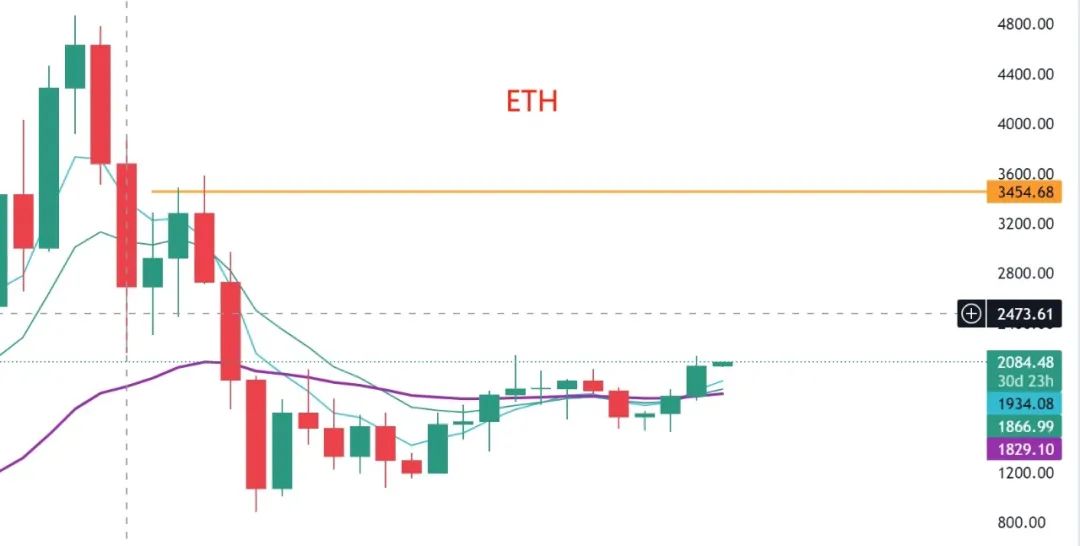
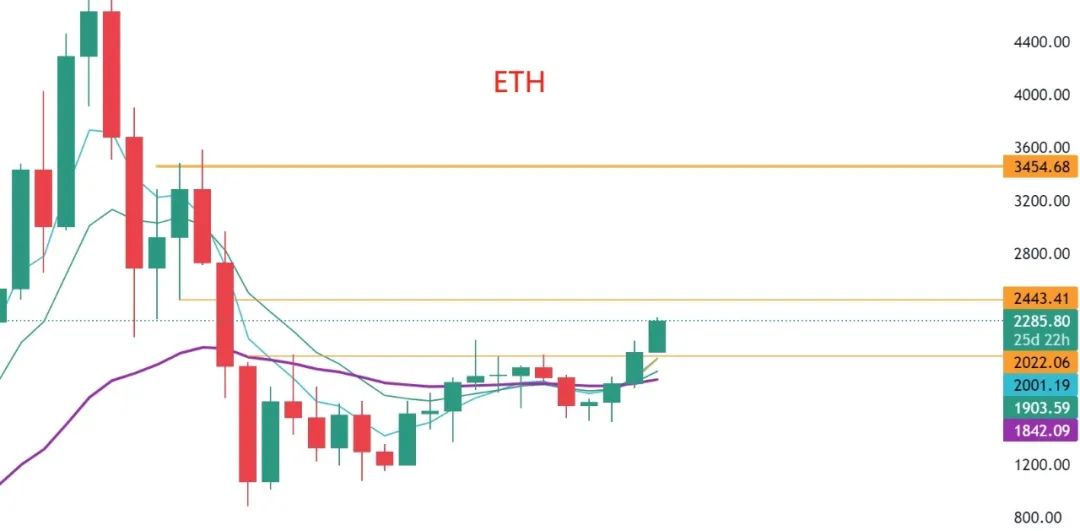
[ETH Trend Analysis]
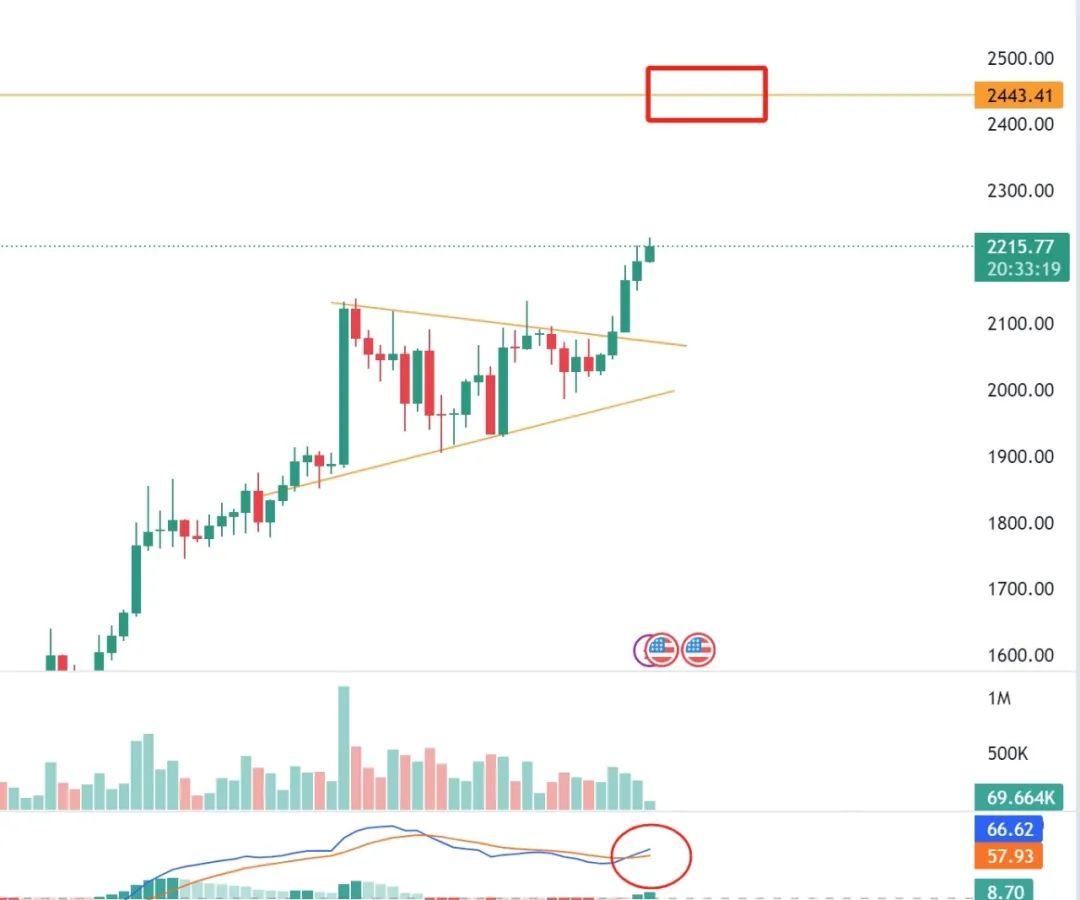
On the daily chart, after multiple retracements to the 30-day moving average, ETH has started to strengthen again, showing an overall converging triangle pattern. ETH has chosen to break through the upper bound and has reached a new high of $2,300 this year, with the next target at $2,450.
The MACD's golden cross near the zero axis is the best logic for continued upward movement. Patience is key in holding ETH.
On the weekly chart, ETH's moving averages have confirmed the formation of a golden triangle pattern, signaling a strong upward trend. Last week, it completed the retracement task at $1,880, and it is highly likely to continue breaking new highs this week.
On the monthly chart, December to January of the following year is highly likely to be a period of ETH leading the market. The moving average system has also presented a bullish alignment, and the MACD indicator has begun to cross above the zero axis after the golden cross. The KDJ is also in a golden cross pattern. These are all strong indications of ETH's price performance on the monthly chart. Those who entered ETH at $1,626 earlier should hold on, as the only risk is not being able to hold on.
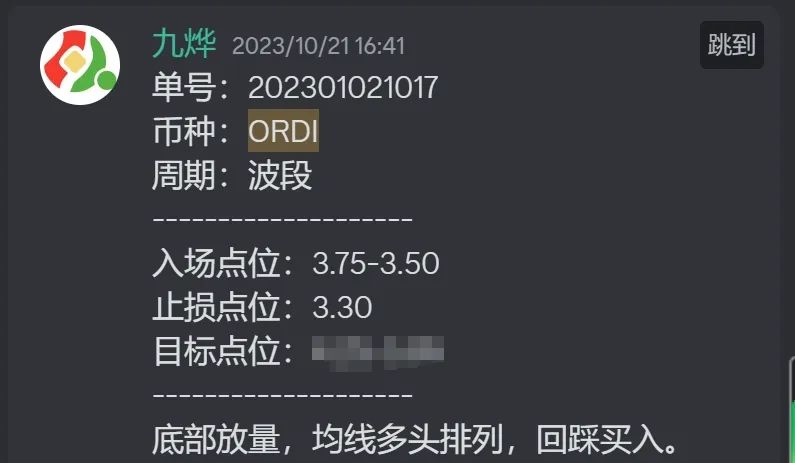
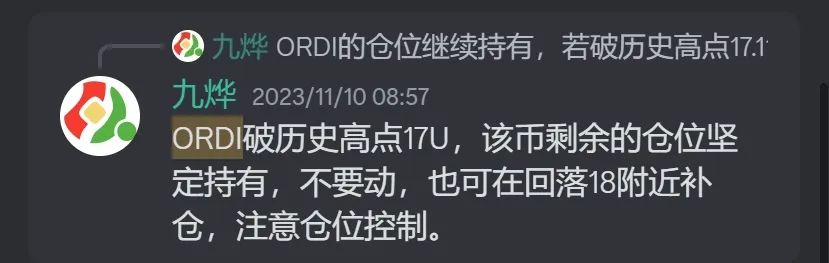
[ORDI Trend Analysis]
ORDI, as a leading token in the Bitcoin ecosystem, has achieved over 10 times the return since entering at $3.75, reaching a return rate of 1654.67%, with a peak of 65.8U. Patience is key in holding this token. With a total supply of 21 million, there is currently no sign of the uptrend stopping. The inscription track is leading Bitcoin into deep waters.
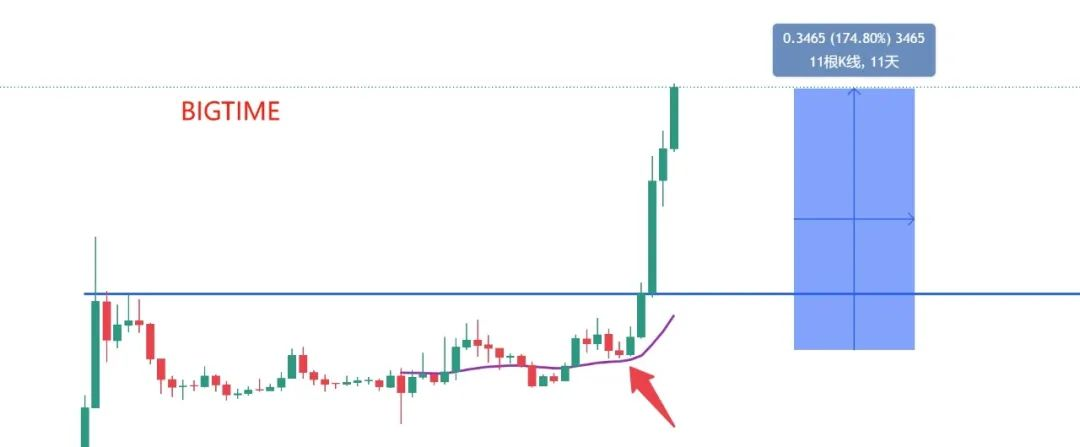
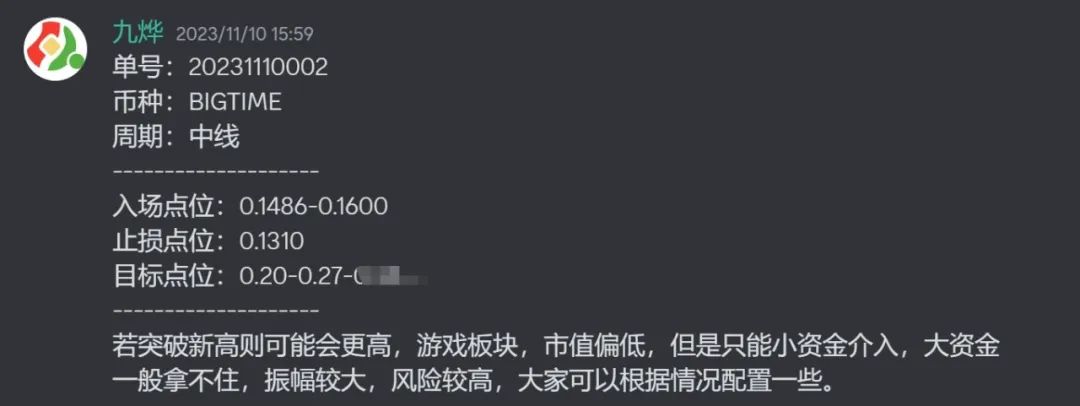
[BIGTIME Trend Analysis]
As a leading token in blockchain games, Bigtime has achieved a 518% increase since entering near 0.17U, reaching a historic high of 0.99U. The profits can still be held onto.
[Jiuge's Quotes]
Candlestick language is a result, and everything we know or don't know, everything that is happening or will happen, will be reflected in candlestick language.
The best reason for an uptrend is the uptrend itself, and the best reason for a downtrend is the downtrend itself.
The trend has arrived, so don't think about a sharp decline or the reasons behind it. Candlestick language tells us everything. With time verification and continuous price increases, the answers will be revealed.
Once a trend forms, it will not easily change. You just need to follow the trend, ignore all external news, focus on candlestick language, and focus on the trading system. Everything else is just noise.
After the trend forms, the only risk is not being able to hold on.
免责声明:本文章仅代表作者个人观点,不代表本平台的立场和观点。本文章仅供信息分享,不构成对任何人的任何投资建议。用户与作者之间的任何争议,与本平台无关。如网页中刊载的文章或图片涉及侵权,请提供相关的权利证明和身份证明发送邮件到support@aicoin.com,本平台相关工作人员将会进行核查。


