Daily Sharing
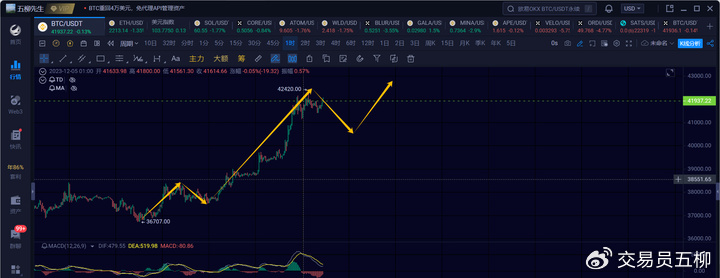
Last night, Bitcoin experienced a 15-minute pullback, retracing near 41100, followed by another 15-minute rebound to a high of 42420. A 1-hour rebound finally showed a divergence, indicating a potential 1-hour pullback. As long as the pullback does not break 40000, there may be another rebound to a new high.
Next, we need to focus on two points. First, the depth of the 1-hour pullback is expected to be shallow, and a shallow pullback is necessary for another rebound to continue to a new high. Second, the strength of the next rebound should be noted, as a weak rebound may indicate a potential higher-level adjustment.
BTC
Due to the rapid market changes, this article can only predict the market changes at the time of publication. Short-term players should pay attention to the latest market changes as a reference only.
1H:
On the 1-hour chart, we are currently looking at a 1-hour pullback, with attention to retracement near 41000 or 40500. As long as this 1-hour pullback is not deep and does not break 40000, there is still a chance for another 1-hour rebound to a new high. After the next 1-hour rebound, it is important to watch for potential divergences.
15M:
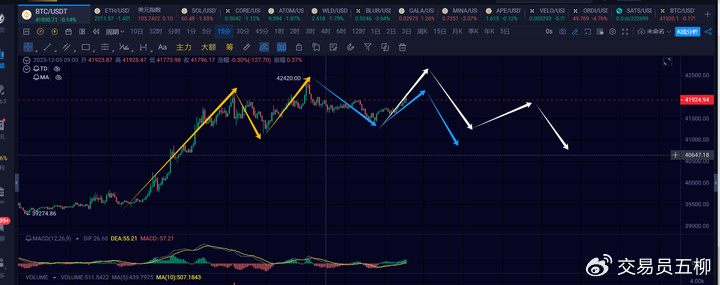
On the 15-minute chart, a downward movement and an upward movement have already occurred. The current upward movement is likely nearing completion, and the focus will be on the strength of the third downward movement. If the strength is significant, it may lead to a 5-wave pattern; if the strength is weak, a 3-wave pattern is expected.
Of course, if a new high is reached, it will only extend the 1-hour rebound, and the focus will still be on the 1-hour pullback.
After a large bullish candle appeared on the daily chart, there is some pressure at the top, so in the short term, there will be more consolidation for a day or two to complete the 1-hour pullback. This means the small unilateral rise will turn into small-scale oscillation, rather than continuing the unilateral upward movement.
ETH
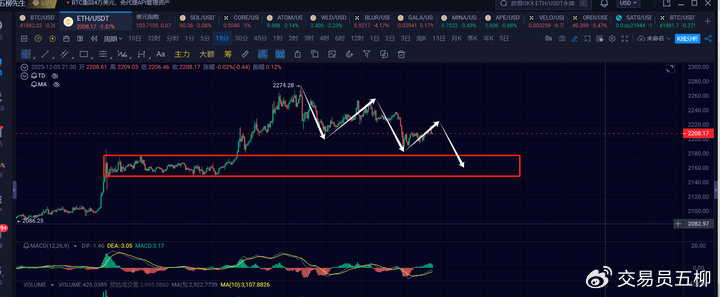
Ethereum is currently in a 1-hour downward movement, and is running the fourth 15-minute rebound. If this rebound does not break 2253, there may be another 15-minute downward movement retracing near 2148-2276. Overall, for Ethereum, as long as it does not break 2130, the rebound is not over yet.
Trend Direction
Weekly Chart: Upward direction, currently an extension of the weekly rebound from 15476, waiting for further daily chart developments to determine when it might end.
Daily Chart: Upward direction, still extending, but some internal structures are still needed for a possible end.
4-hour Chart: Upward direction, a 1-hour downward movement and a 1-hour upward movement may still be needed for the 4-hour rebound.
1-hour Chart: Downward direction, watching for a 1-hour pullback.
15-minute Chart: Downward direction, at least one more 15-minute downward movement is expected.
Feel free to follow my public account for discussions and exchanges:

The article is time-sensitive, so be aware of the risks. The above is only personal advice and is for reference only!
免责声明:本文章仅代表作者个人观点,不代表本平台的立场和观点。本文章仅供信息分享,不构成对任何人的任何投资建议。用户与作者之间的任何争议,与本平台无关。如网页中刊载的文章或图片涉及侵权,请提供相关的权利证明和身份证明发送邮件到support@aicoin.com,本平台相关工作人员将会进行核查。


