【Today's Focus】
1. According to CME's Fed Watch forecast, the probability of the Fed maintaining interest rates in December is 96.1%, and the probability of a 25 basis point rate hike is 3.9%. The probability of the Fed maintaining interest rates in February next year is 96.1%, the cumulative probability of a 25 basis point rate hike is 3.9%, and the cumulative probability of a 50 basis point rate hike is 0%. In addition, the OECD stated that it is expected that the Fed will not cut interest rates before the second half of 2024.
2. Bloomberg ETF analyst James Seyffart stated that Franklin has submitted a prospectus for the update of the spot Bitcoin ETF. The U.S. Securities and Exchange Commission (SEC) has been investigating Franklin for a long time, and the SEC will not make another decision until January 1. It is also stated that the delayed decision on Hashdex is likely to allow each applicant to be approved before the deadline of January 10, 2024.
Jiuge's View: If there is no opportunity to raise interest rates this year, it is very likely that the range of 5.25%-5.50% will be the peak since the interest rate hike in 2022, which will be beneficial for capital inflows into the cryptocurrency market.
【BTC Market Analysis】
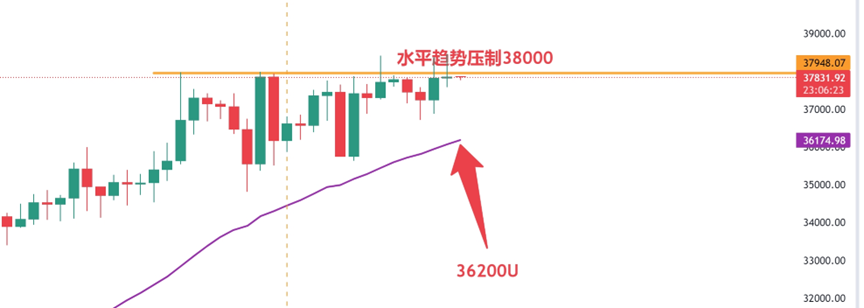
Daily chart: Yesterday, it surged to 38,000 points and quickly fell back, marking the fourth time since November 9, November 15, and November 24 that it surged to 38,000 points. However, this time it was a false breakthrough. The amplitude of BTC is getting smaller, and the turning point is expected to be in the next 1-2 days. If it can hold above 38,000 by the end of the month, the market in early December can be expected. Otherwise, it may continue to retest or oscillate at high levels.
Bitcoin rebounded from the support level at 36,800U two days ago, which coincided with the 120-period moving average on the 4-hour chart. Similar to the previous two times, after rebounding to 38,000 points, if the position is heavy, it can be appropriately reduced to control it within 50%. The support levels below are 36,800-36,200U, and if it falls below 36,200U, the risk will increase.
【BTC Phase Target Adjustment Suggestions】
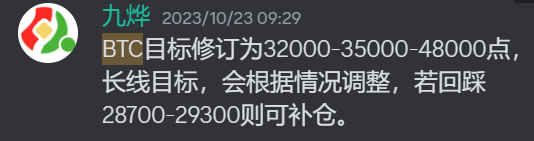
After the start at 27,200, on October 23, we adjusted the targets based on the actual trend of Bitcoin as follows: 32000-35000-48000 points. The 35,000 point level has already been reached, and it has also broken through 36,000 points, reaching a high of 38,000 points. Now it is a pullback after the breakthrough, and the daily chart needs to adjust and repair the indicators. Jiuge believes that the adjustment of the bullish trend is for a better upward movement.
【Trend Analysis: BTC Breakthrough After 4 Years】
Monthly chart: BTC's performance has been outstanding, with a 28% increase last week, which is a good performance in the past decade. So, what is the price outlook for November, will it continue to rise or pull back?
The monthly chart of Bitcoin shows a positive trend, with the 5-month and 10-month moving averages forming a golden cross above the 30-month moving average, indicating a positive trend. Additionally, the MACD forming a golden cross below the zero axis also indicates the start of a bullish trend, and the KDJ has turned upwards again.
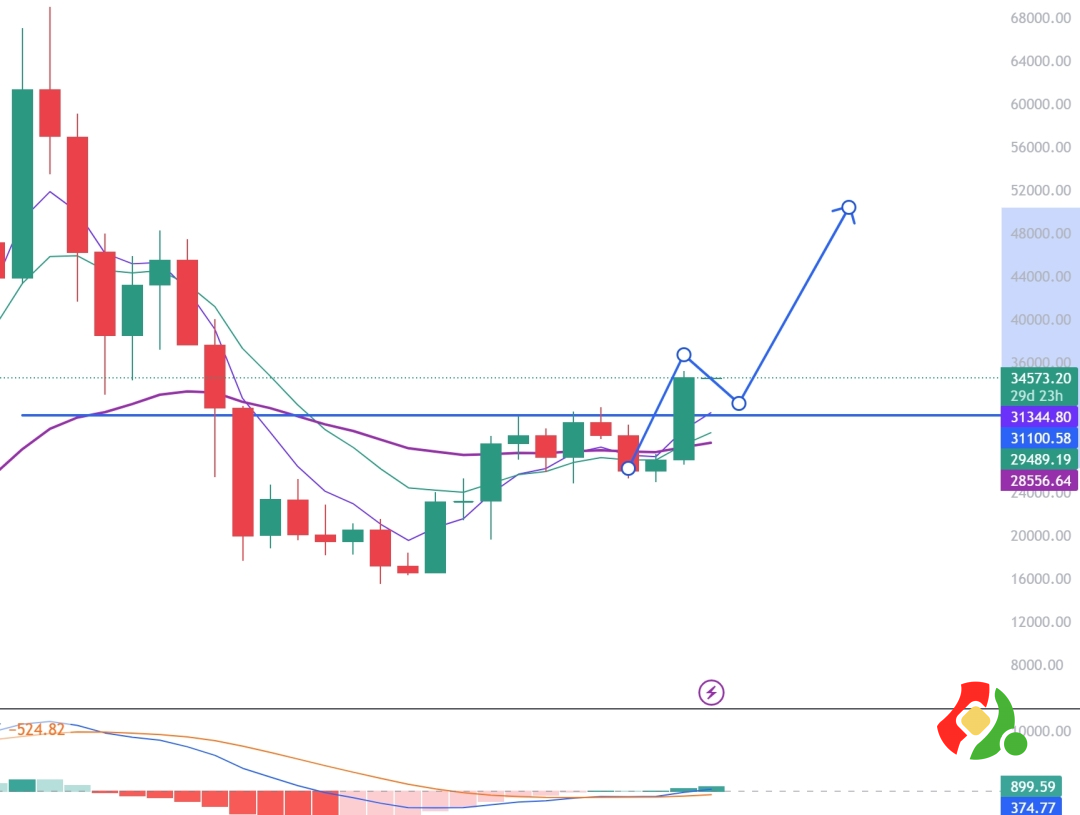
After 4 years, Bitcoin has once again shown a positive trend on the monthly chart, indicating that it is in the early stages of a bull market, and a true one at that.
Although history does not repeat itself, it will certainly rhyme, just with different versions, characters, and stories.
【ETH Market Analysis】
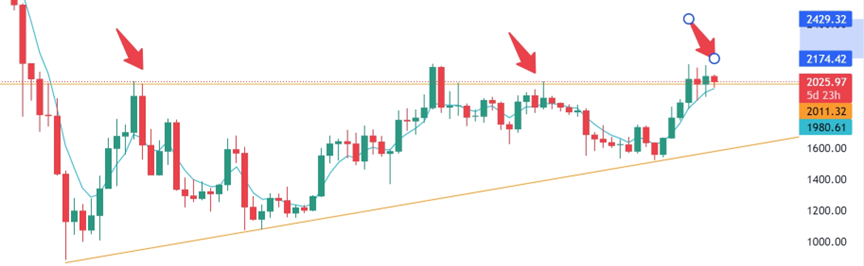
Daily chart: ETH made a second attempt to break the previous high of $2136, but was quickly suppressed. The MACD indicates that the adjustment has not yet ended, and it may face the risk of further decline. If it falls below 2040, the lowest retracement will be to 1980U, which is the support level at the 120-period moving average on the 4-hour chart. Yesterday, it rebounded to 2070U and started to retrace, with attention to the effectiveness of the support at 2000 points.
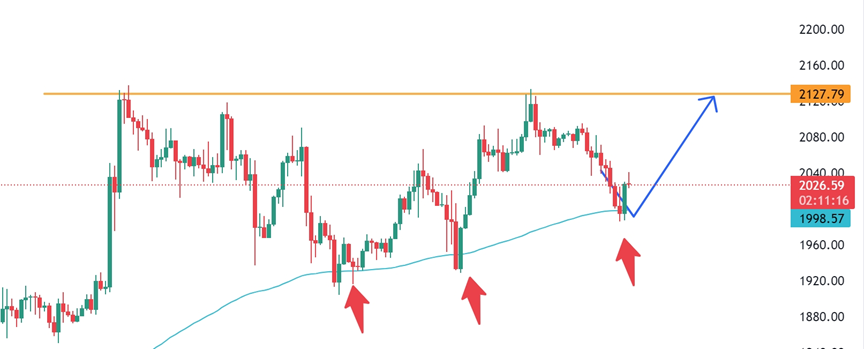
Weekly chart: ETH's closing has confirmed the formation of a bullish pennant, which is a positive signal. The current price of ETH is still supported by the 5-week moving average at 1980U, and it just touched this level yesterday to stop the decline. Further observation is needed to see if there will be another rebound to 2040-2136 on the daily chart. If there is an opportunity for another surge, pay attention to Bitcoin's performance for position adjustments.
【LINK Trading Review and Analysis】
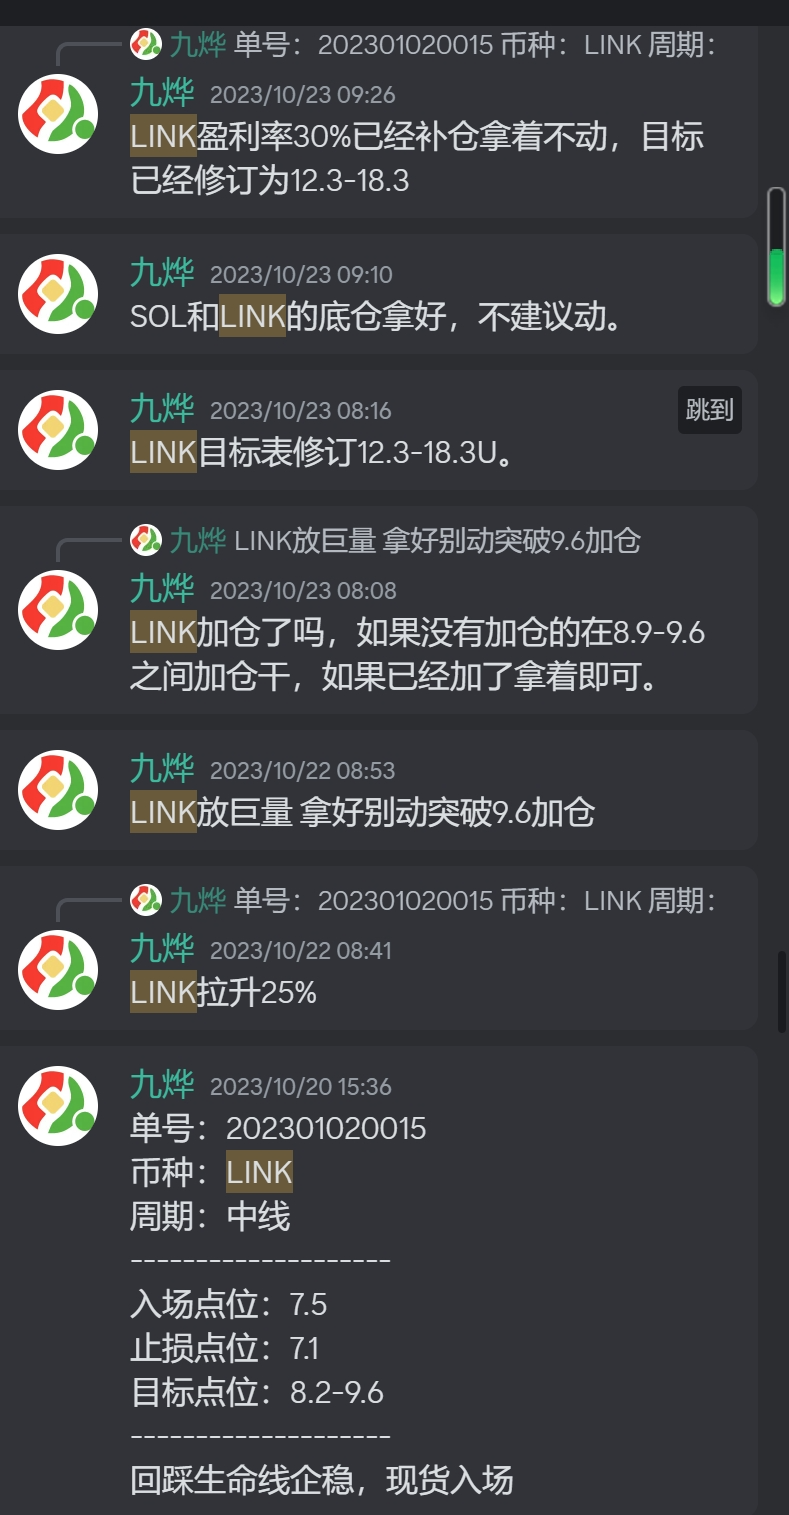
Spot Layout: After breaking out of the oscillating range of over 500 days, LINK experienced a brief adjustment and continued to rise. Based on the trading plan for LINK since October 20, it has been supported by the lifeline and started a new uptrend after breaking through.
At the same time, based on the trend of LINK, we adjusted our trading plan, entering at 7.6U and achieving the first and second targets, and then adding positions and adjusting the target. The current return on investment is close to 100%. The breakthrough is a matter of time; the question is whether you can hold on. You can take out the principal and leave the profit for the crazy period of the bull market.
Attached Image: LINK Trading Plan Tracking Path.
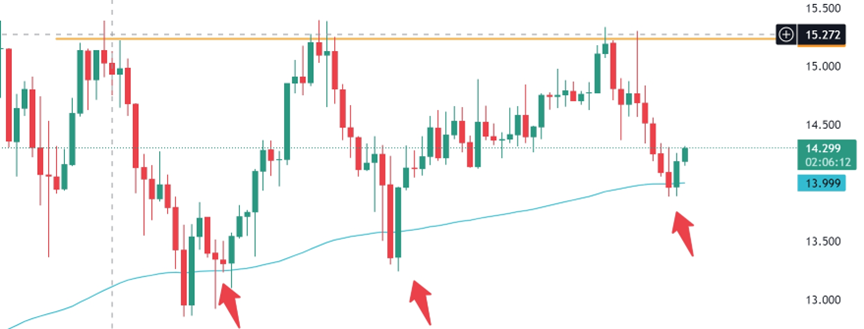
Today's Analysis: On the 4-hour chart, LINK has been supported by the 120-period moving average in the previous two instances and has started to rebound. Overall, it is oscillating within a triangular range, and a turning point signal will appear in the near future. Breaking through 15.0 will open a new market, while falling below 13.8U may face further retracement.
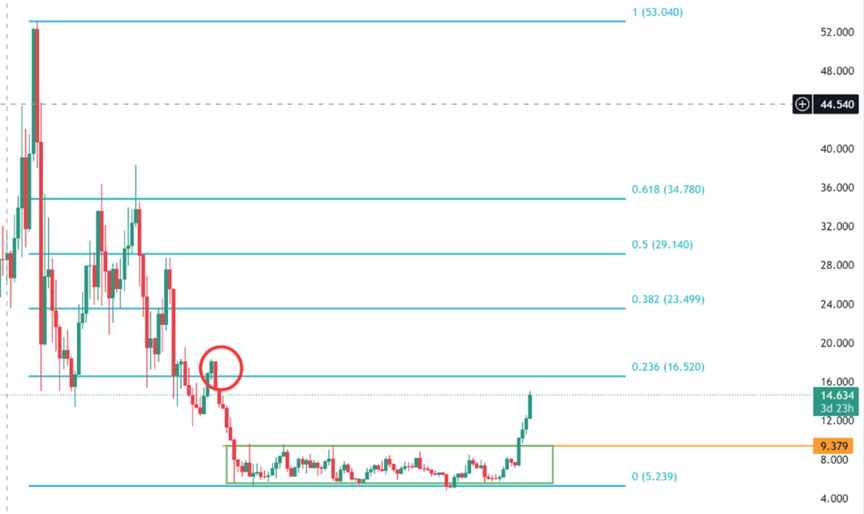
Trend Review: Based on the Fibonacci retracement from the low point of this round and the start of the previous bull market, the highest rebound encountered resistance at 23.6%, which is a normal technical retracement.
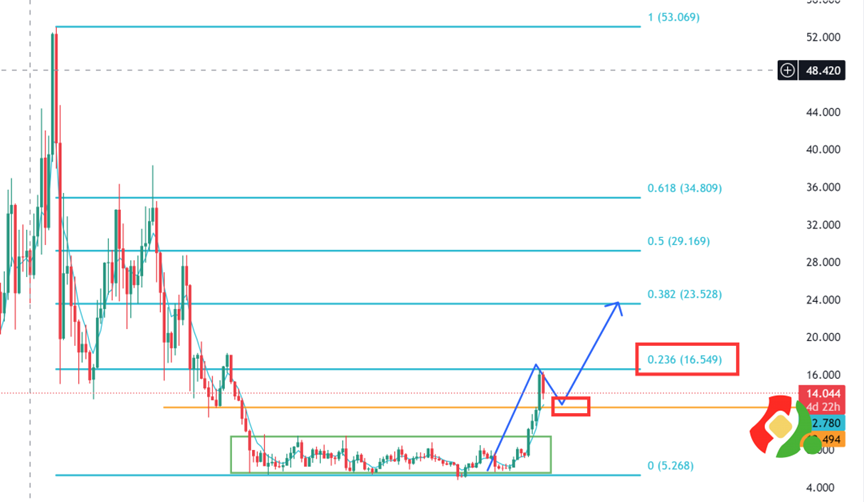
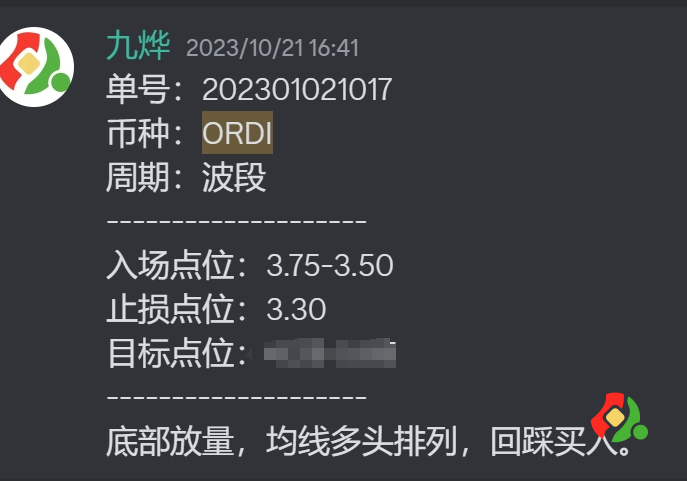
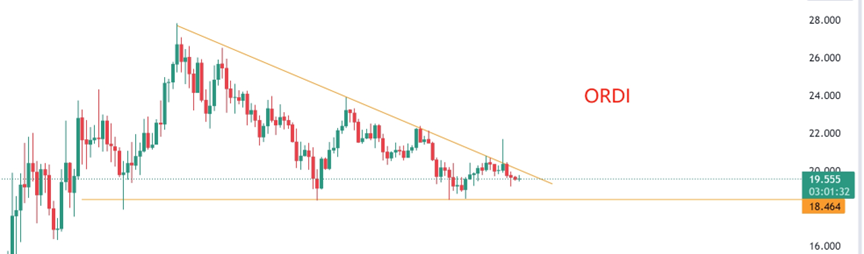
【ORDI Review and Analysis】
Spot Layout: Since October 21, when ORDI broke through the lifeline, the entry area of 3.75-3.50 was clearly indicated.
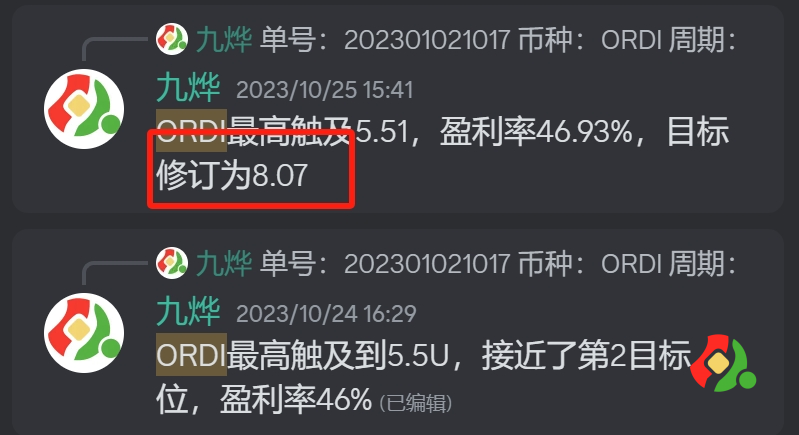
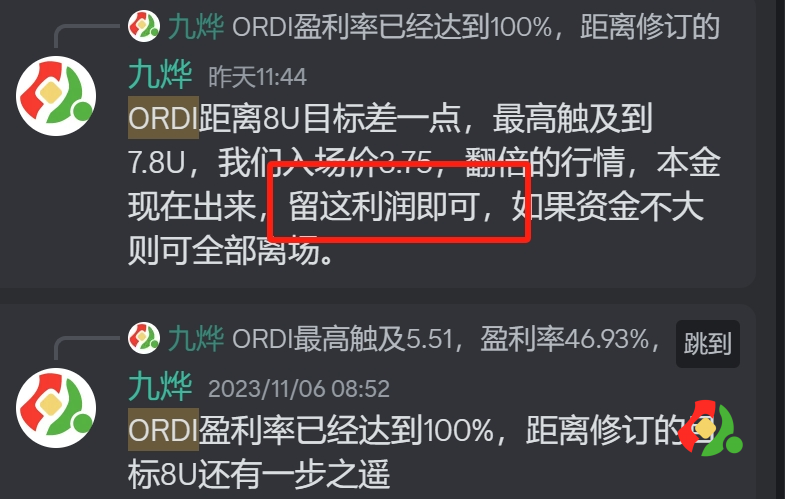
In the following period, ORDI violently surged, broke through the neckline at 4.25U, and adjusted the target to $8.07. This area is where chips are concentrated. At this point, the profit has exceeded 100%, and it is suggested to take out the principal and leave the profit to soar during the crazy period of the bull market.
Today's Analysis: On the 4-hour chart, ORDI's price has once again fallen near the 120-period moving average. Currently, ORDI is oscillating within a descending triangle pattern, with support at the lower rail at 18.45U and resistance at the upper rail at 20.25U.
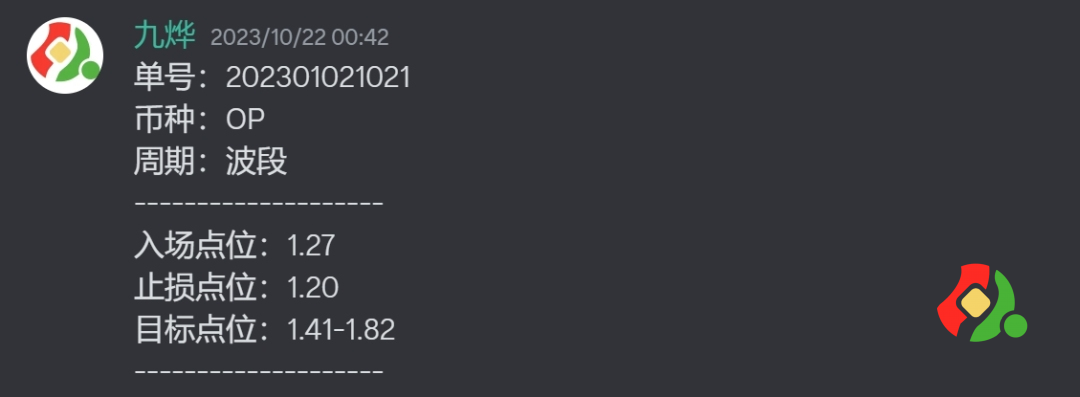
【OP Review and Analysis】
Spot Layout: As the leading coin in L2, apart from ARB, we must pay close attention to OP. In the post 202301021021, Jiuge clearly mentioned the entry point for OP, which is the bottom position. Add positions upon breaking through 1.42U, and it is still possible to add positions upon breaking through 1.83.
However, the price has been oscillating and consolidating around 1.80, which is the neckline on the weekly chart. This behavior is likely to be a shakeout, so we should pay attention to the breakout of OP after the market stabilizes.
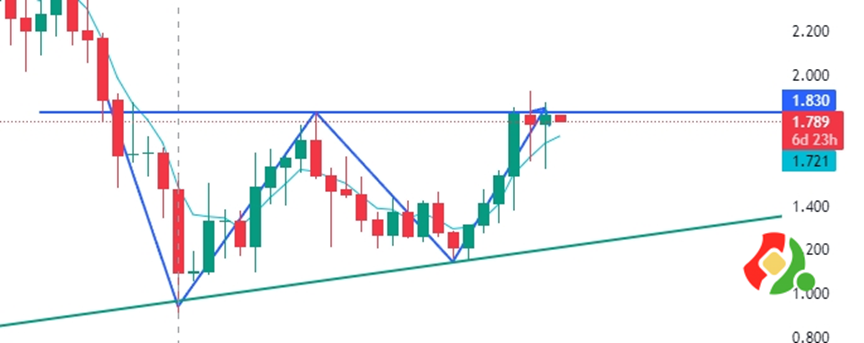
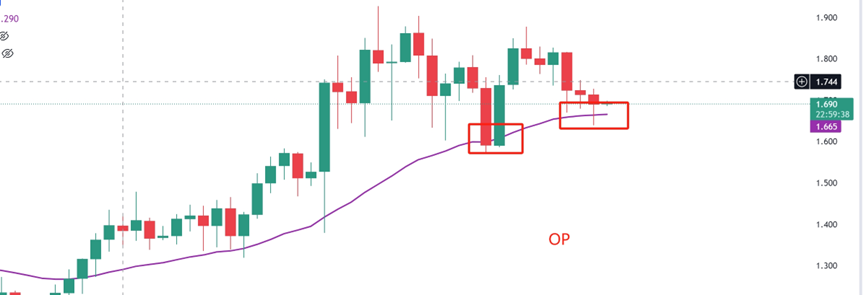
On the weekly chart, the past two weeks have shown long lower shadows but have not held above 1.83U. The daily chart reflects this more clearly, with a long period of consolidation around 1.83. This level also indicates the importance of the neckline on the weekly chart. A breakout will lead to a larger upside, with support at 1.73U.
On the daily chart, the price has been rising along the lifeline. The last time it touched the lifeline near 1.60U, it started to surge. This time, it is also stabilizing near the lifeline, patiently waiting for the MACD indicator to retrace to the 0 axis before the consolidation phase.
【Position Adding Skills】Why choose to gradually add positions upon breakout?
Because we only do the right things.
Instead of adding positions on every retracement to get lower prices?
If we buy a coin and the price does not move in the expected direction but moves in the opposite direction, it means we are wrong. At this point, triggering a stop loss and exiting is the right move, not adding positions to increase the risk.
Only when the price moves in the expected direction, indicating that we are right, can we consider re-entering upon each breakout, until the trend deteriorates and we exit completely.
Let the profits fly for a while, don't be in a hurry to take profits and exit. If the trend emerges, persistence and holding are the best strategies, instead of being anxious every day, fearing that the profits will slip away!
【Jiuge's Quotes】
1. Candlestick language is a result, everything we know or don't know, everything happening or about to happen, will be reflected in the candlestick language.
2. The best reason for an uptrend is the uptrend itself, and the best reason for a downtrend is the downtrend itself.
The trend has arrived, don't think about a sharp decline or the reasons behind it. The candlestick tells us everything. With time verification and continuous price increase, it will provide us with the answers.
3. Once a trend is formed, it will not easily change. You just need to follow the trend, ignore all external news, focus on the candlestick language, focus on the trading system, everything else is a distraction.
免责声明:本文章仅代表作者个人观点,不代表本平台的立场和观点。本文章仅供信息分享,不构成对任何人的任何投资建议。用户与作者之间的任何争议,与本平台无关。如网页中刊载的文章或图片涉及侵权,请提供相关的权利证明和身份证明发送邮件到support@aicoin.com,本平台相关工作人员将会进行核查。


