[This Week's Unlocked Tokens]
(1) At 22:00 on November 27th, YGG will unlock 16.69 million tokens, accounting for 5.84% of the circulation.
(2) At 08:00 on November 28th, AGIX will unlock 9.39 million tokens, accounting for 0.76% of the circulation.
(3) At 23:00 on November 28th, DYDX will unlock 2.16 million tokens, accounting for 1.2% of the circulation.
(4) At 08:00 on November 29th, NYM will unlock 25 million tokens, accounting for 4.1% of the circulation.
(5) At 12:00 on November 30th, OP will unlock 24.16 million tokens, accounting for 2.74% of the circulation.
(6) At 15:00 on December 1st, ACA will unlock 27.43 million tokens, accounting for 3.31% of the circulation.
(7) At 20:00 on December 1st, 1INCH will unlock 98.74 million tokens, accounting for 9.48% of the circulation.
(8) At 11:06 on December 3rd, TORN will unlock 22,840 tokens, accounting for 0.6% of the circulation.
Bull Market Phases, Do You Think ETH Has Entered the Second Phase of the Rebound?
Phase 1: Bitcoin dominates the market, most altcoins cannot outperform Bitcoin.
Phase 2: ETH and blue-chip coins rise (LINK, SOL…).
Phase 3: Altcoins surge.
[BTC Market Analysis]
On the daily chart, after reaching a high of 38,400U, Bitcoin quickly fell back, forming a bearish candlestick pattern, which turned out to be a false breakout. Yesterday, Bitcoin rebounded from near 36,800U, touching the 120-period moving average on the 4-hour chart, similar to the previous two rebounds. If there is an opportunity to rebound to near 38,000, consider reducing positions.
[BTC Phase Target Adjustment Suggestions]
After the start at 27,200, on October 23, we adjusted the targets based on the actual trend of Bitcoin to 32,000-35,000-48,000 points. The 35,000 point has been reached, and the price has also broken through 36,000, reaching a high of 38,000. Now it is a post-breakthrough correction, and the daily chart needs to adjust and repair indicators. I believe the adjustment of the bullish trend is for a better upward movement.
[Trend Analysis: BTC Breakthrough After 4 Years]
On the monthly chart, BTC's performance has been excellent, with a 28% increase last week, which is a good performance in the past decade. So, in November, will the price continue to rise or will there be a pullback?
The monthly chart shows a positive trend, with the 5-month and 10-month moving averages forming a golden cross above the 30-month moving average, indicating an accelerating upward trend. Additionally, the MACD forming a bullish cross below the zero axis indicates the start of a bullish trend, and the KDJ is turning upwards again.
Bitcoin's price chart over the past decade shows that after Bitcoin's price crossed the 30-month moving average in November 2015, it never fell below it again, rising along the 5-month moving average to a peak of 20,000 points in 2017. This was a 50-fold increase from 400 points to 20,000 points.
After Bitcoin crossed the 30-month moving average in April 2019, the price rose from 4,000 points to 69,000 points over 2 years, an 11-fold increase.
After 4 years, Bitcoin has once again crossed the 30-month moving average, indicating the early stage of a bull market.
Although history does not repeat itself, it does rhyme, with different versions, characters, and stories.
[ETH Market Analysis]
On the daily chart, ETH made a second attempt to break the previous high of $2,136, but was quickly suppressed. The MACD indicates that the adjustment has not ended, and there may be a continued risk of decline. After falling below $2,040, it rebounded to around $1,980, finding support at the 120-period moving average on the 4-hour chart. If it stabilizes at this level, it may retest the resistance levels at $2,040 and $2,136, with support at $1,930.
On the weekly chart, ETH has confirmed the formation of a bullish pennant, which is a positive signal. The price is still supported by the 5-week moving average at $1,980, and further observation is needed to see if there will be a rebound to $2,040-2,136 on the daily chart. Pay attention to Bitcoin's performance for position adjustments.
[LINK Trading Review and Analysis]
Spot Layout: After breaking out of the 500-day consolidation range, LINK experienced a brief correction before continuing its upward trend. Since October 20, LINK has been supported by the 120-period moving average and started a new uptrend after breaking the lifeline.
According to the LINK trend, our trading plan has been adjusted. With an entry at 7.6U, the first and second targets were achieved, and positions were adjusted. The current profit rate is close to 100%. The breakthrough is only a matter of time; the question is whether you can hold on. You can withdraw the principal and leave the profit for the crazy period of the bull market.
Today's Analysis: On the 4-hour chart, LINK has been supported by the 120-period moving average twice before, and yesterday's rebound formed a bullish engulfing pattern. The only drawback is the lack of volume. It is highly likely to retest the resistance level at 15.2U.
Trend Review: From the recent low point and the Fibonacci retracement of the previous bull market start, the highest rebound encountered resistance at 23.6%, which is a normal technical pullback.
[ORDI Trading Review and Analysis]
Spot Layout: Since breaking the lifeline on October 21, ORDI has surged, breaking the neckline at 4.25U and targeting 8.07U, which is a concentration of chips. Profit has exceeded 100%, and it is suggested to withdraw the principal and leave the profit.
Today's Analysis: On the 4-hour chart, ORDI's price has fallen back to near the 120-period moving average. This time, it has fallen below, and the pressure level is at 20.5, which is also the resistance of the downtrend line, with support at 18.5.
[OP Price Analysis]
Spot order number 202301021021, Jiuge clearly mentioned the entry point for OP, which is the bottom position. Add to the position if it breaks 1.42, and it can still be added if it breaks 1.83.
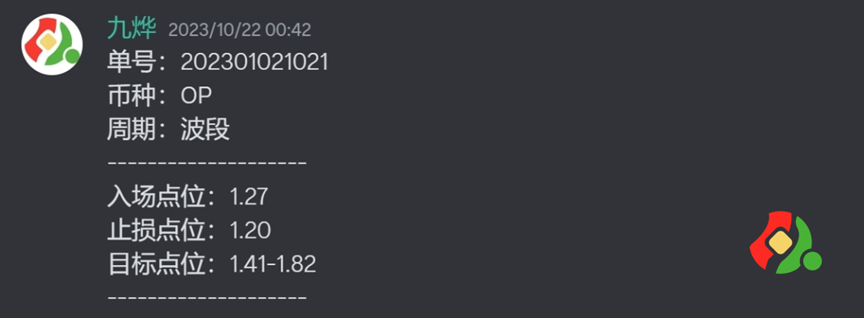
However, the price has been oscillating and consolidating around 1.80, which means it has been oscillating repeatedly at the neckline on the weekly chart, which is highly likely to be a washout behavior. Pay attention to the breakout situation of OP after the stability of the overall market.
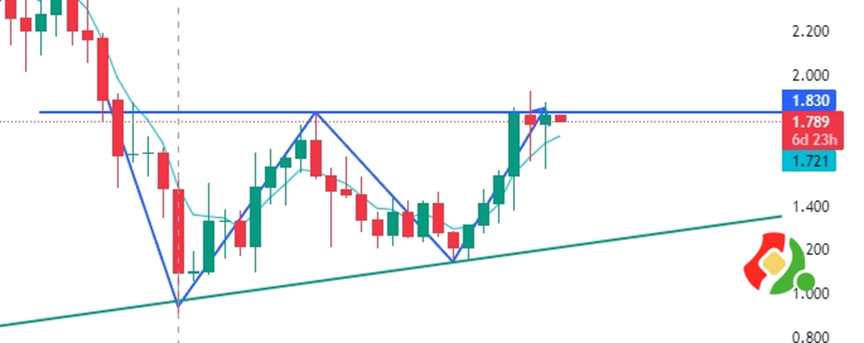
On the weekly chart, both of the past two weeks have long lower shadows but have not stabilized at 1.83. The reaction on the daily chart is even more obvious, with a long consolidation period around 1.83. At the same time, this level also signifies the importance of the neckline on the weekly chart. A breakout will lead to a larger upside space, with support at 1.73.
[Position Adding Technique - Why Choose to Gradually Add to Breakouts?]
Because we only do the right things.
Instead of adding to the position every time it retraces to get a lower price?
If we buy a coin and the price not only does not move in the direction we expected, but instead moves in the opposite direction, it means we are wrong. At this point, triggering a stop loss and exiting is the right move, not adding to the position to increase the risk.
Only when the price moves in the direction we expected, indicating that we are right, can we consider re-entering with each breakout, until the trend deteriorates and we exit completely.
Let the profit fly for a while, don't be in a hurry to take profit and exit. If the trend emerges, persistence and holding are the best strategies, not being anxious every day, fearing that the profit will slip away!
[Jiuge Quotes]
1. Candlestick language is a result, everything we know or don't know, everything happening or about to happen, will be reflected in the candlestick language.
2. The best reason for an uptrend is the uptrend, and the best reason for a downtrend is the downtrend.
The trend has arrived, don't think about a crash or what the reasons are behind it. The candlestick tells us everything. With time verification and continuous price increase, it will tell us the answer.
3. Once a trend is formed, it will not easily change. You just need to follow the trend, ignore all external news, focus on the candlestick language, focus on the trading system, everything else is a distraction.
免责声明:本文章仅代表作者个人观点,不代表本平台的立场和观点。本文章仅供信息分享,不构成对任何人的任何投资建议。用户与作者之间的任何争议,与本平台无关。如网页中刊载的文章或图片涉及侵权,请提供相关的权利证明和身份证明发送邮件到support@aicoin.com,本平台相关工作人员将会进行核查。


