Yesterday, around 7 o'clock in the morning, the Binance incident continued to impact the market, causing continuous downward exploration. Bitcoin fell below 36,000, and Ethereum fell below 1,950. At the most panicked moment in the market, this account firmly called for bottom fishing and long positions. I myself bought Bitcoin at 35,800, Ethereum at 1,940, and OP at 1.61, all of which have now recovered the previously reduced positions at high levels.
Now Bitcoin has broken through 37,000 and reached as high as 37,861, just a step away from a new high. Ethereum has broken through 2,050 and reached 2,092, while OP has surged by over 12%. Community members who followed the rhythm once again made a big profit. All of this once again verifies the buying and selling point theorem of the Chan theory: the buying point always appears in the panic decline! Only by overcoming the two major human weaknesses of fear and greed can one operate against human nature and stand invincible in the market!
In previous articles, this account has repeatedly pointed out that the general direction is still upward, and the upward trend on the daily chart has not yet been completed. Especially in the last sentence of yesterday's article: "The pullback is a buying opportunity!" From the volume of the uptrend, this V-shaped rebound belongs to a volume increase. The chips that bottomed can continue to be held, while those who have not yet entered can only wait, as there will be more buying opportunities to enter the market.
After boasting, let's get back to today's main topic, Ethereum. In the previous analysis article of this account on November 14, which was ten days ago, it was explicitly stated that Ethereum needed to patiently wait for the strongest trend of the second and third buys on the 4-hour level, and the actual trend has now been established!
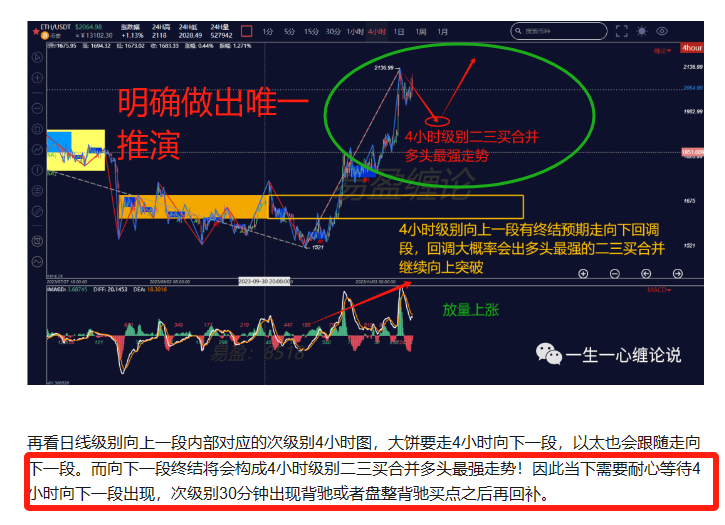
The above image is a screenshot of the article on the 14th.
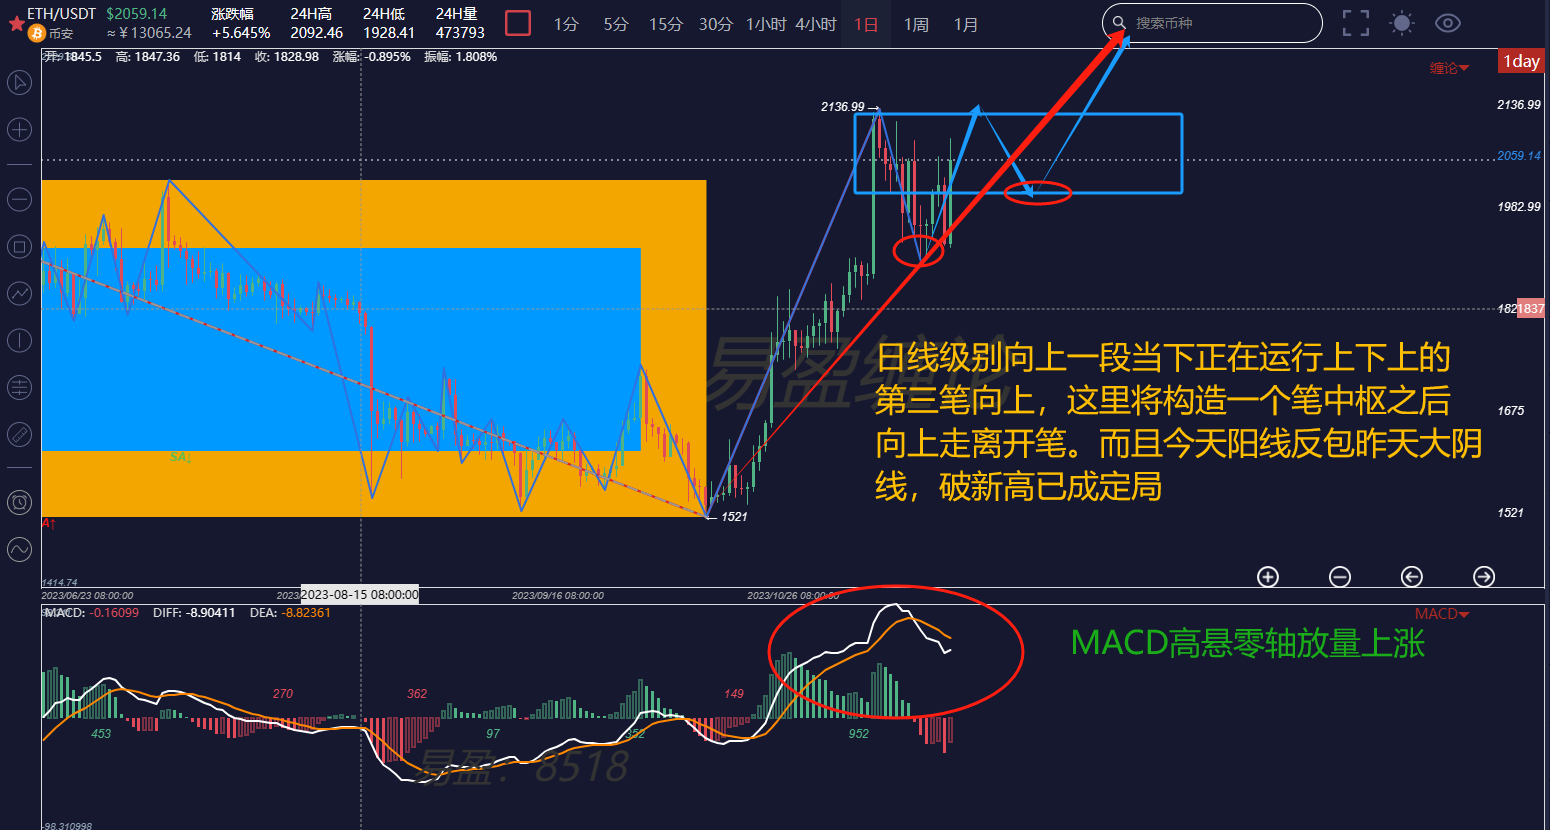
First, let's look at the large-scale daily chart. The third upward wave is currently in progress. A definitive conclusion can be drawn at present: the uptrend will not end until the pen center appears! Today's large bullish candle has engulfed yesterday's large bearish candle, and the MACD is still hanging high above the zero axis. It is a sure thing that it will break through the high point of 2,143 in the future. You can enter the market at the sub-level or sub-sub-level buying points.
Next, let's look at the 4-hour chart. The 4-hour chart is consistent with the projection on the 14th! At present, with the absence of a further decline below the low point of 1,904 after yesterday's morning pullback, the second buy of the strongest second and third buys has been confirmed. The MACD has also returned above the zero axis, and it is highly probable to break through the high point of 2,136. A new 4-hour level center will be constructed here, and the uptrend will not end until the center appears!
Finally, let's look at the 30-minute chart. The 30-minute level has already run to the eighth upward segment of the center. After this segment ends, a downward pullback will form the ninth segment of the center, upgrading to a surge, breaking through the new high. The price has now reached above the center, and it is not recommended to chase after it. Wait for a downward pullback before entering the market.
If you are interested in the Chan theory and want to obtain learning materials for free, watch public live broadcasts, participate in offline Chan theory training camps, improve your trading skills, and build your own trading system to achieve a stable profit goal, use Chan theory techniques to timely escape the peak and bottom fish, you can scan the code to follow the public account and chat privately to obtain and add the WeChat of this account to join the group for learning!

免责声明:本文章仅代表作者个人观点,不代表本平台的立场和观点。本文章仅供信息分享,不构成对任何人的任何投资建议。用户与作者之间的任何争议,与本平台无关。如网页中刊载的文章或图片涉及侵权,请提供相关的权利证明和身份证明发送邮件到support@aicoin.com,本平台相关工作人员将会进行核查。


