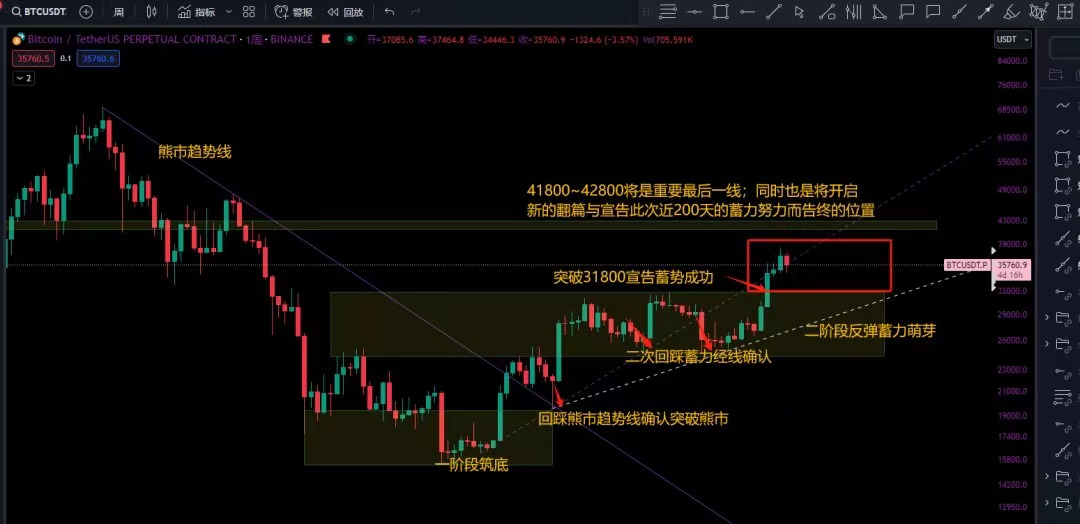
Bitcoin Ancient Weekly Chart
Today's Analysis of the News
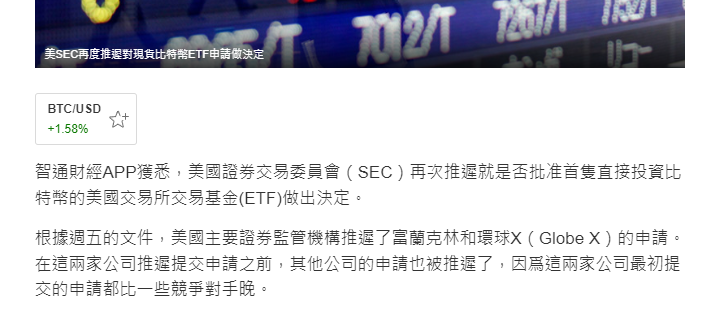
The overall direction of Bitcoin remains unchanged; although the SEC has postponed the decision on the ETF, the ETF resolution may be announced no later than the first quarter of 2024; the current market still maintains consolidation around $37,000; the big picture of Bitcoin is as shown in the above chart; breaking through $38,000 is a matter of time, and there is currently a risk of a short-term pullback to gather momentum; as shown in the chart below👇
Bitcoin Daily Chart
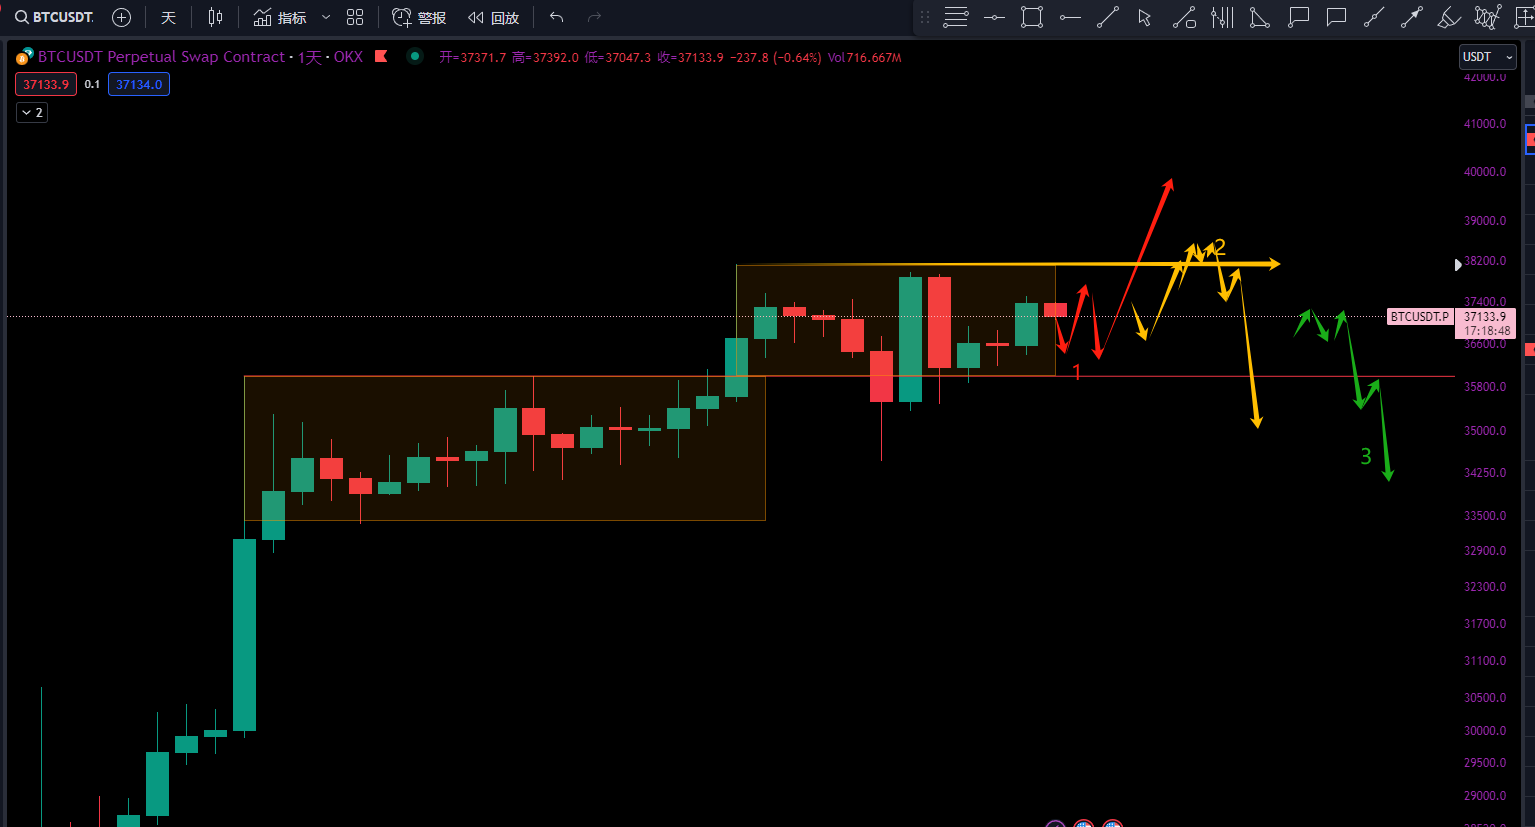
There are three trends on the Bitcoin daily chart; from a technical analysis perspective,
Currently gathering momentum around $37,000, the daily chart MACD shows a bearish divergence, preventing a divergence market,
Short-selling plan 1; as shown in the yellow route, if the market reaches near the previous high of $38,500 and then falls back to test without breaking through, it should enter a small short position with low leverage to prevent a divergence market;
Long position plan; if there is a pullback near $36,500 during the day, and signs of stabilization appear, enter a long position after a 2B bullish engulfing pattern; the position for adding to the long position is to wait for a breakthrough at $38,500 in the yellow route and then add to the position if it does not fall back;
If the market follows the green route and gradually falls below the key level of $36,000; it indicates that the market has returned to the range of $32,000 to $36,000 for consolidation;
In summary; the current market is consolidating around $37,000, and Bitcoin will likely choose a direction within this week; and a large candlestick is about to appear on the daily chart; it is hoped that Bitcoin will break through $38,000 and open up upward space not too far away;
If it really returns to the range of $32,000 to $36,000 for consolidation, the overall big picture has not changed, it is still an upward market, and as the saying goes, a breakthrough is a matter of time; do not be anxious, if it really falls back, the spot ammunition should be used up; wait patiently for profits; contract players should pay attention to the formation combinations at the above positions, appropriately reduce leverage, and participate with a stable stop-loss;
Please refer to the long-term chart in Figure 1, the overall big picture has already advanced to the third stage, and it is just a matter of time to see if the bottom is reached, but in terms of the current price, it is not the end point of this round of the market;
Create a high-quality community
Spot trading is the main focus
I will share some content: as shown in the following conditions:

That's all for the article, for more market analysis, remember to follow
Click on the light-colored text above to view today's latest market layout. The market changes in an instant, for more market information, please follow me
免责声明:本文章仅代表作者个人观点,不代表本平台的立场和观点。本文章仅供信息分享,不构成对任何人的任何投资建议。用户与作者之间的任何争议,与本平台无关。如网页中刊载的文章或图片涉及侵权,请提供相关的权利证明和身份证明发送邮件到support@aicoin.com,本平台相关工作人员将会进行核查。


