BTC
1-hour price trend of BTC: Down.

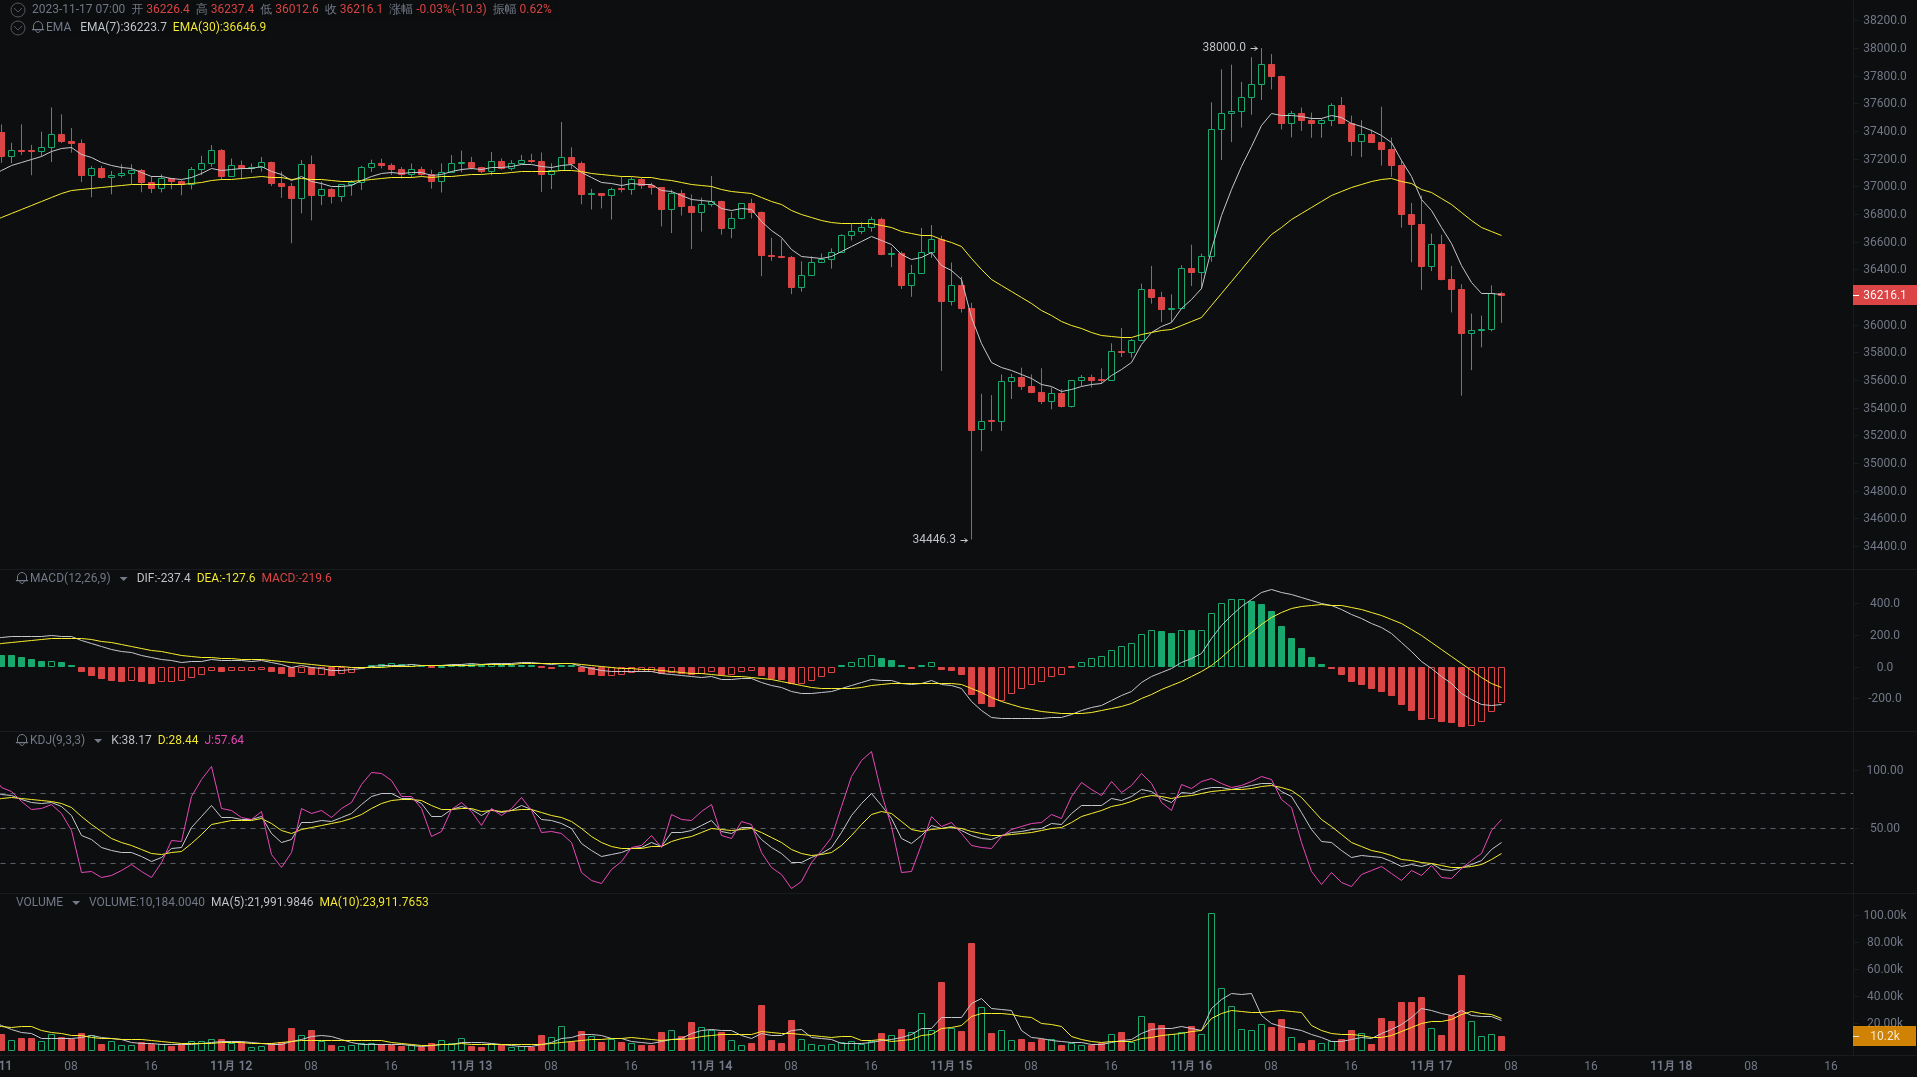
This is a 1-hour Binance BTC/USDT candlestick chart, with the latest price at 36216.1 USDT, including EMA, MACD, KDJ, and volume indicators.
Buy/Sell Points
- Buy Point 1: 35388 USDT (recent low, potential support level)
- Buy Point 2: 35000 USDT (setting a lower psychological level as further support)
- Sell Point 1: 36216.1 USDT (near current closing price, short-term resistance level)
- Sell Point 2: 38000 USDT (recent high, strong resistance level)
Price Trend Analysis
- Candlestick Pattern:
- The latest candlestick shows a small bearish line, with the opening and closing prices close, indicating a relatively balanced strength between bulls and bears.
- There have been significant price fluctuations in the past few hours, such as the high of 38000 and low of 35388 at 07:00 on November 16, but no specific reversal or sustained pattern has formed.
- Technical Indicators:
- MACD Indicator: The latest MACD value is -219.6, with DIF below DEA and the gap between them widening, indicating a possible strengthening of the bearish trend in the short term.
- KDJ Indicator: The J value of 57.64 is slightly higher than the K value of 38.17 and the D value of 28.44, suggesting a possible overbought situation in the market, requiring caution against pullback risk.
- EMA Indicator: The 7-period EMA (36223.7) is below the 30-period EMA (36646.9), with the short-term moving average crossing below the long-term moving average, presenting a bearish signal.
- Volume:
- The volume peaked at 55641.5070 at 03:00 on November 17 and gradually decreased, indicating that the previous price decline was accompanied by increased volume, and the current decrease in volume may indicate a weakening downward momentum.
- However, overall volume has not shown a significant increase, indicating limited market participation, requiring further observation of volume changes to confirm the trend.
ETH
1-hour price trend of ETH: Down.

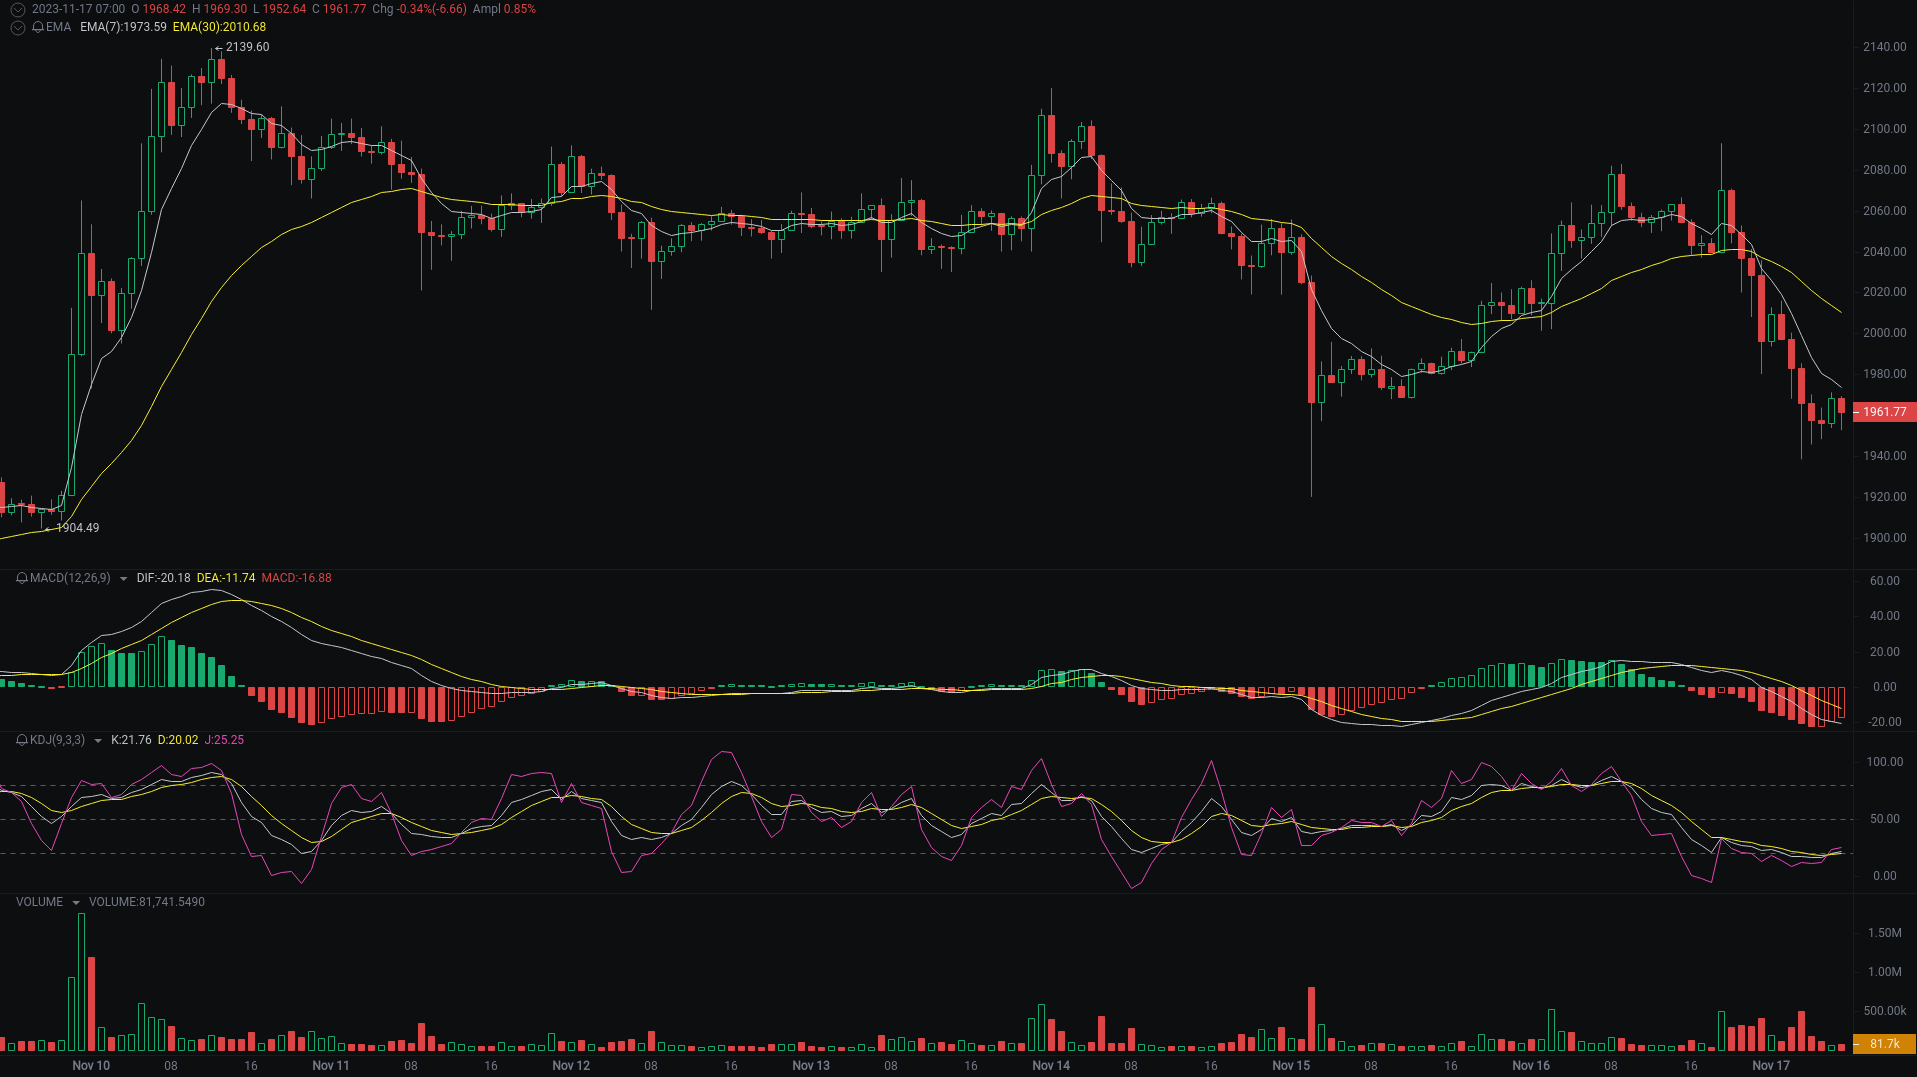
This is a 1-hour Binance ETH/USDT candlestick chart, with the latest price at 1961.77 USDT, including EMA, MACD, KDJ, and volume indicators.
Buy/Sell Points
- Buy Point 1: 1950 USDT (near recent low, potential support level)
- Buy Point 2: 1938 USDT (lowest price in the latest candlestick data, consider adding positions if further decline occurs)
- Sell Point 1: 1973 USDT (near 7-period EMA, short-term resistance level)
- Sell Point 2: 2010 USDT (near 30-period EMA, stronger resistance level)
Price Trend Analysis
- Candlestick Pattern:
- Recent candlesticks show significant price fluctuations, with a long upper shadow candlestick at 19:00 on November 16, indicating selling pressure at high levels.
- From 03:00 to 07:00 on November 17, there are several small bearish candlesticks, with closing prices lower than opening prices, reflecting slightly stronger selling pressure in the short term.
- Technical Indicators:
- MACD Indicator: Both DIF and DEA are negative, and the MACD histogram also shows a negative value, indicating a bearish bias in the current trend. However, the MACD value of the latest candlestick (-16.88) has increased compared to the previous one (-19.02), suggesting potential reversal possibilities.
- KDJ Indicator: The K value (21.76) is lower than the D value (20.02), and the J value (25.25) is slightly higher, which usually indicates market uncertainty and potential volatility in the near term.
- EMA Indicator shows that the 7-period EMA (1973.59) is below the 30-period EMA (2010.68), further confirming the current downtrend.
- Volume:
- The volume peaked at 03:00 on November 17 and gradually decreased, consistent with the price decline, indicating that the downtrend is supported by volume.
- The recent hours' volume has been relatively stable, with no significant increase or decrease, suggesting market participants are in a wait-and-see mode.
ORDI
1-hour price trend of ORDI: Down.

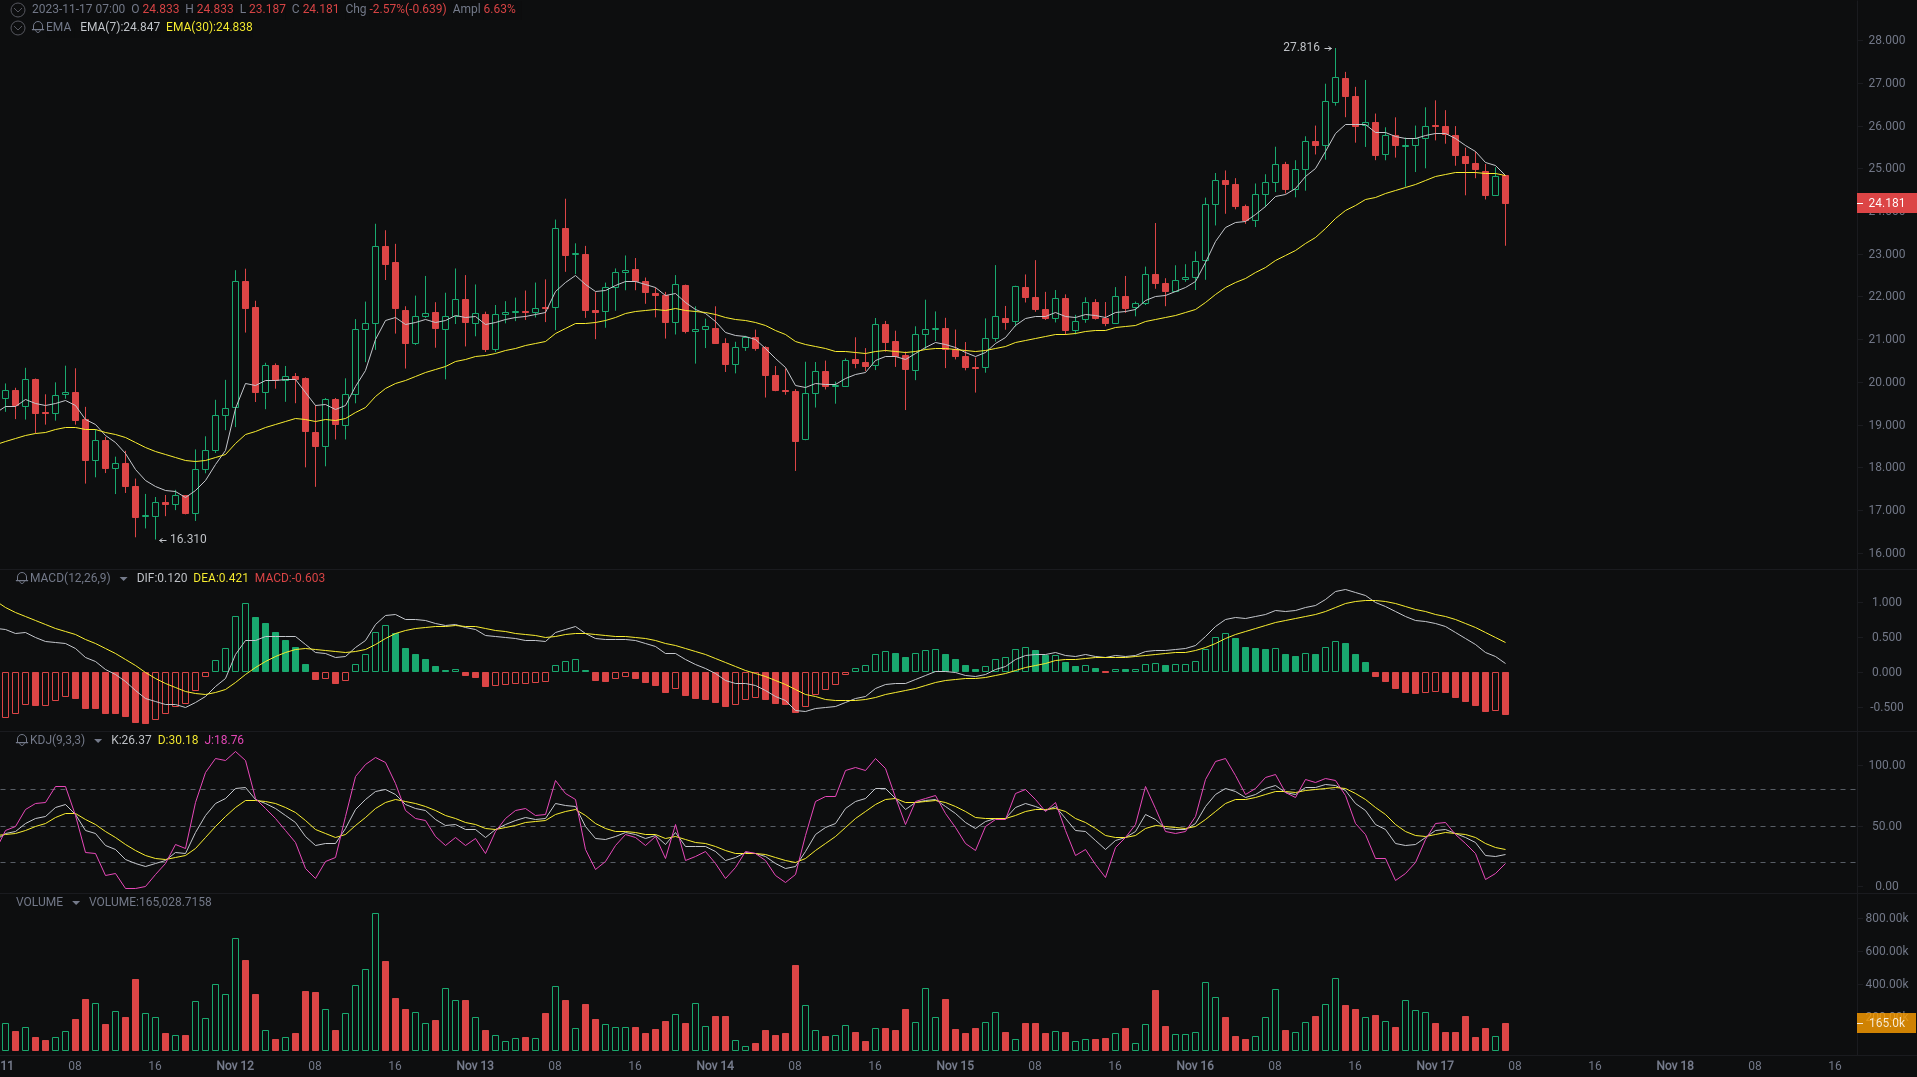
This is a 1-hour OKX ORDI/USDT candlestick chart, with the latest price at 24.181 USDT, including EMA, MACD, KDJ, and volume indicators.
Buy/Sell Points
- Buy Point 1: 24.000 USDT (near recent support level, potential rebound if the price retraces here)
- Buy Point 2: 23.500 USDT (further support level, consider adding positions if it falls below the first buy point)
- Sell Point 1: 25.300 USDT (recently tested resistance level, suitable as an initial selling target)
- Sell Point 2: 26.000 USDT (near previous high, likely to encounter selling pressure, can be seen as a more aggressive profit target)
Price Trend Analysis
- Candlestick Pattern:
- Recent candlesticks show significant price fluctuations, with a clear uptrend from November 15 to 16, reaching a high of 27.816 at 14:00 on November 16, followed by a slight price decline.
- From 01:00 to 07:00 on November 17, the candlestick bodies gradually shortened, with closing prices lower than opening prices, indicating increased selling pressure.
- Technical Indicators:
- MACD Indicator: Both DIF and DEA are declining, and the MACD histogram is transitioning from positive to negative, indicating a possible further weakening of the market in the short term.
- KDJ Indicator: The J value is falling from a high level, and both the K and D lines are trending downward, suggesting weakened momentum and potential pullback pressure.
- EMA Indicator: The recent price has touched and slightly fallen below the 7-period EMA multiple times, but it is still above the 30-period EMA, indicating that the medium- to long-term trend has not changed, but is under pressure in the short term.
- Volume:
- During the price increase phase (November 15 to 16), the volume was relatively high, especially when the price reached its peak, indicating active participation from buyers.
- As the price fell, the volume decreased, indicating reduced market participation, and the current price range may lack sufficient buyer support.
免责声明:本文章仅代表作者个人观点,不代表本平台的立场和观点。本文章仅供信息分享,不构成对任何人的任何投资建议。用户与作者之间的任何争议,与本平台无关。如网页中刊载的文章或图片涉及侵权,请提供相关的权利证明和身份证明发送邮件到support@aicoin.com,本平台相关工作人员将会进行核查。

