Many novice partners say they don't understand the changes in the framework of the small-level market.
I have always said that when trading, you can't just stare at your phone and look at the 15-minute candlestick chart, because you won't see anything at all.
If I draw this picture for you to see, then you might regret why you chased long positions in front of resistance during the day?
Figure 1: Resistance level and high and low point schematic diagram.
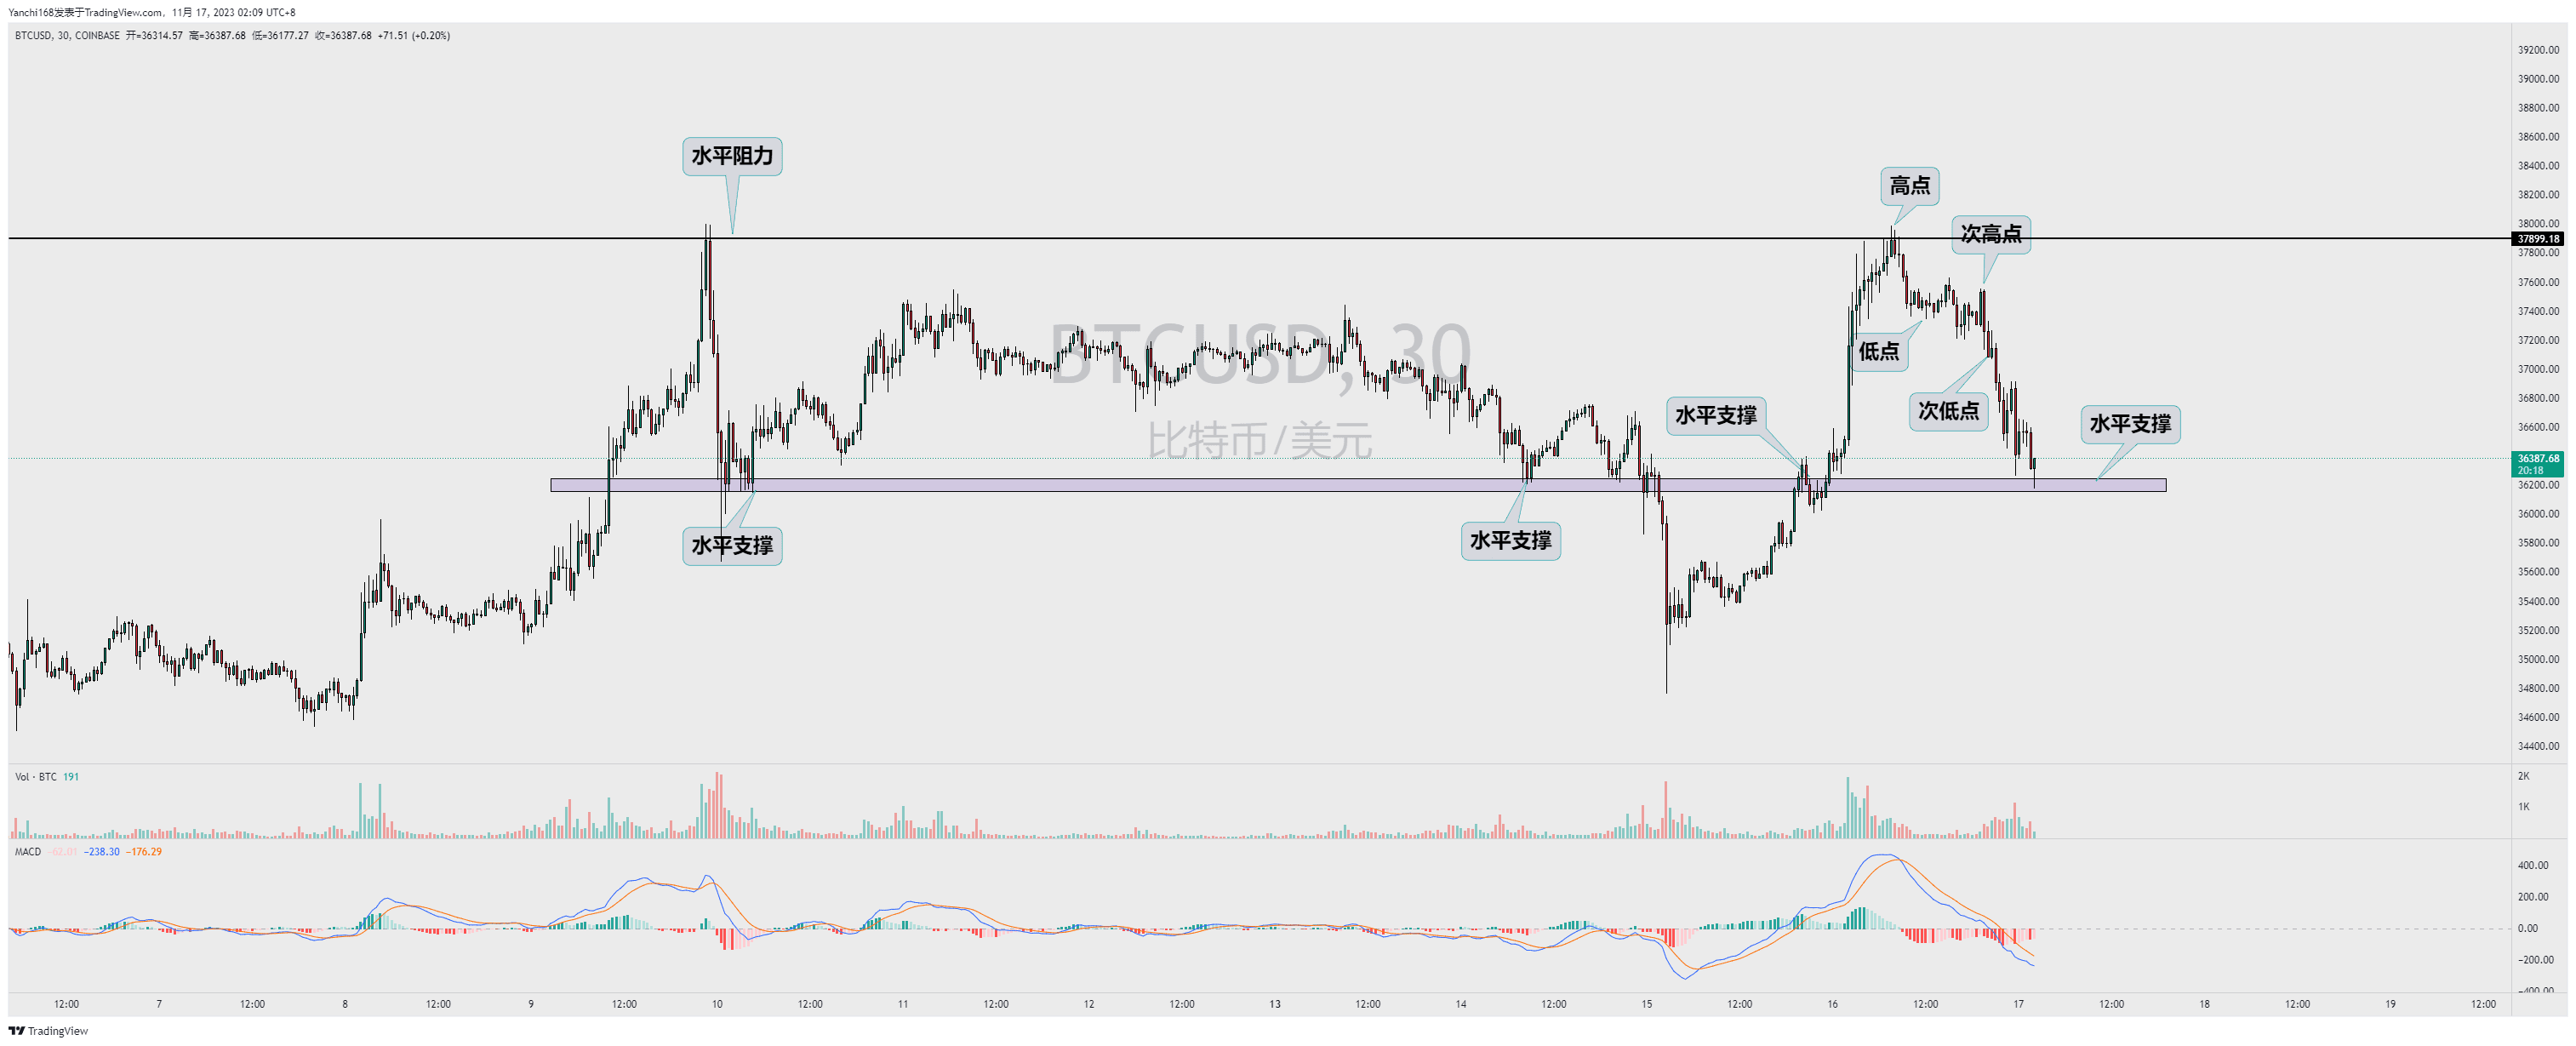
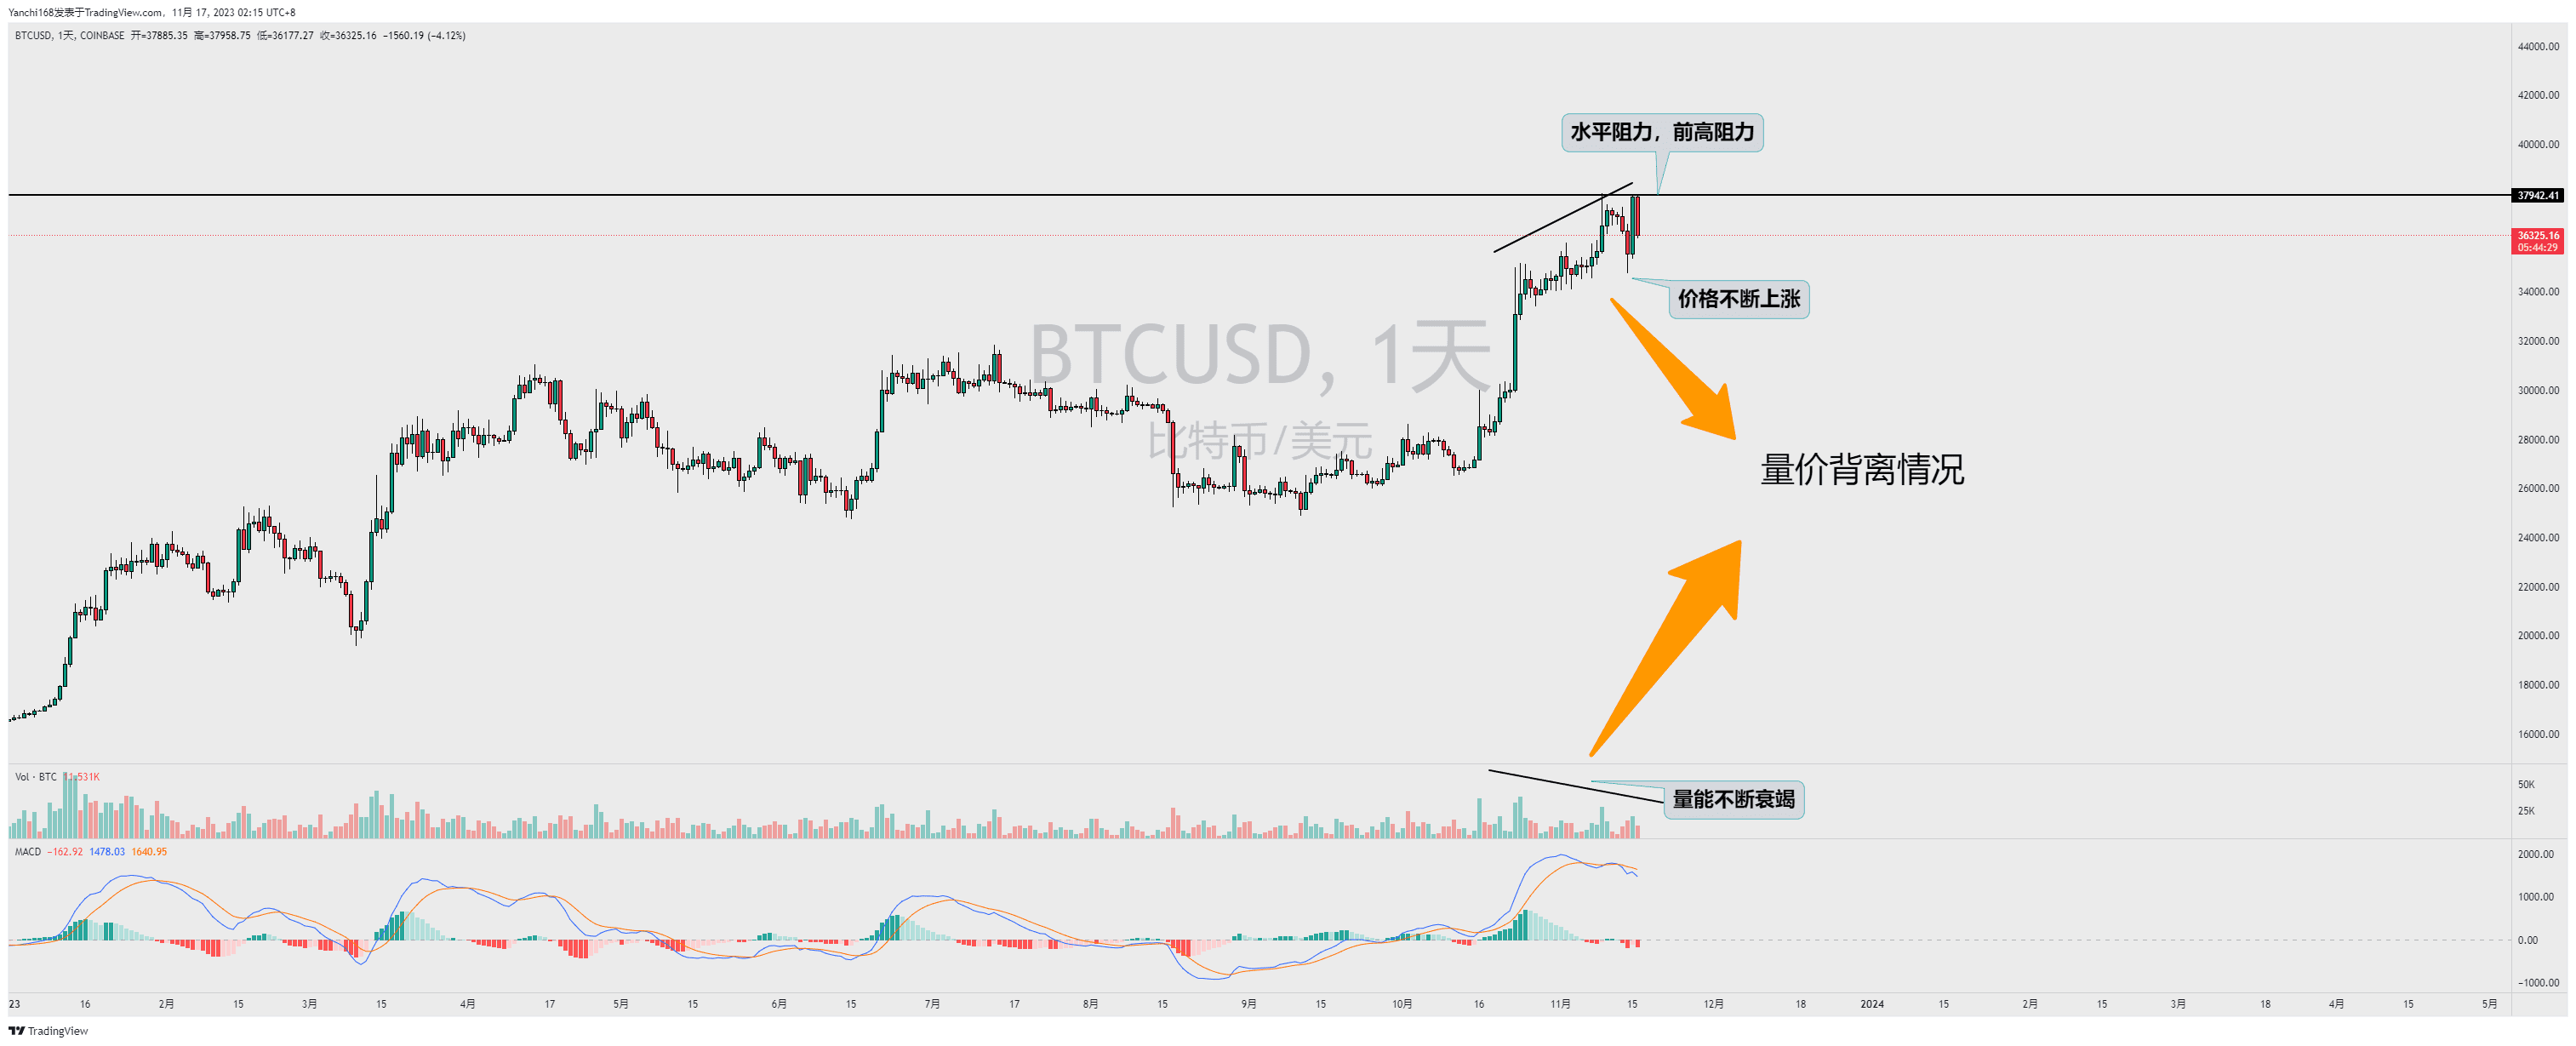
Figure 2: Volume-price divergence schematic diagram.
If you look at the chart like this, do you feel it's very clear?
Including some opponents of chartists, it's not really that drawing lines doesn't work, it's just that the lines you draw don't work.
When I'm live, I always tell partners that trading techniques are not really complicated. If you treat it as a game, it's like everyone is finding fault. The market leads, and indicators lag. Indicators follow prices, not prices follow indicators.
免责声明:本文章仅代表作者个人观点,不代表本平台的立场和观点。本文章仅供信息分享,不构成对任何人的任何投资建议。用户与作者之间的任何争议,与本平台无关。如网页中刊载的文章或图片涉及侵权,请提供相关的权利证明和身份证明发送邮件到support@aicoin.com,本平台相关工作人员将会进行核查。


