Click to watch the video: Master Chen's 11.16 Video: Can the Market Hold at 35000? What's the Next Upside Target for the Medium and Long Term?
So yesterday, Bitcoin also held at the 35000 mark and surged by 6%, so the bullish position remains firm. I believe this is a deliberate drop by the main force to lure short positions, as the US dollar index has already collapsed, and Bitcoin won't fall much further. So, holding at this low point of 35000 or the support of 35000, some friends may have entered the market. Today, let's discuss Bitcoin's next upside target, including sharing some knowledge about the charts.
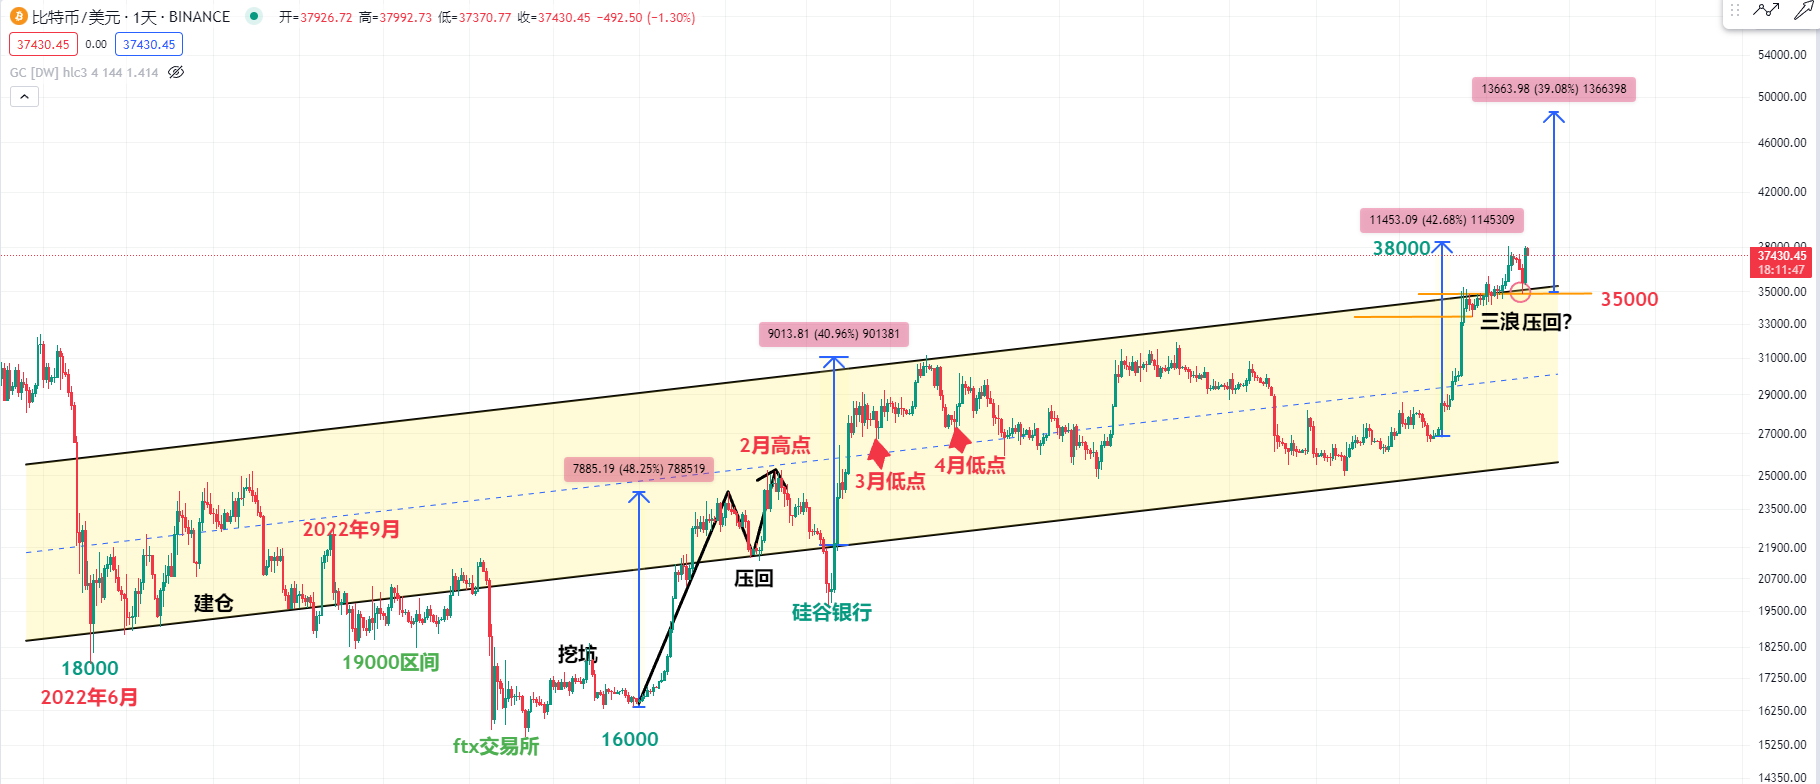
Let's first take a look at the Bitcoin daily chart. The support at 35000 depends on individual leverage multiples. With a tenfold leverage, setting a stop loss at one percent at this position, even if it drops to 34800 in front of 35000, it wouldn't trigger the stop loss. Generally, I think a one percent stop loss is relatively appropriate for tenfold leverage.
So, this support position is quite clever. The main position depends on where your high point will slide to, and there will be some signs within the axis. For example, the low point in March this year, or the low point in April of the past few years, including the high point in front of Silicon Valley Bank, which was around February this year, or Bitcoin in September 2022. There is a very obvious support level drawn within this range.
When we look at the support and resistance of some trading varieties, it's not necessary for their support and resistance to be horizontal. I believe the main force is taking one step at a time in this channel, possibly reducing positions at this position, digging a pit, and then pulling it up, fluctuating below this channel, or sometimes it may return to the upper channel. But this time is different. After a year or half a year of consolidation in this platform range, it has broken through the upper channel range and has already departed from this gentle upward channel.
In the history of Bitcoin's trends, they have been parabolic. So, it's possible that it's completely parabolic now. I also mentioned a few days ago that you need to pay attention to the possibility of a pullback to this position, because there was a pullback at that time, but now there isn't. My view is that the third wave may be different from the first wave. It may have a shorter time and a more rapid rise. For example, the bottom position of 16000 and the top of Silicon Valley Bank both rose by 40%, then there was a shakeout, or there may be a possibility of consolidation at this position in the short term. But my view is that it's not ruled out that the upside potential may at least reach 48000. Whether there will be a pressure level in the middle of 48000 in the short term, I will explain later.

Next, let's share the RSI indicator at the daily level of Bitcoin. This RSI indicator feels very magical. It often leads the reaction at the breakthrough of the trend or the support of the trend. We can see that in this wave of market, Bitcoin rose from 25000.
At this position, returning to the box, we hope that friends will break the box and not return to it. At that time, I also told friends that if it goes up to 25500, it's a buying opportunity. We can also see that the RSI indicator had a leading reaction at several low points. For example, when it dropped back to 35000, or at this position of 35000, friends bought in.
My view is that if you did it right, set your defense at your cost position, or in the short term, you can adjust your profit-taking position. Because yesterday's candlestick has already eaten up the previous four candlesticks. In my view, you can also set half of your position's stop loss position at half of this candlestick's position. Or some friends have been worried about the recent rise in Bitcoin prices. The daily level of KDJ, MACD, and many indicators are diverging, including the RSI indicator. I want to tell everyone that the trend is greater than everything else. Don't worry about the divergence of the RSI indicator.

Because we can see that the RSI indicator at the weekly level is not the same as the previous uptrend. It may be a third wave of the uptrend. If the RSI indicator comes above 70, don't worry about the divergence of other daily level indicators. It may have a parabolic rise.
We can see that at this position in 2020, Bitcoin had a parabolic rise when the RSI indicator came above 70. Now it's above 70. Do you see any divergence in the weekly chart? So, don't worry about Bitcoin's decline or some friends going short. I hope everyone won't trade against the trend. Wait for Bitcoin to rise to a risky position, then we can go short.
Next, let's look at the RSI indicator at the weekly level. It has been obvious for over a year that each trend will lead the price reaction. We can see that at these two high points of Bitcoin, the RSI had a downward trend. When it broke through at that time, slow-reacting traders should have entered the market long. Or we can see that in the bear market of 2022, from the high point of 65000 or the low point, the RSI had several high points and a downward trend. Later, we can also see that when it broke through at this position range, the RSI also reacted at this position.
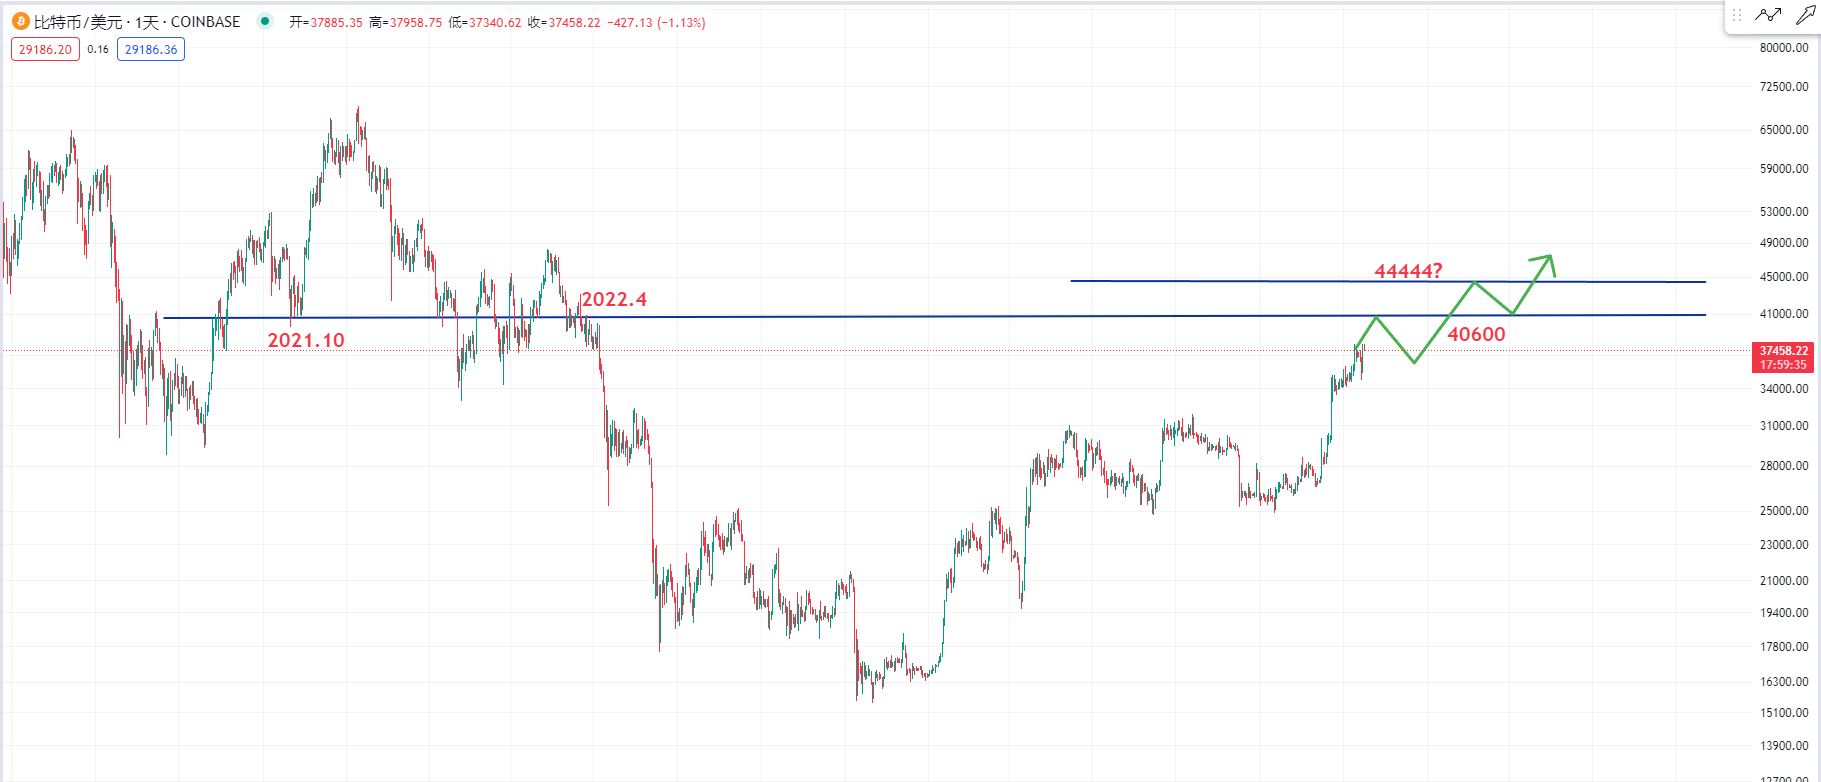
Then let's discuss how to judge the short-term pressure levels before Bitcoin rises to 48000, because sometimes the points I mentioned have gone through some calculations. Let's take a look at this position. We need to consider whether Bitcoin's price will continue to rise and whether there may be a range around 40000 US dollars.
Because based on historical experience, sometimes integer positions may also have pressure, or friends can also observe around 40600 US dollars. If the short term continues to rise, observe whether there will be pressure at this position. We can see that 40600 US dollars was also at this position in April 2022.
If we draw a straight line to observe, it was in October 2021. At that time, there was a support and resistance conversion at these low points. However, I believe it should continue to challenge, or maybe it will continue to rise after consolidating in place. But don't forget there is also a number, which is 44444. Will there be a pause or consolidation at this position before breaking through?
For more strategies, you can add the live account.
Candlesticks are king, trends are emperor. I am Master Chen, focusing on BTC, ETH spot and contract for many years. There is no 100% method, only 100% trend following. Daily updates on macro analysis articles and technical analysis review videos across the web!  Friendly reminder: Only the official public account (shown in the image above) is written by Master Chen. The advertisements at the end of the article and in the comments are not related to the author. Please discern carefully between true and false. Thank you for reading.
免责声明:本文章仅代表作者个人观点,不代表本平台的立场和观点。本文章仅供信息分享,不构成对任何人的任何投资建议。用户与作者之间的任何争议,与本平台无关。如网页中刊载的文章或图片涉及侵权,请提供相关的权利证明和身份证明发送邮件到support@aicoin.com,本平台相关工作人员将会进行核查。


