Click to watch the video: Master Chen's 11.15 Video: Main Force Analysis of Plate Washing Targets and Where is the Next Support for the Market?
So, the CPI announced by the United States yesterday was not unexpected at 3.2, which is similar to my prediction two days ago. I just didn't expect the main force to wash the plate at 3.2 as well. This is good news for retail investors, as the main force may wash the plate at high points. Today, we will discuss where the next support for Bitcoin is and not be deceived by the main force's decline. It may still go up, and I will also share some knowledge from the charts later.

First, let's take a look at the daily chart of Bitcoin. We have been discussing the normal upward channel of Bitcoin these days, which may be the range from June 2022 to 19,000. The recent fluctuations on FTX exchange and the Silicon Valley Bank event are abnormal black swan movements. There are several normal low points, including those near 20,000 and the low point around 25,000. There exists a normal upward channel, so the recent rise from 26,000 to the high point of 38,000 is similar to the rise starting from around 24,000 in January, which is a 40% increase.
It's also a 40% increase this time. I have been mentioning in the videos these days to beware of the main force breaking through the current upper track position and the possibility of retesting this upper track. I didn't expect the test to reach the low point near 35,100. Carefully observe the position of the previous long orders, which is around 34,500 and is a very important support area. It's difficult to place orders in this position in the short term.
It's possible that it's similar to the range in February this year. We can see that after a 40% increase, it retraced to the position of the lower track and retested the support. The current retracement may also be a retest of this support. First, we need to observe this support and prevent it from breaking. If it breaks, we need to observe if there are any other support levels. First, we need to observe the support level at this position in February this year. After retracing to this position, there was a short consolidation of about four candlesticks. We also need to observe the structure in front, where it held the support of the previous high point and then rose. However, we need to be cautious about the possibility of it consolidating in this range in the medium to long term and retesting this position, causing you to hit the stop loss again.
In this wave of market, friends can chase at any position, but the current situation is that the main force will continue to wash out the chips added at these high points. There may be more long orders opened at these positions, so you need to be cautious. It may not be so good to hold for the long term. So, now we need to observe the current position, which is around 35,000. The closing price should not effectively fall below. If it does, we need to be cautious about the possibility of even lower low points.
So, we need to observe the position in February this year. After rising from this low point, it retraced to the golden ratio position, which is close to 0.382 from the bottom of 16,000 to the high point of 25,000. We still need to be cautious about whether the current position of 35,000 can hold. If it can't hold, then we need to observe the position of the golden ratio 0.382. We need to observe the approximate low point of the two candlesticks from this breakout point to the high point to see if there may be a support level.
So, if the current position breaks, we need to be cautious about the possibility of it returning to this position and continuing to oscillate in this range. The upper side may be just a short-term or medium-term trap, but my view is that in the long term, it should continue to rise.
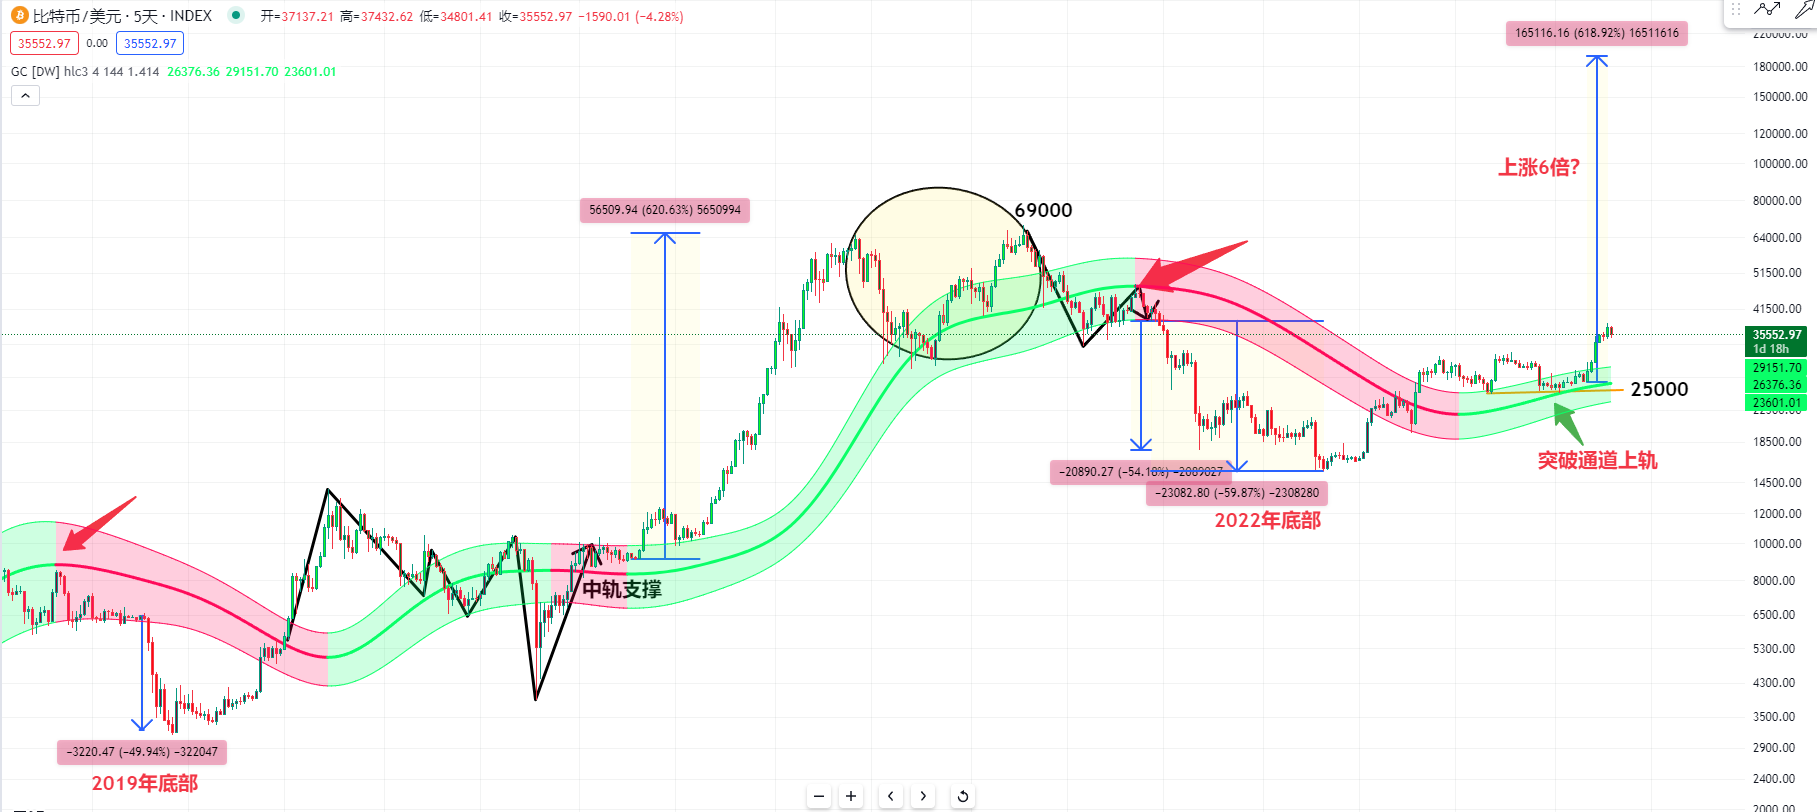
Next, let's take a look at the 5-day chart of Bitcoin. When it was at the bottom, I also predicted that if Bitcoin rises to a high point in a bull market and then returns to the Gaussian channel, especially breaking below the lower edge of the channel, we can calculate the space from this lower edge, and if it falls by about 50%, it may be the bottom. However, after the FTX exchange collapsed, the bottom was from the position of the 5-day Gaussian channel, which fell by 60%. I believe it won't return to this range now because the price has already broken through the upper edge of the Gaussian channel, especially in this consolidation range of over 200 days, where it tested the upper edge once or even the middle edge twice. We can look at history. At the bottom of Bitcoin in 2019, after a crazy rise, it started testing the upper edge, which we need to be careful about. Especially when it broke below the 5-day Gaussian channel, it fell by nearly 50%, which was the bottom.
But now, let's observe the current trend of Bitcoin. Because it has also tested the upper edge once and then returned to the middle edge near 25,000 to start the rally until now. My view is that we can reverse to observe when Bitcoin was in a bear market from 69,000 and see if it also retested the middle edge and then started collapsing from 48,000, continuing for half a year to over a year.
My view now is that we can look at the position marked by the red arrow at that time and the position marked by the green arrow at 25,000 this time, which is the middle edge. There was so much volatility afterward. My view is that in the current bull market, the rally starting from the middle edge should not be less than this space of volatility. We can see that in the first wave of the rise in 2019, it was very strong, then it retraced to the middle edge or even broke below the lower edge due to a black swan event. But after returning, it started from this position, tested the support of the middle edge, and then rose from here, increasing by six times. So, I believe that this wave of Bitcoin's rally from this low point should not be less than six times.
For more strategies, you can join the live trading.
Candlesticks are king, trends are emperor. I am Master Chen, focusing on BTC and ETH spot contracts for many years. There is no 100% method, only 100% trend following. I update macro analysis articles and technical analysis review videos daily across the web!  Friendly reminder: This article is only written by Master Chen in the public account (as shown in the picture above). The advertisements at the end of the article and in the comments section are not related to the author. Please carefully distinguish between true and false. Thank you for reading.
免责声明:本文章仅代表作者个人观点,不代表本平台的立场和观点。本文章仅供信息分享,不构成对任何人的任何投资建议。用户与作者之间的任何争议,与本平台无关。如网页中刊载的文章或图片涉及侵权,请提供相关的权利证明和身份证明发送邮件到support@aicoin.com,本平台相关工作人员将会进行核查。


