Original Author: Reflexivity Research
Original Compilation: angelilu, Foresight News
Key Points:
BTC's performance this quarter has been poor, with a quarter-on-quarter decline of 11.5%, but it still outperforms most asset classes year-to-date.
The impact of U.S. financial institutions that drove Bitcoin's rise in the first half of the year has completely faded at the time of writing.
Bitcoin's trading volume, liquidity, volatility, and search trends are all declining.
The Grayscale GBTC negative premium has decreased from 48% to 16%.
Long-term holders of Bitcoin have reached a historical high, exceeding 76%.
Valuation of Bitcoin's intrinsic value indicates that the price is at the lower end of its value.
Bitcoin's active addresses have slightly increased, while the transfer volume (adjusted for entities) continues to decrease.
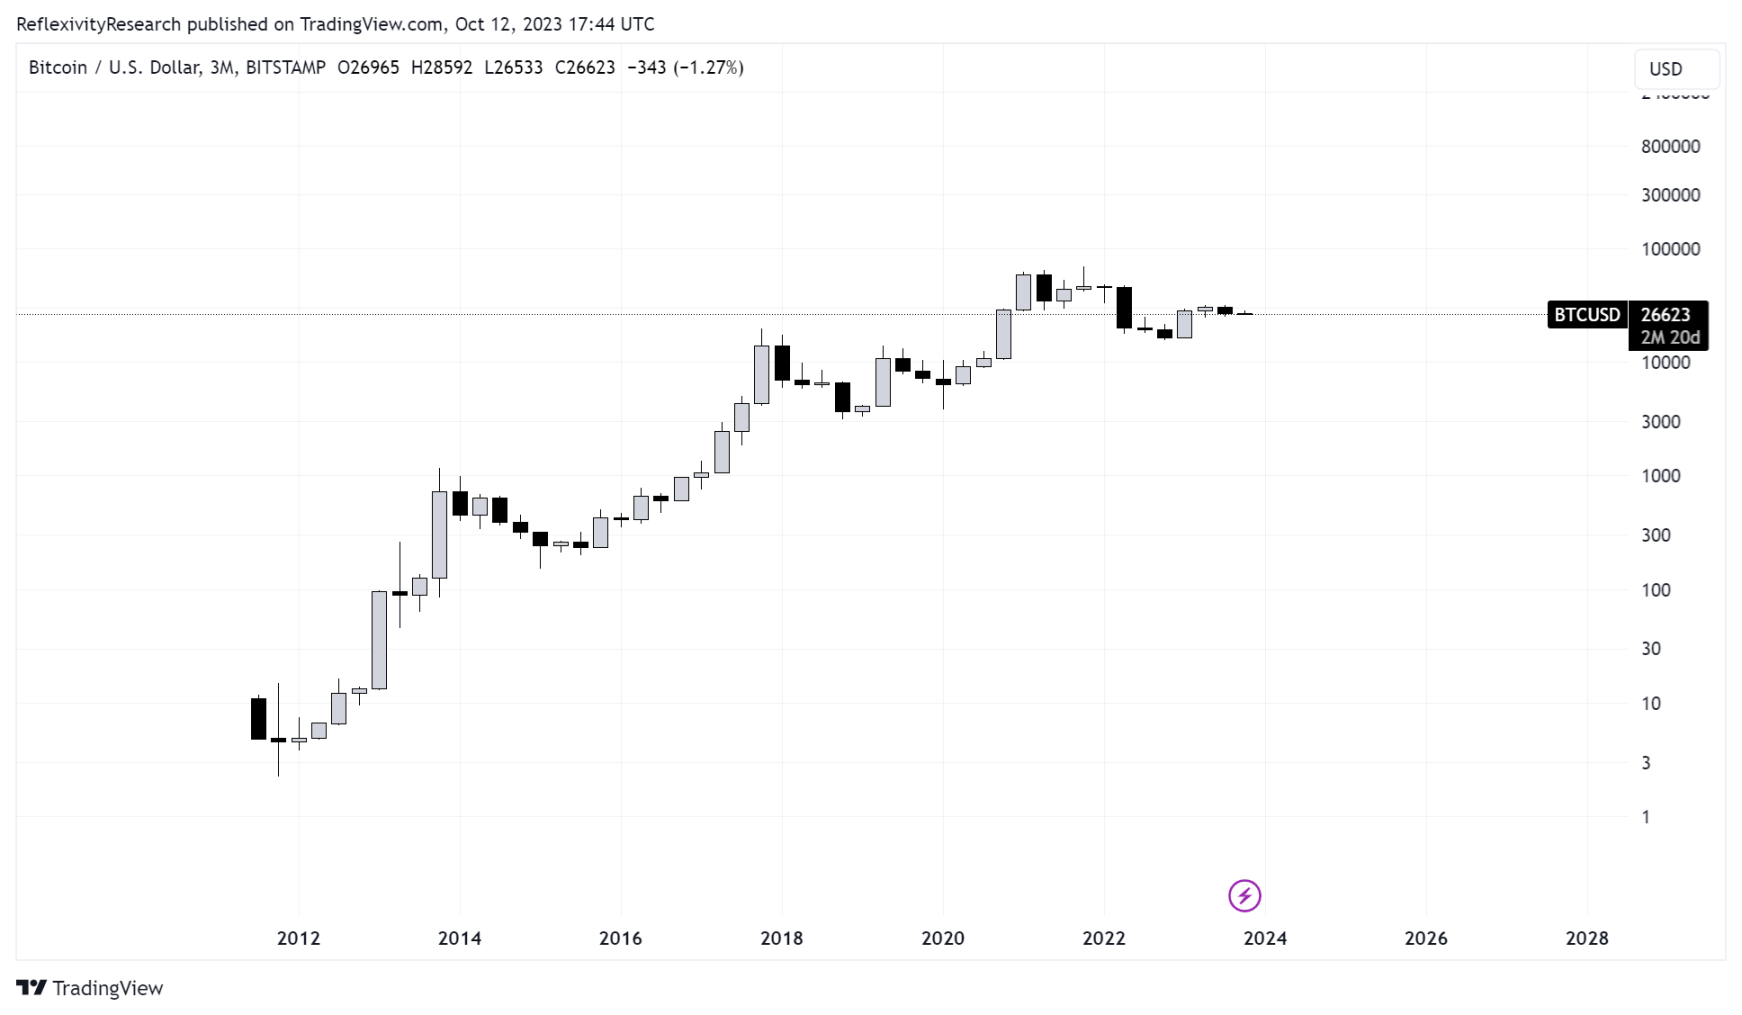
Following a strong performance in the first half of the year, Bitcoin's performance in the third quarter has been lackluster, with a 11.5% quarter-on-quarter decline.
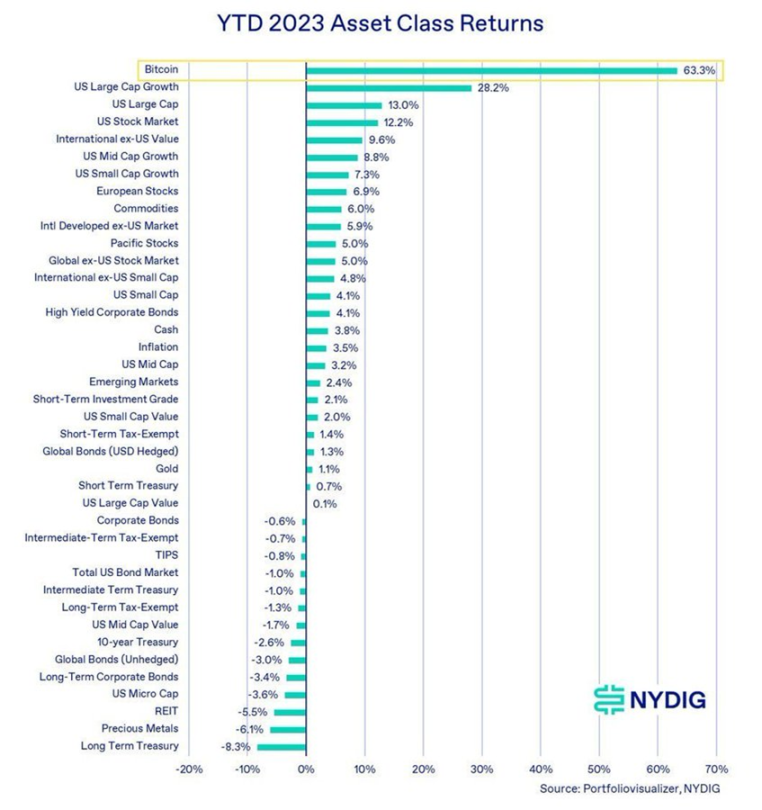
However, in this chart from NYDIG, we can see that from 2023 to date, Bitcoin has delivered a return of 63.3%, outperforming major stocks, small and mid-cap stocks, U.S. and European stocks, commodities, government bonds, gold, cash, emerging markets, and real estate investment trusts.
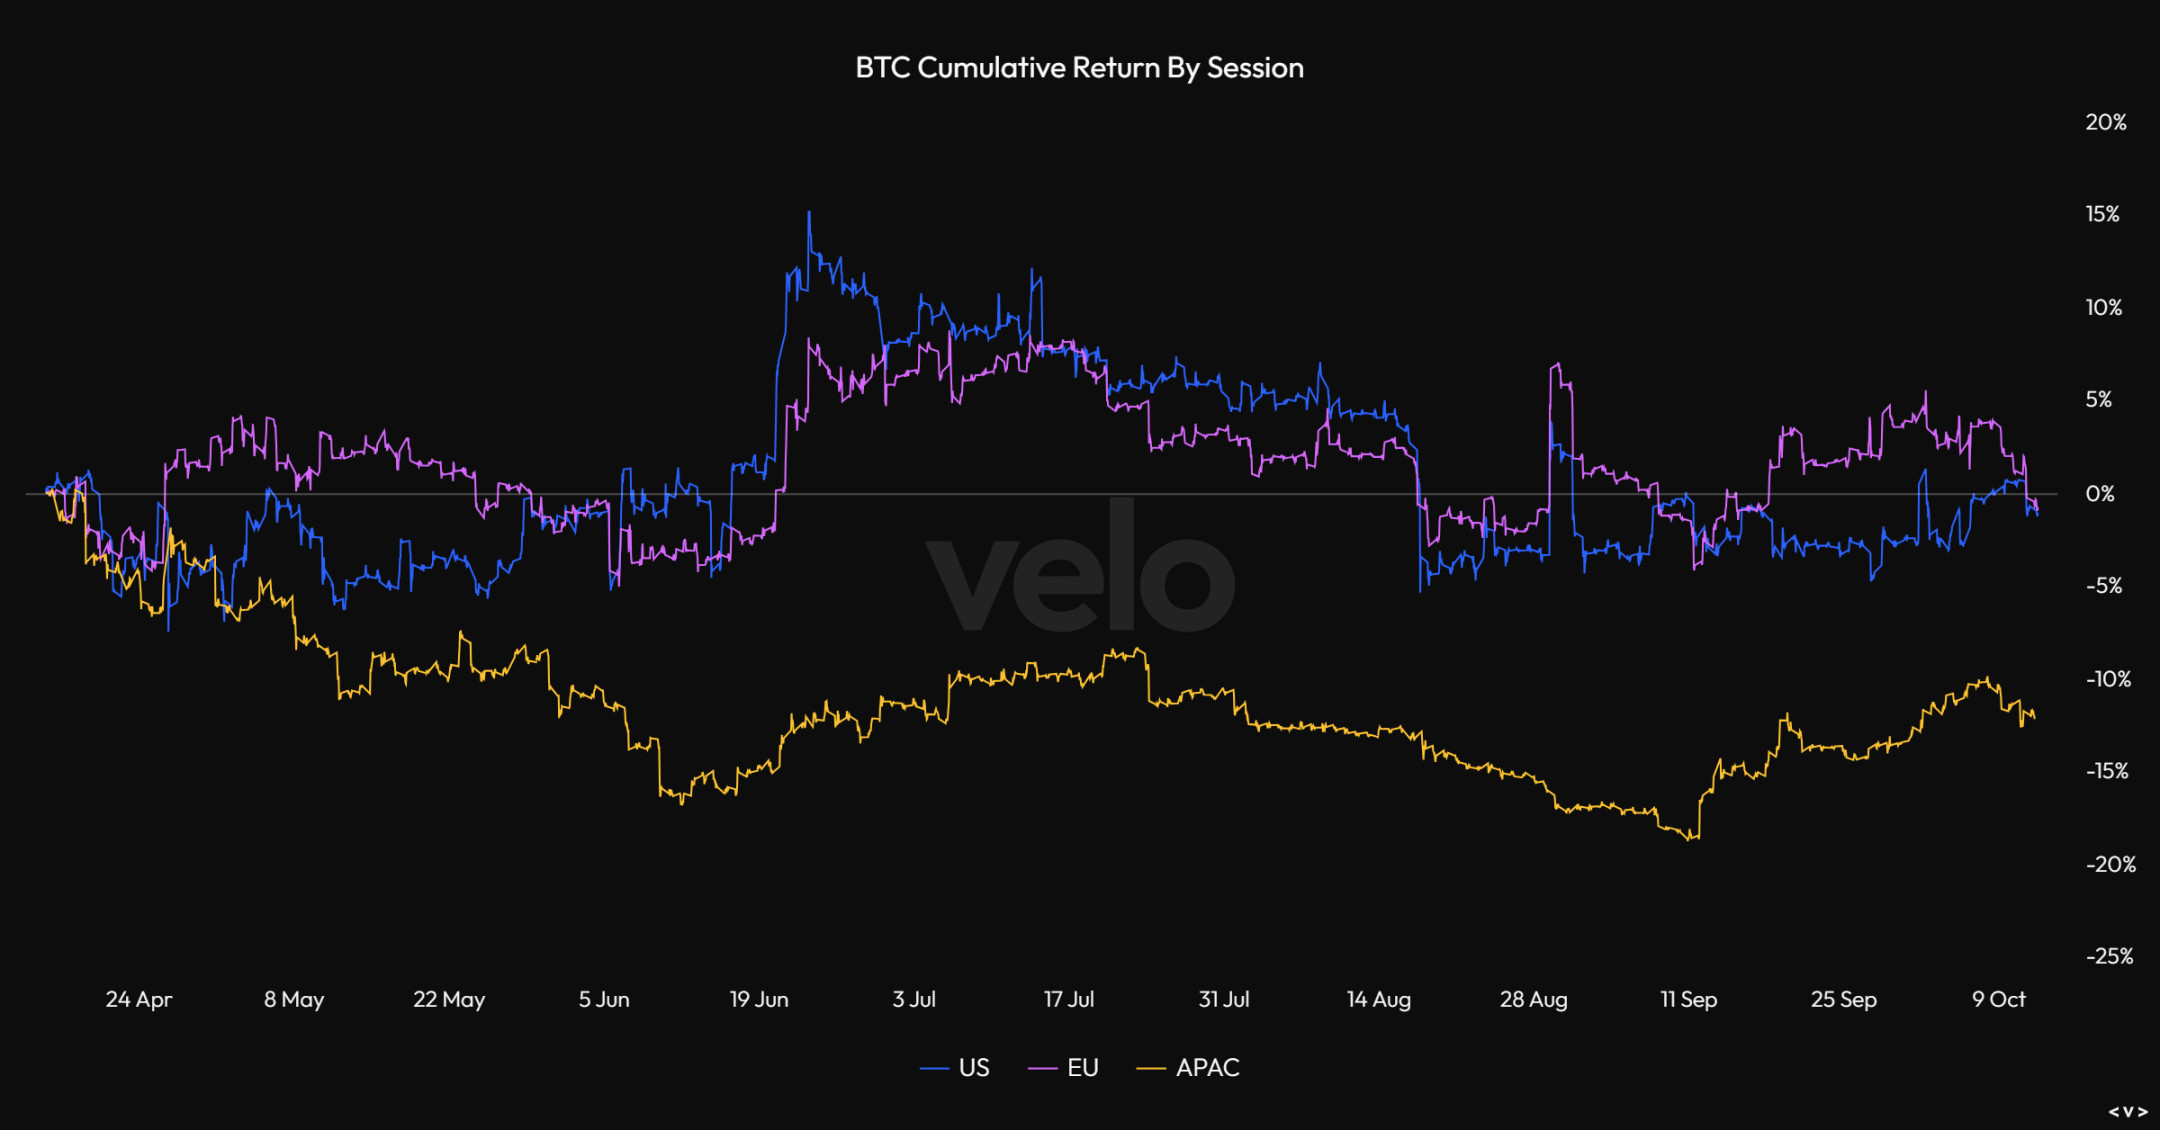
One important factor driving Bitcoin's performance in the first half of the year was the submission of Bitcoin spot ETF applications by several well-known traditional financial institutions such as Blackrock and Fidelity. After these applications were submitted in mid-June, Bitcoin's cumulative return during U.S. trading hours surged to a quarterly peak (about 15%). However, as shown in the chart below, the premium has been completely eliminated over the course of 3 months, reaching close to 0% by the end of September.
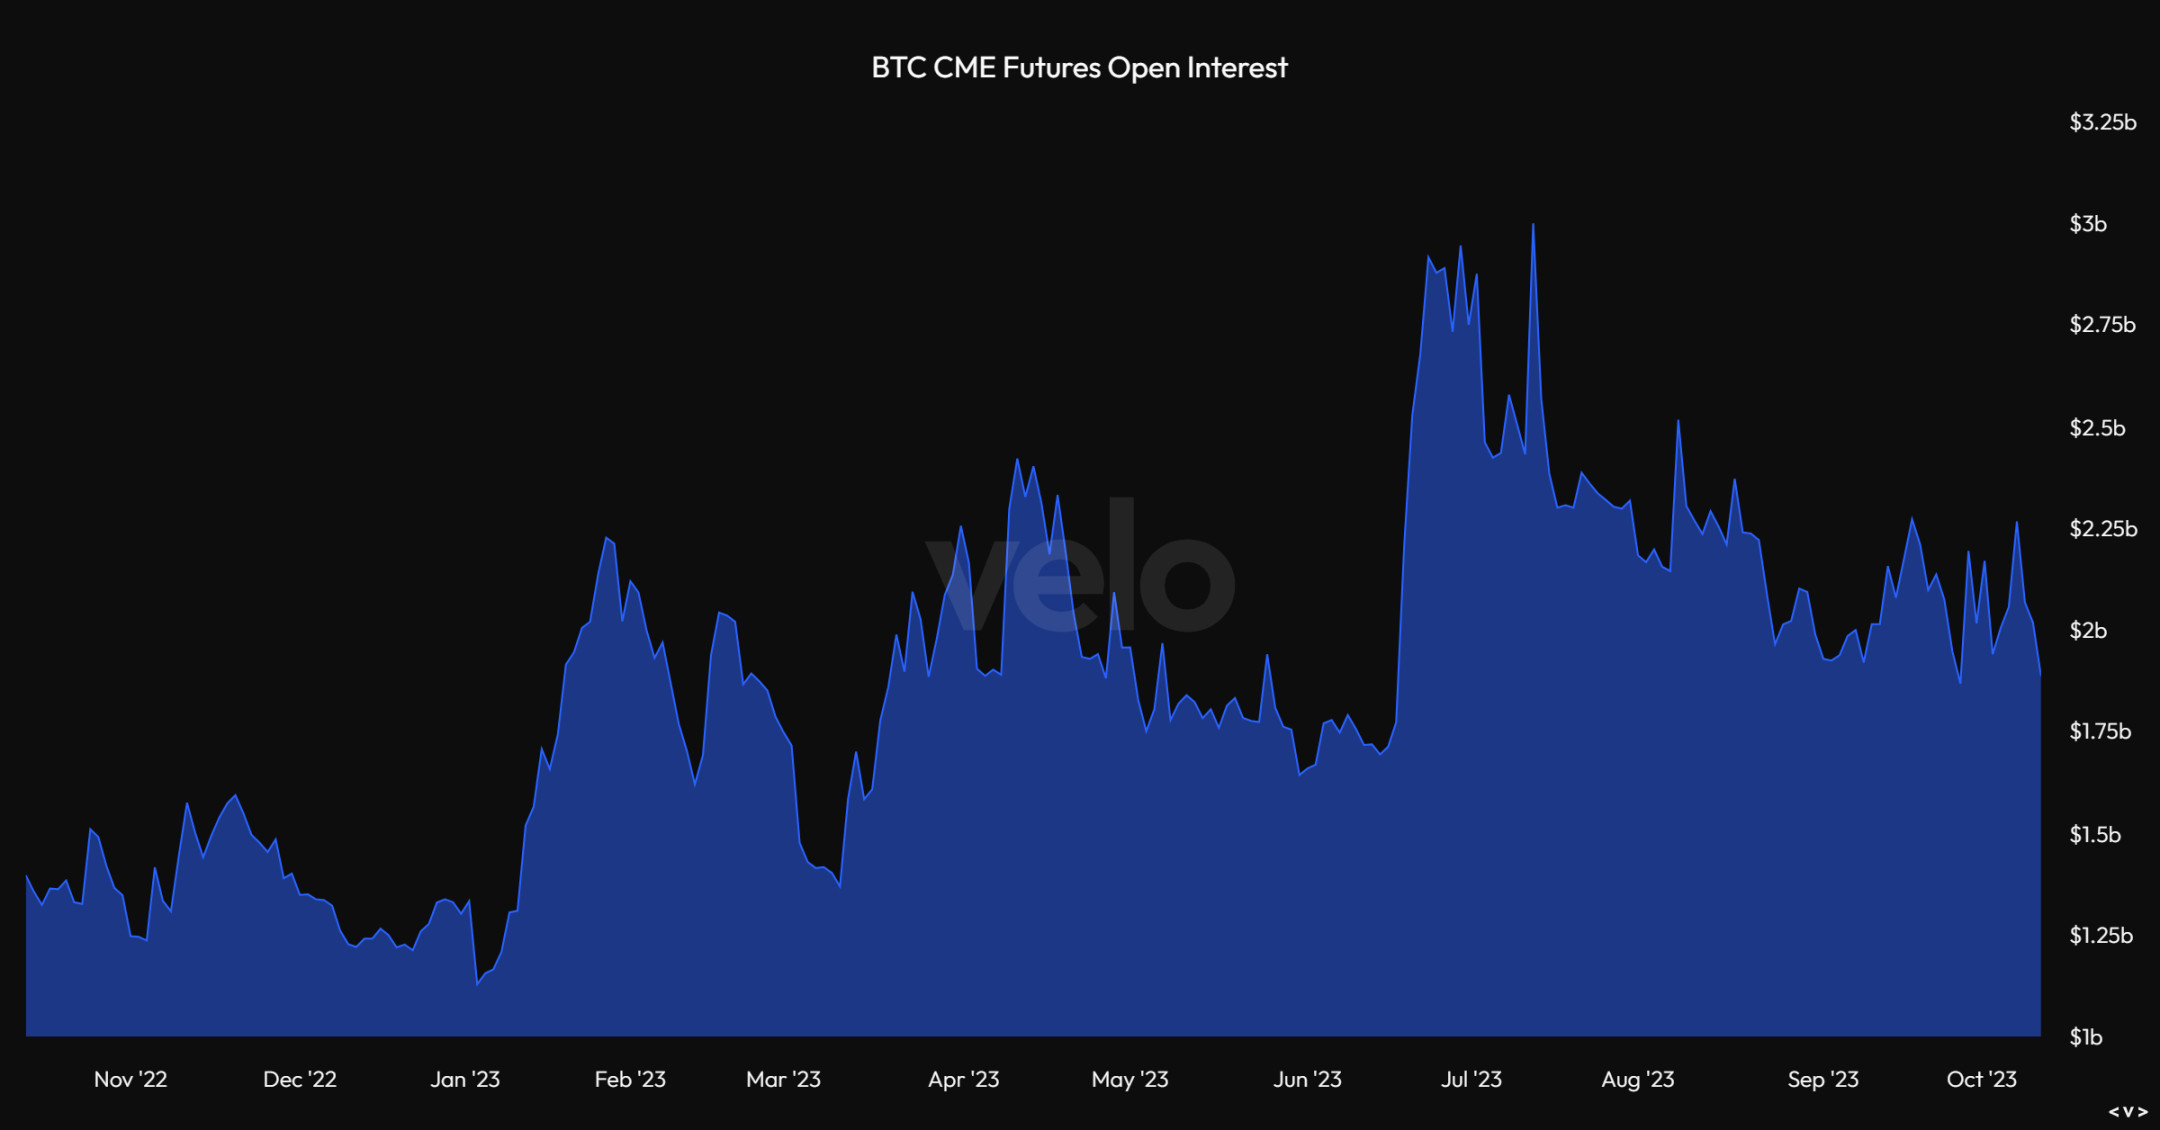
In the third quarter, the fluctuation of open interest in CME Bitcoin futures contracts has been significant but overall declining, reaching a peak of nearly $3 billion at the end of July, the highest in 19 months since January 2022, but has since dropped to around $2 billion after the fluctuation, indicating weakening market confidence in Bitcoin.
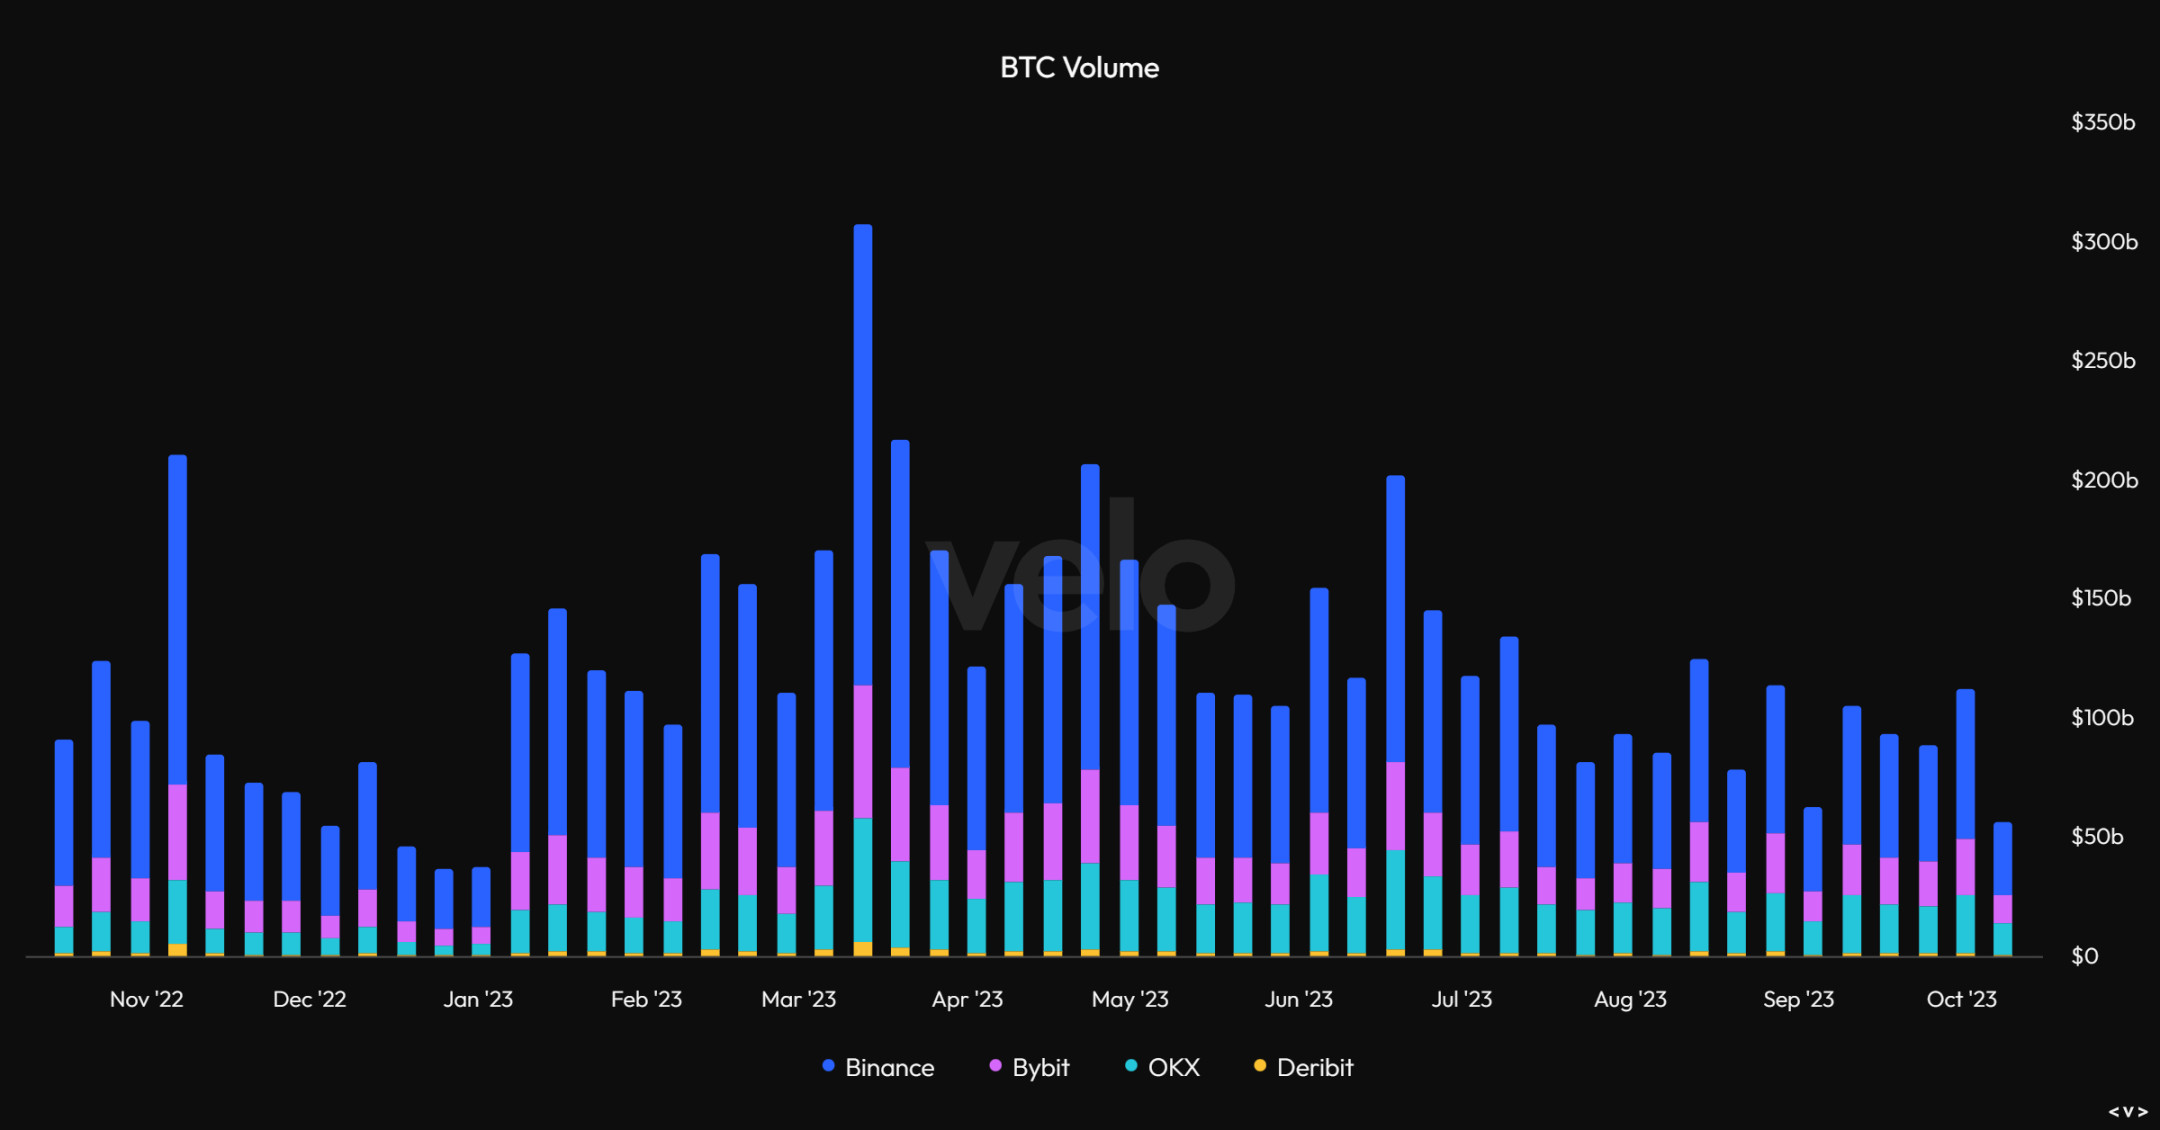
Other indicators in the Bitcoin market have also shown declines, with the trading volume of Bitcoin spot and futures decreasing from around $200 billion in July to around $100 billion in September.
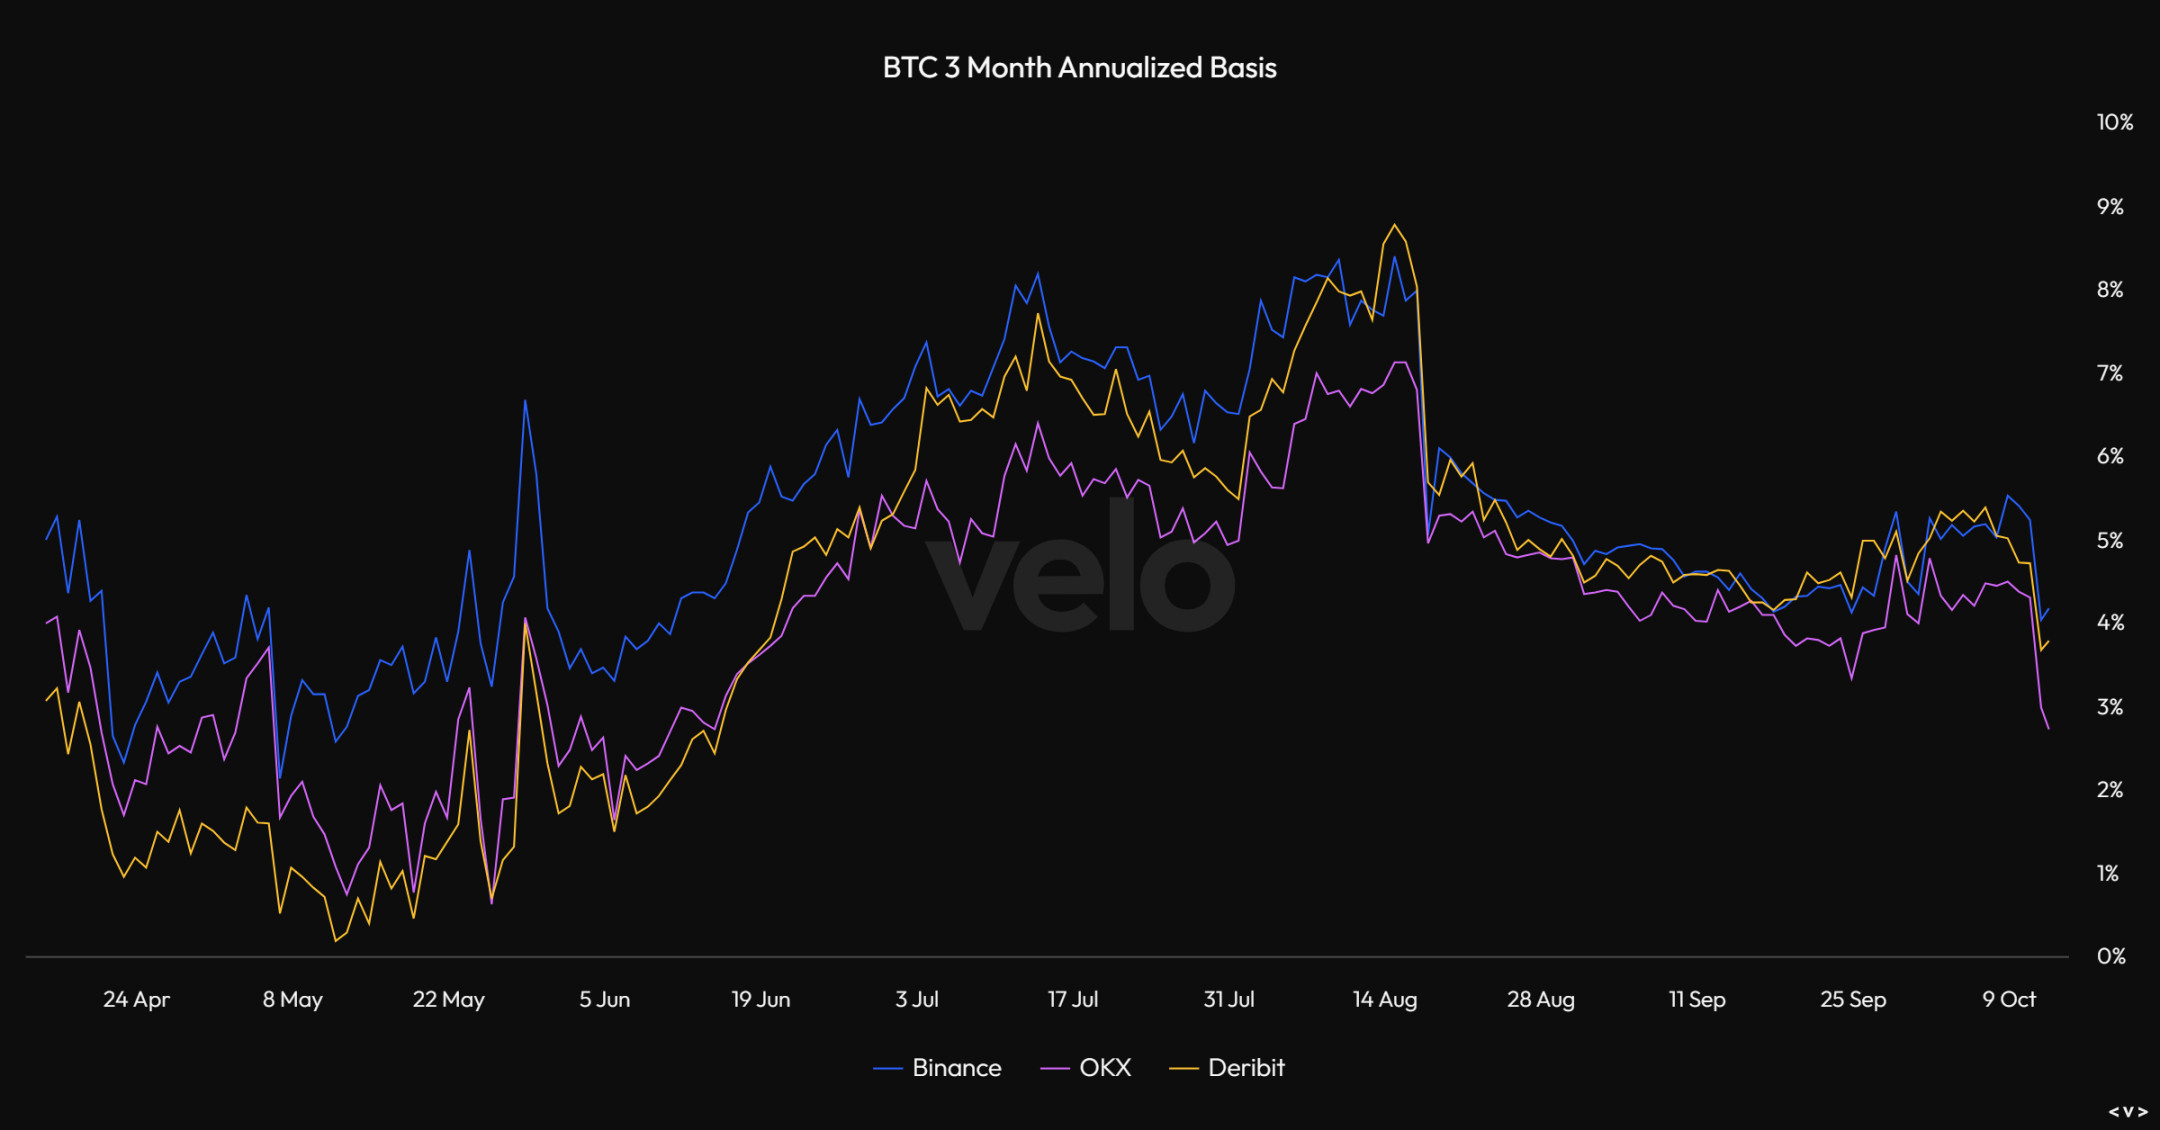
The 3-month futures annualized basis spread for Bitcoin reached a peak in mid-August and then dropped to about 4% by the end of September, indicating that the Bitcoin market is in a downturn.
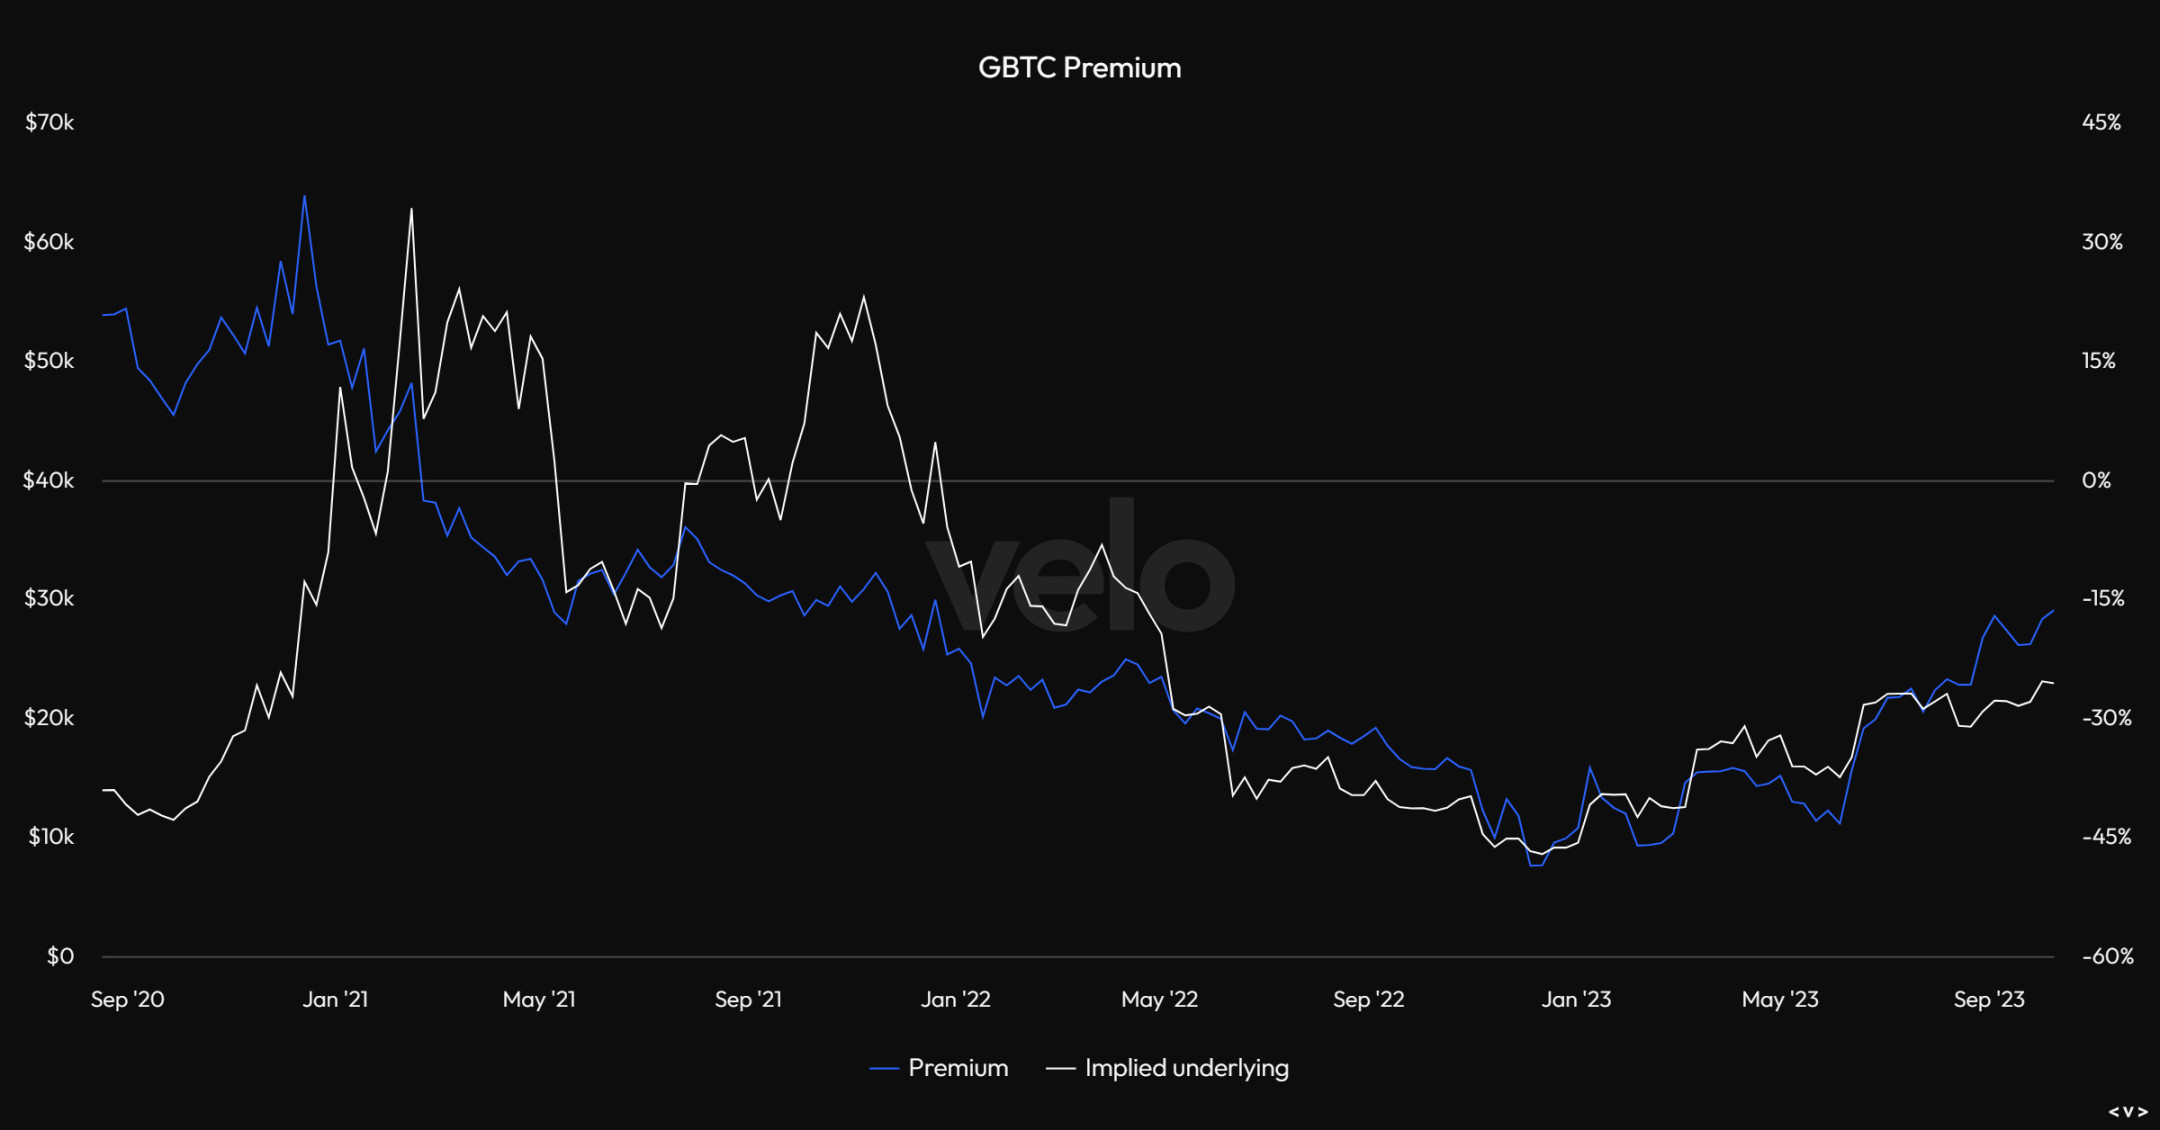
One positive trend observed this year is that the Grayscale GBTC negative premium is narrowing, shrinking from -48% in 2023 to -16%, reflecting a growing positive view in the market that Grayscale may convert its existing closed-end funds into spot Bitcoin ETFs.
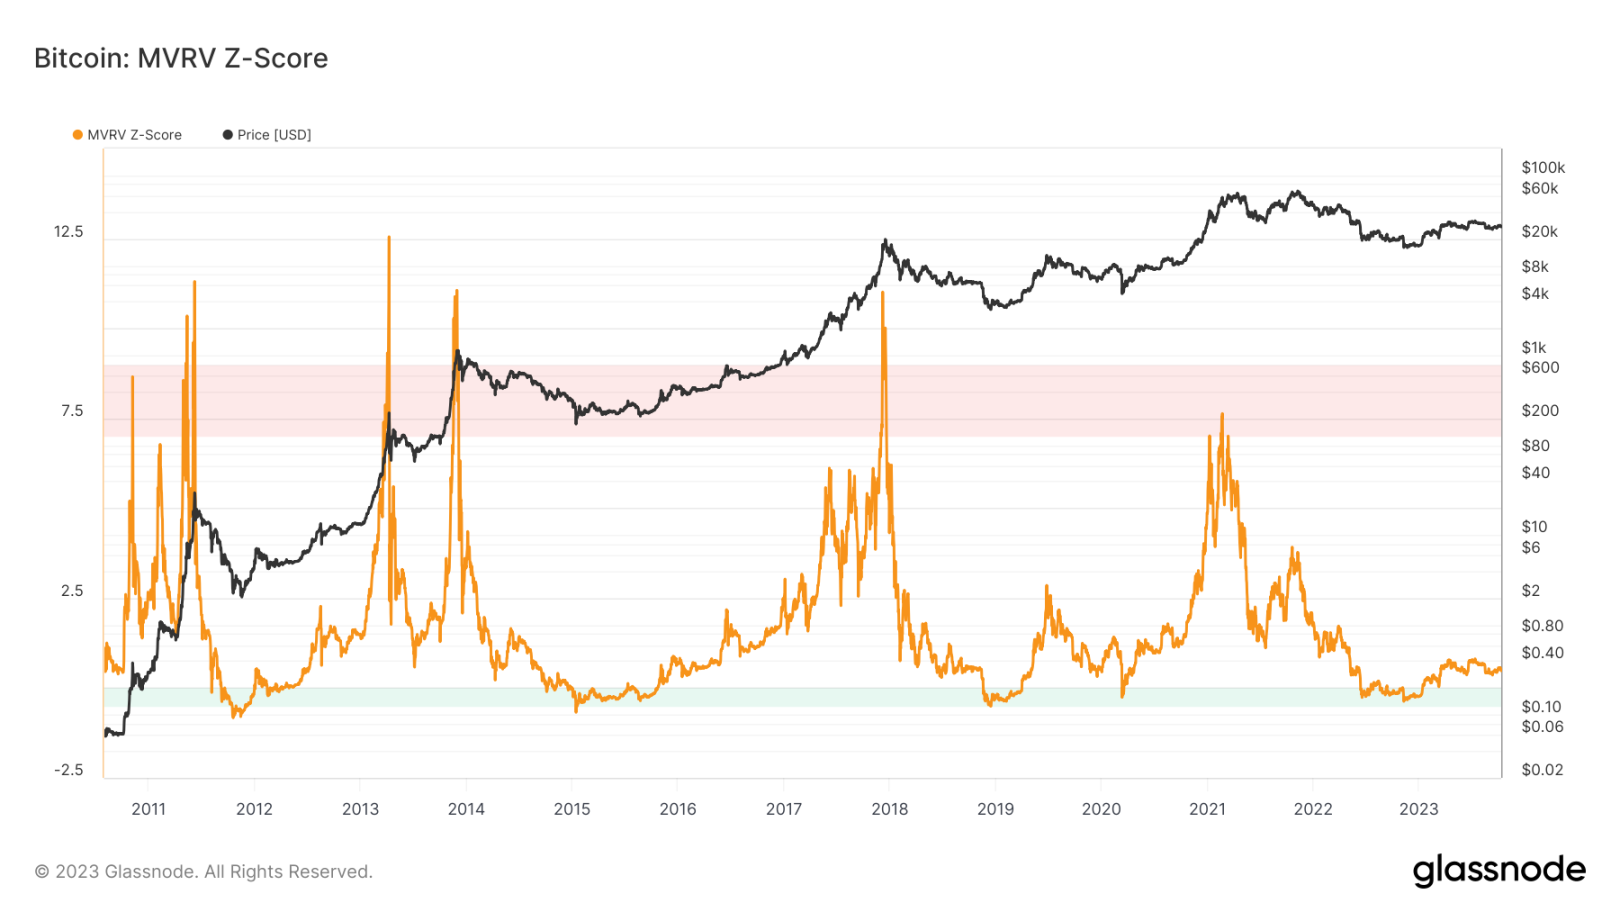
In terms of Bitcoin valuation, one of the most noteworthy indicators is the MVRV ratio, which is the ratio between market price and realized price, with the realized price being the average price at which each Bitcoin was last transacted on-chain. When MVRV is high, market participants hold a large amount of unrealized profits and may realize some of them, while a negative MVRV means the entire market is in a loss. Although the market is no longer severely undervalued as it was at the end of last year, it is still far from the overheated levels reached in 2017 and 2021 peak periods.
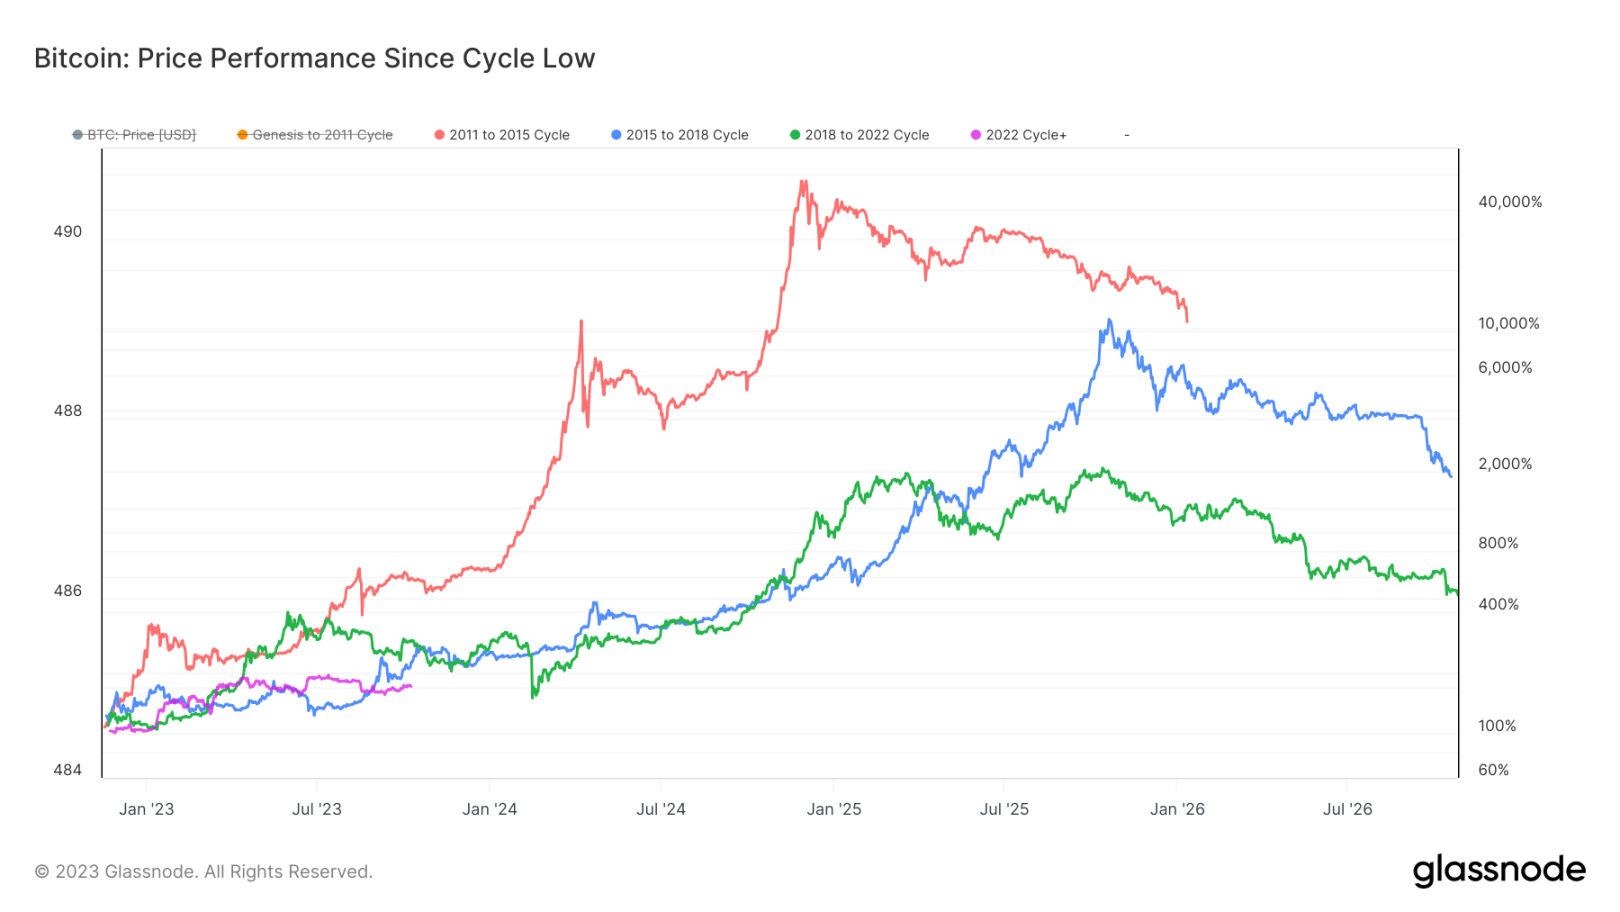
The debate over whether Bitcoin's cycles are driven by halving, macro factors, general behavioral dynamics, or a combination of the three remains a point of contention. However, when comparing the performance of the current cycle with the lows of the first three Bitcoin cycles, from a timing perspective, the cycle development is very similar. Over the 4 four-year cycles starting from 2011, Bitcoin has followed a trend of rise and fall.
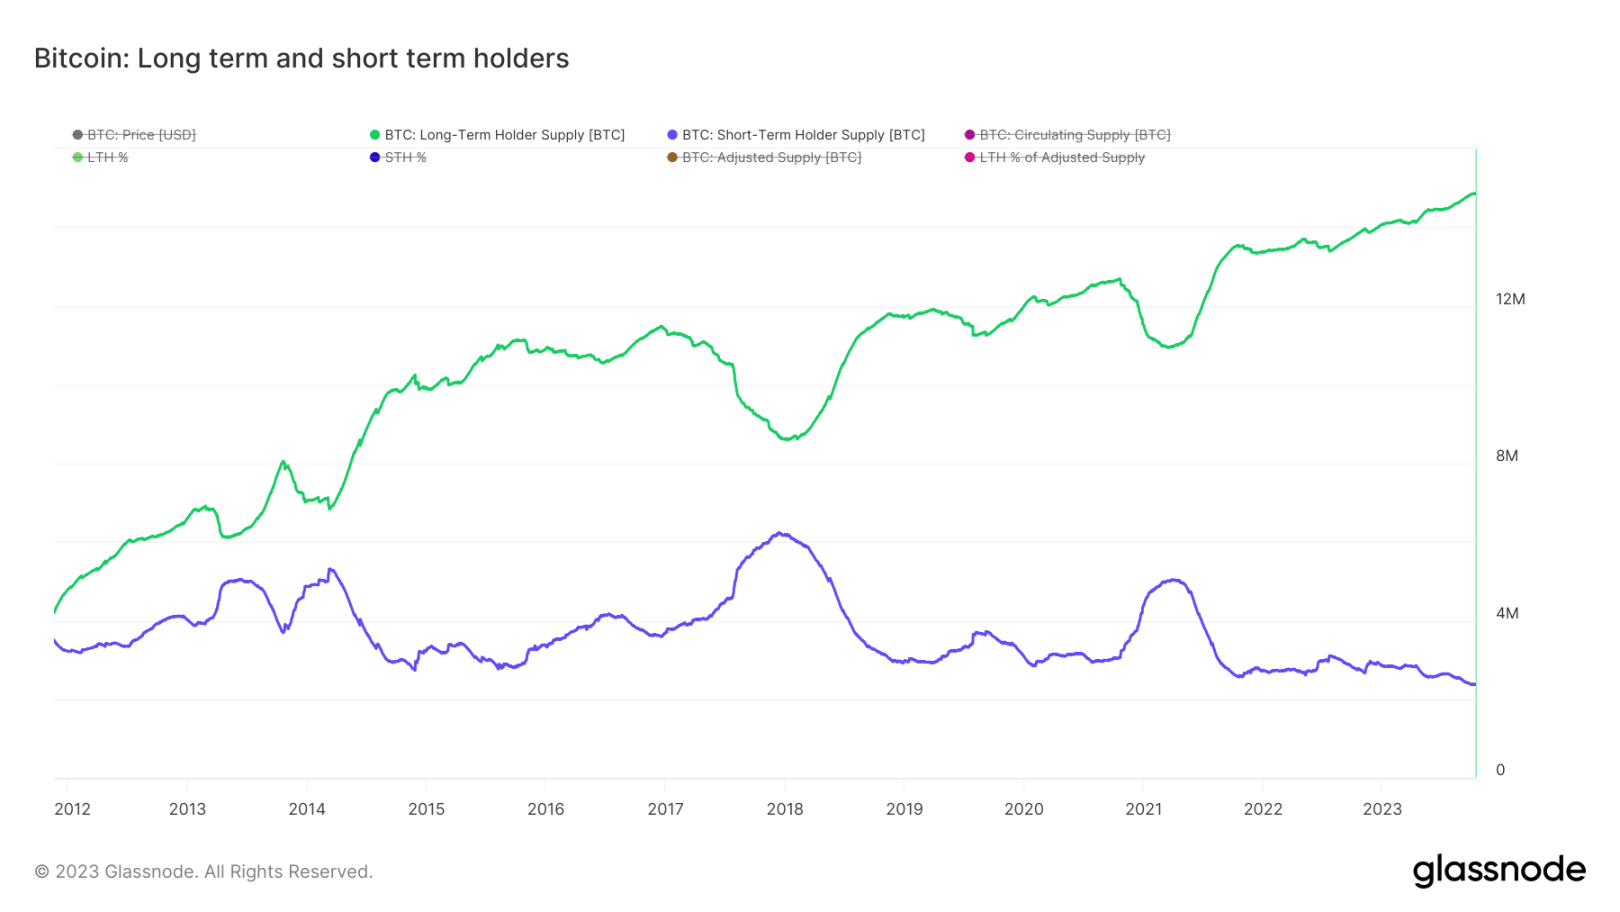
In terms of network activity, the percentage of Bitcoin held by long-term holders has reached a historical high of 76%, meaning that at least 3 out of every 4 BTC are held by long-term holders. Long-term holders of Bitcoin are defined as on-chain entities holding Bitcoin for more than 155 days, and data scientists have found that at this threshold, the likelihood of Bitcoin being spent is the lowest. This data reflects the deep conviction of the core group of Bitcoin holders, despite the volatility and macro uncertainty in the cryptocurrency market, as well as the rise of custodial products.
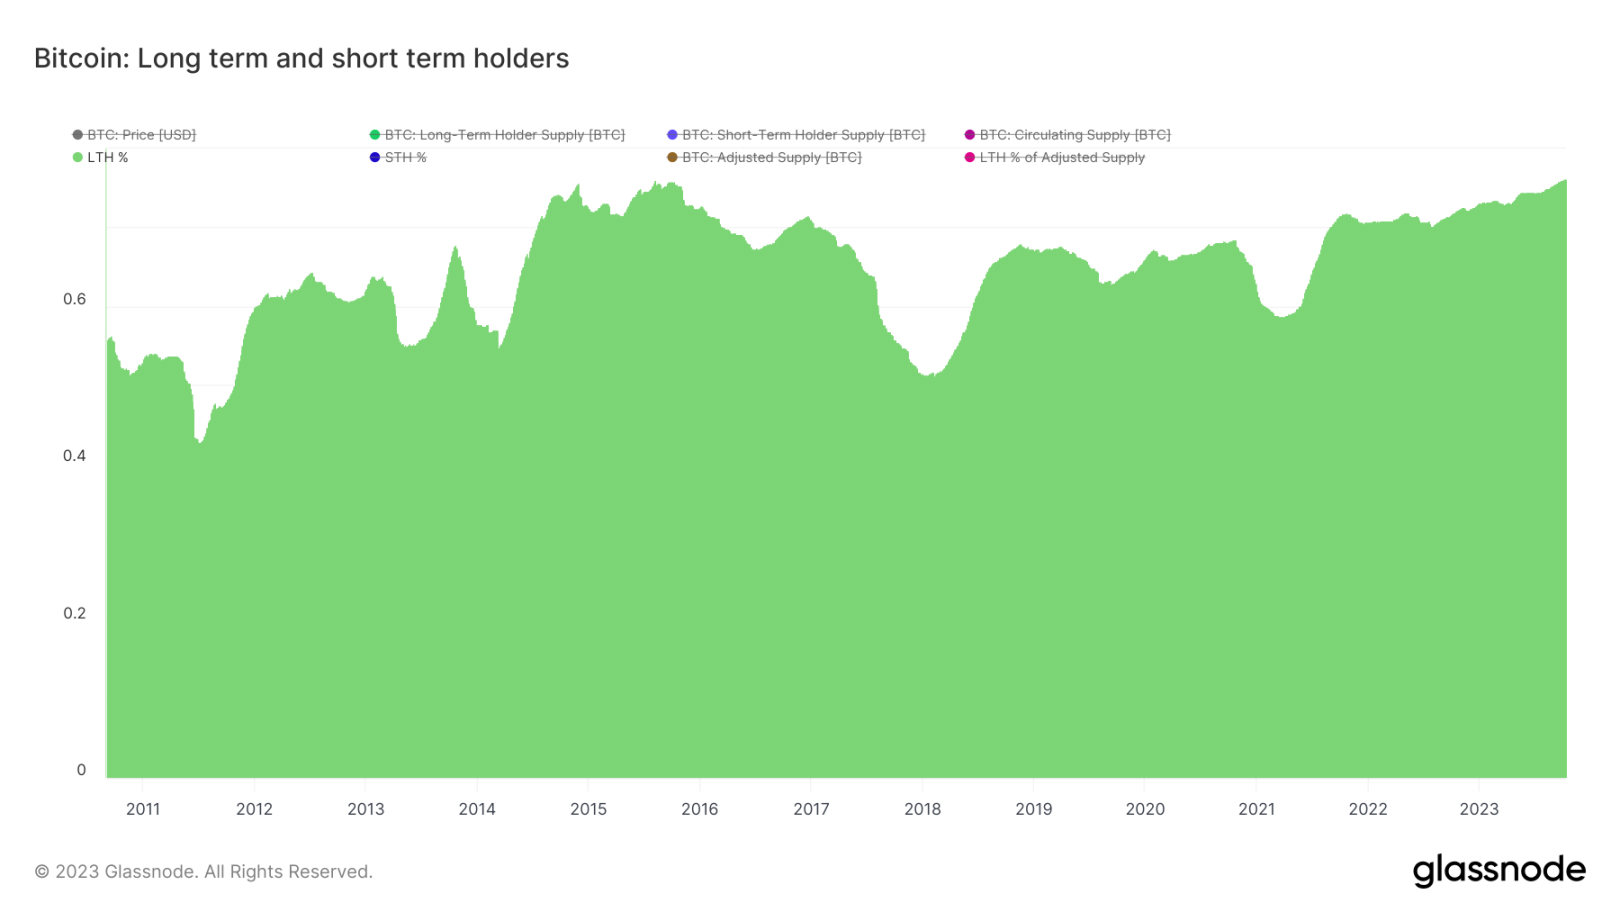
Based on the chart, we can observe the changing trend of Bitcoin supply held by long-term and short-term holders over time. This change reflects the characteristics of Bitcoin market cycles, where long-term investors increase holdings in market downturns, while short-term investors are more inclined to trade during market upswings.
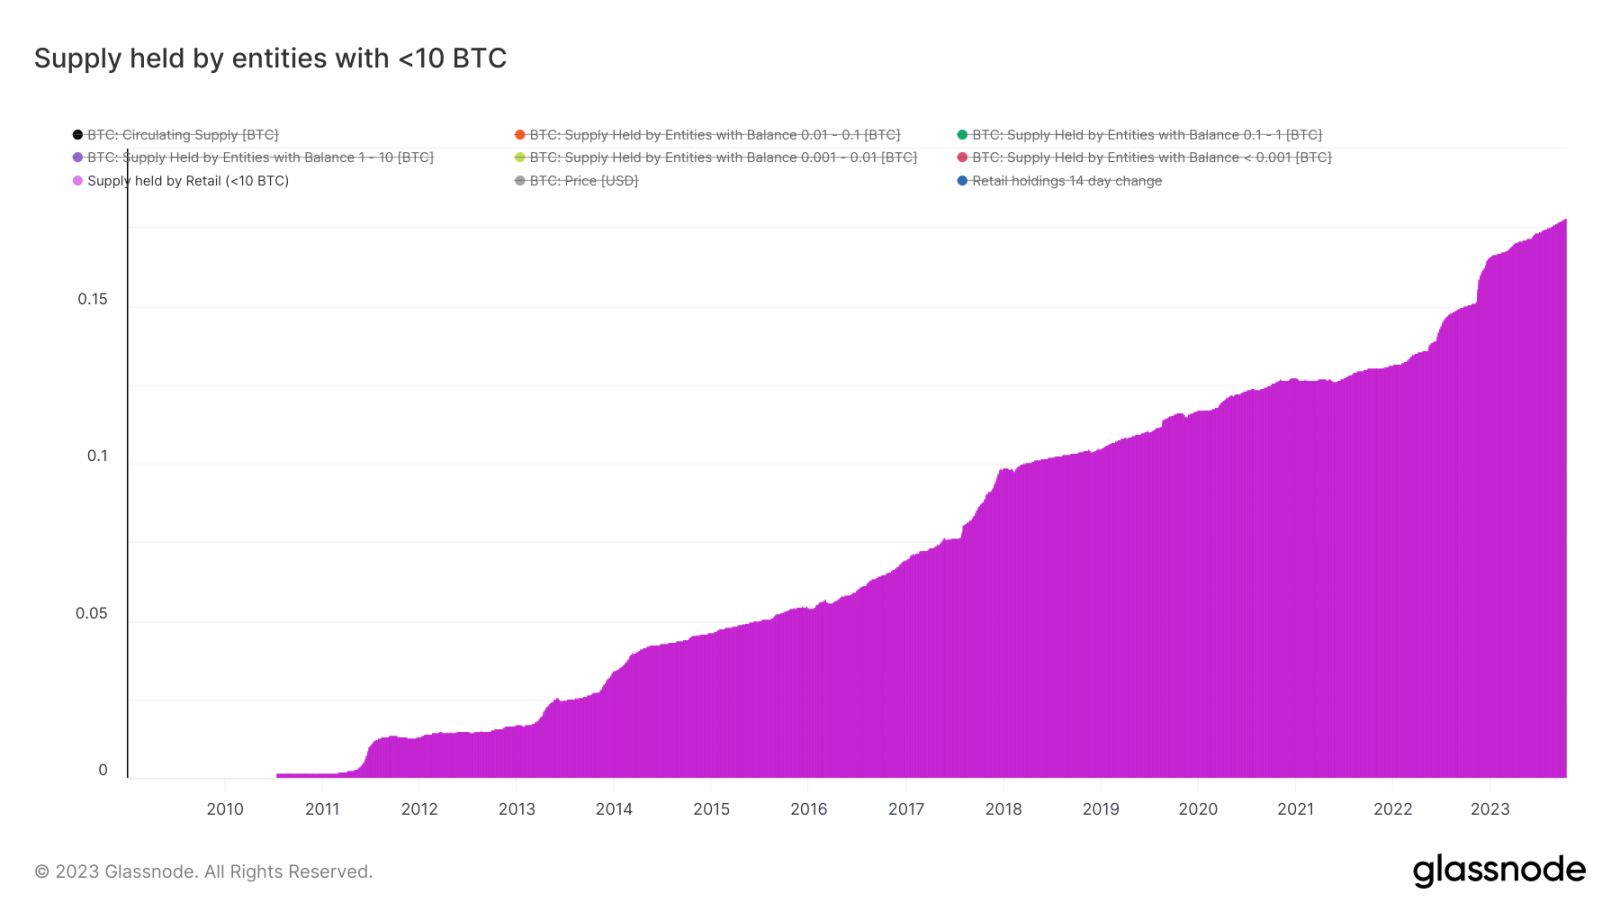
The chart shows that the number of on-chain entities holding less than 10 bitcoins has been consistently increasing throughout Bitcoin's history, especially with significant growth over the past year. This growth trend has continued in the current quarter, exceeding 17.5%. For the distribution of Bitcoin supply, we expect this positive trend to continue.
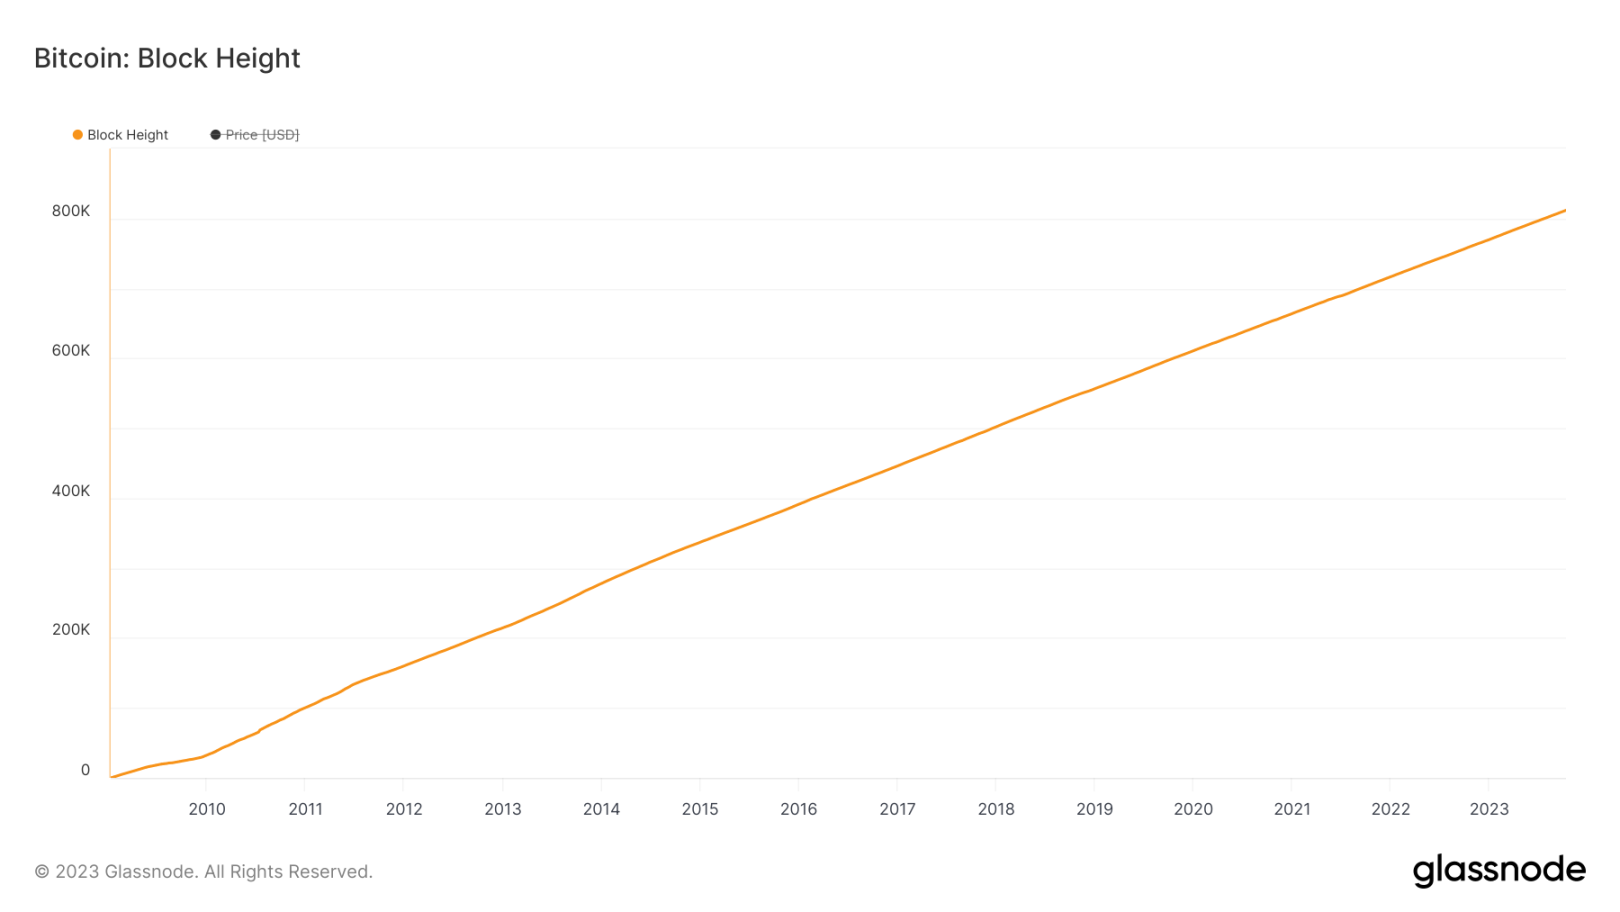
In the third quarter, Bitcoin's block height surpassed the 800,000 milestone, reflecting the normal operation of this decentralized network for over a decade.
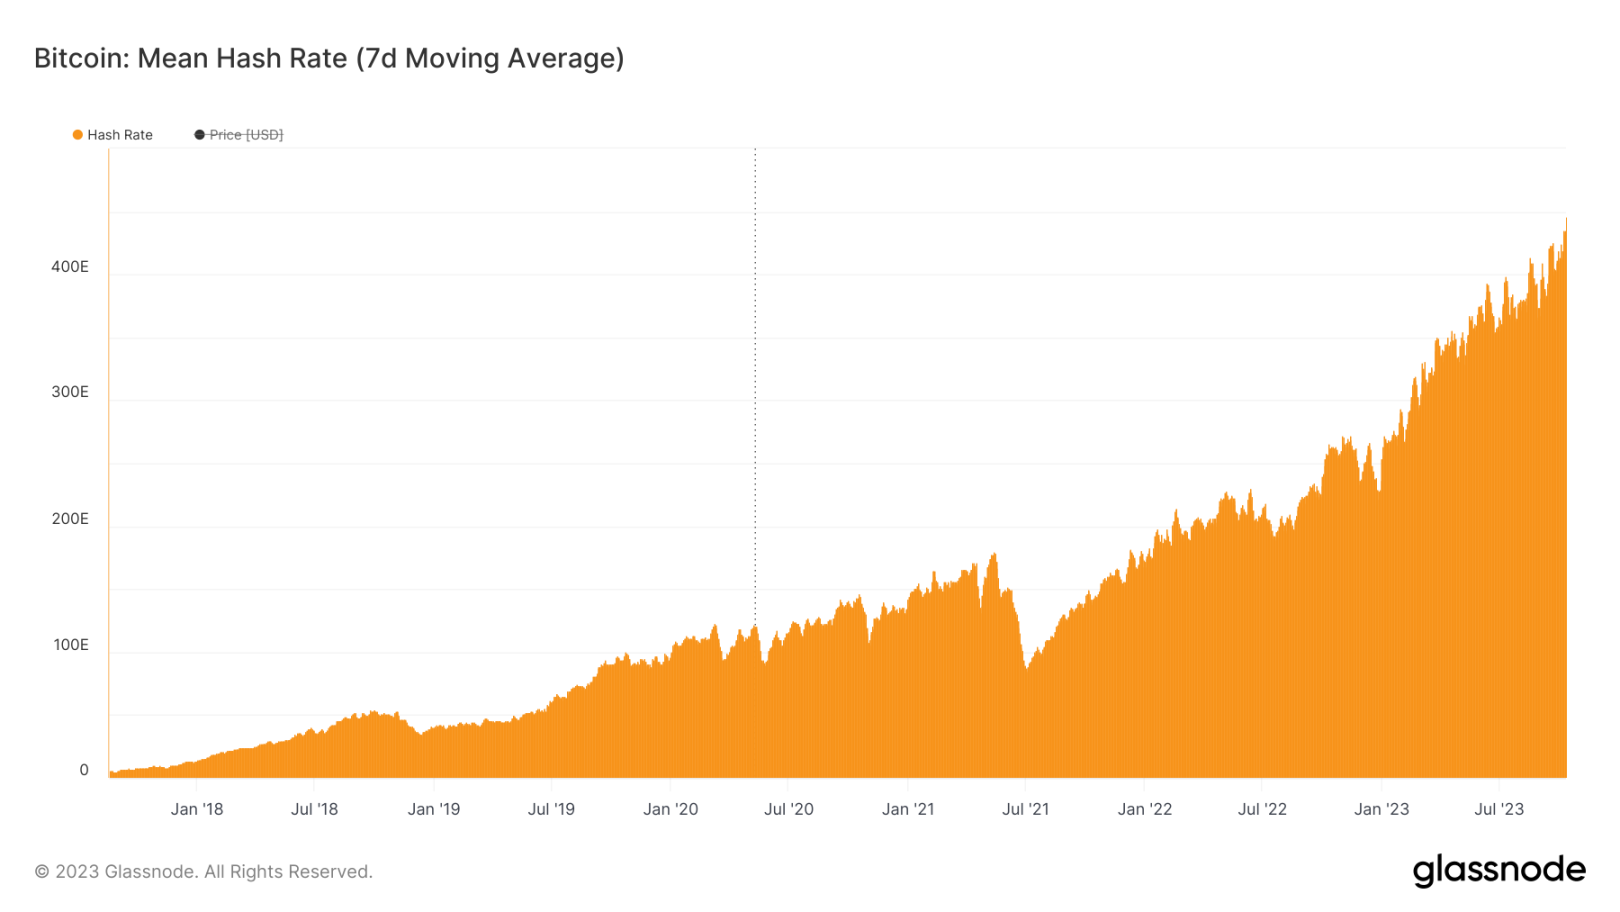
Bitcoin's hash rate also reached a historical high in the current quarter, and with the halving event approaching, increased competition may pose difficulties for miners with uncompetitive energy costs.
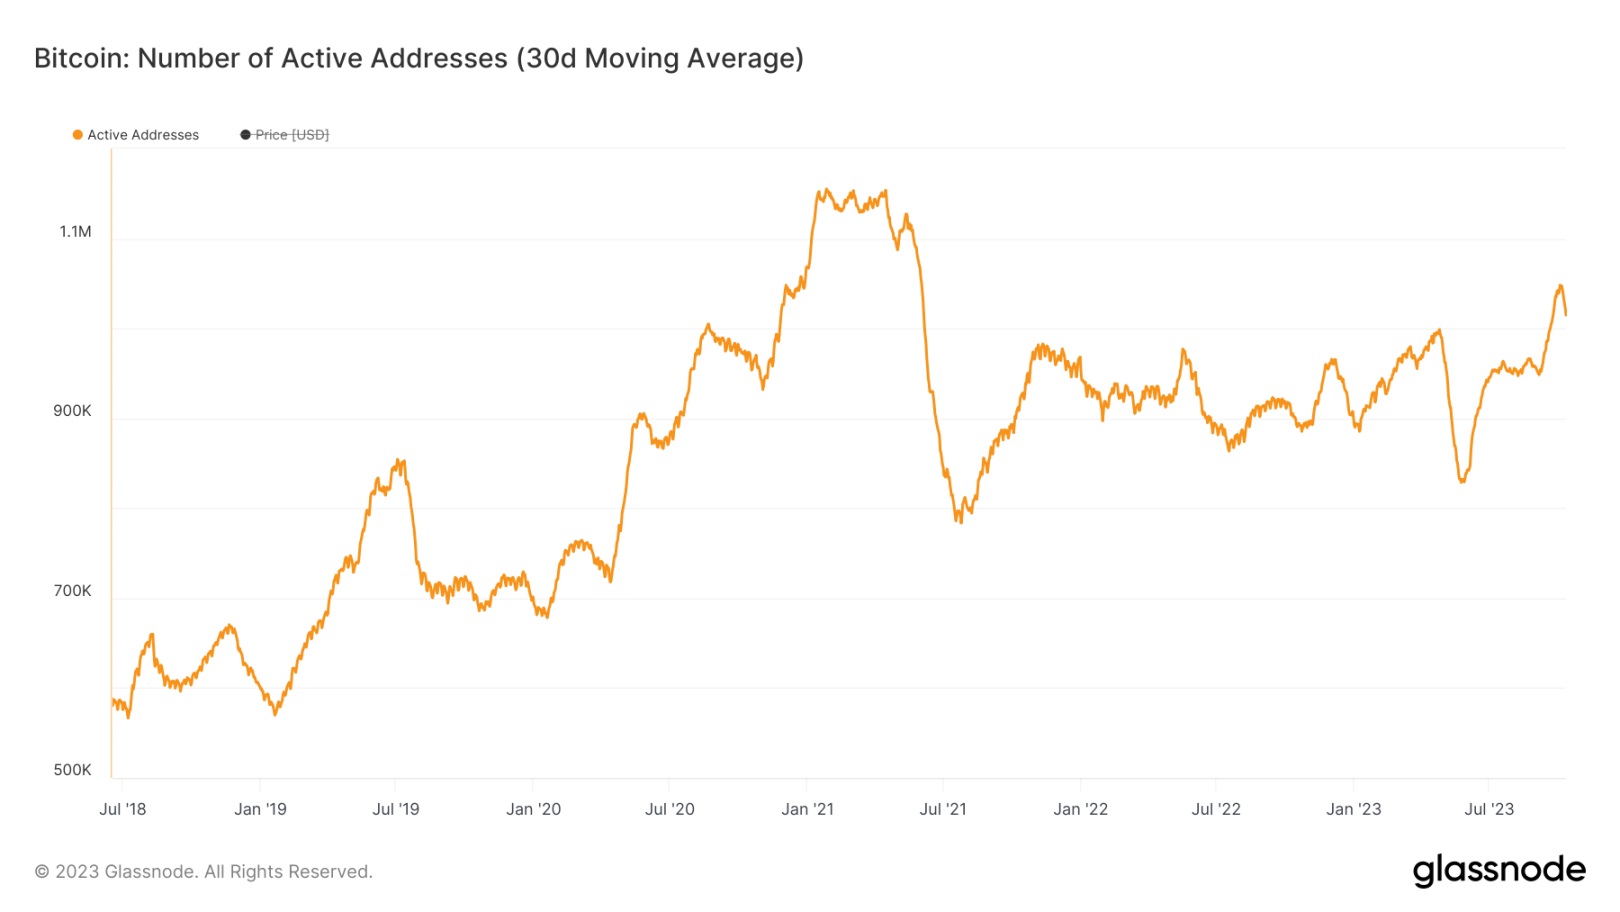
The number of active Bitcoin addresses increased from 950,000 to just over 1 million in the third quarter.
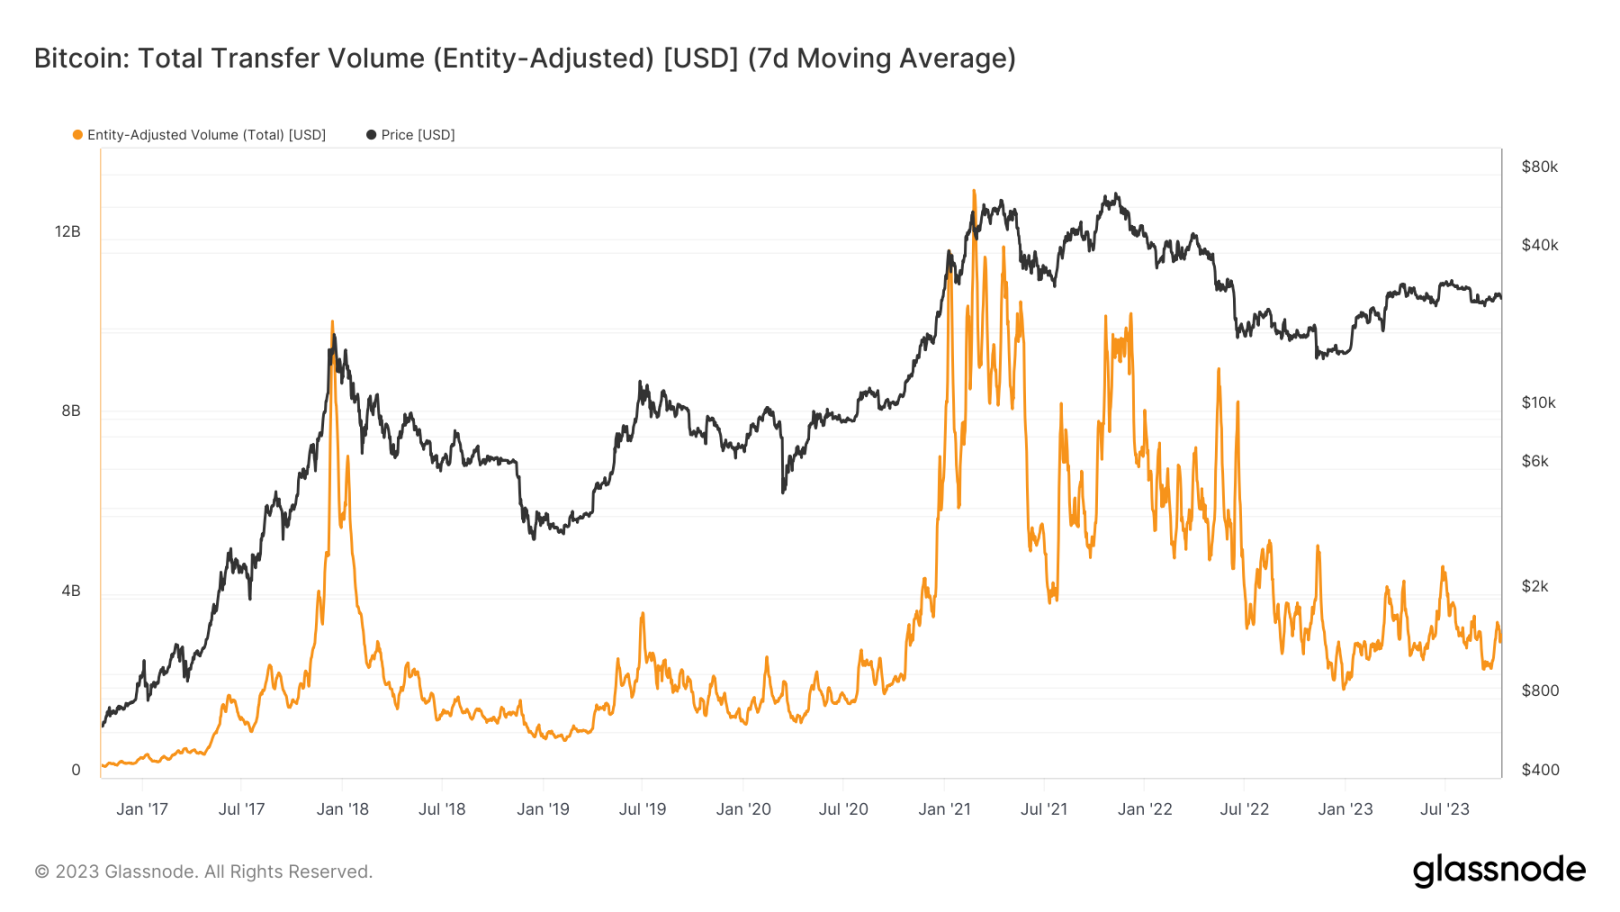
Meanwhile, the 7-day moving average of entity-adjusted transfer volume, as calculated by Glassnode, continues to decline, with the Bitcoin network settling only about $3.1 billion daily.
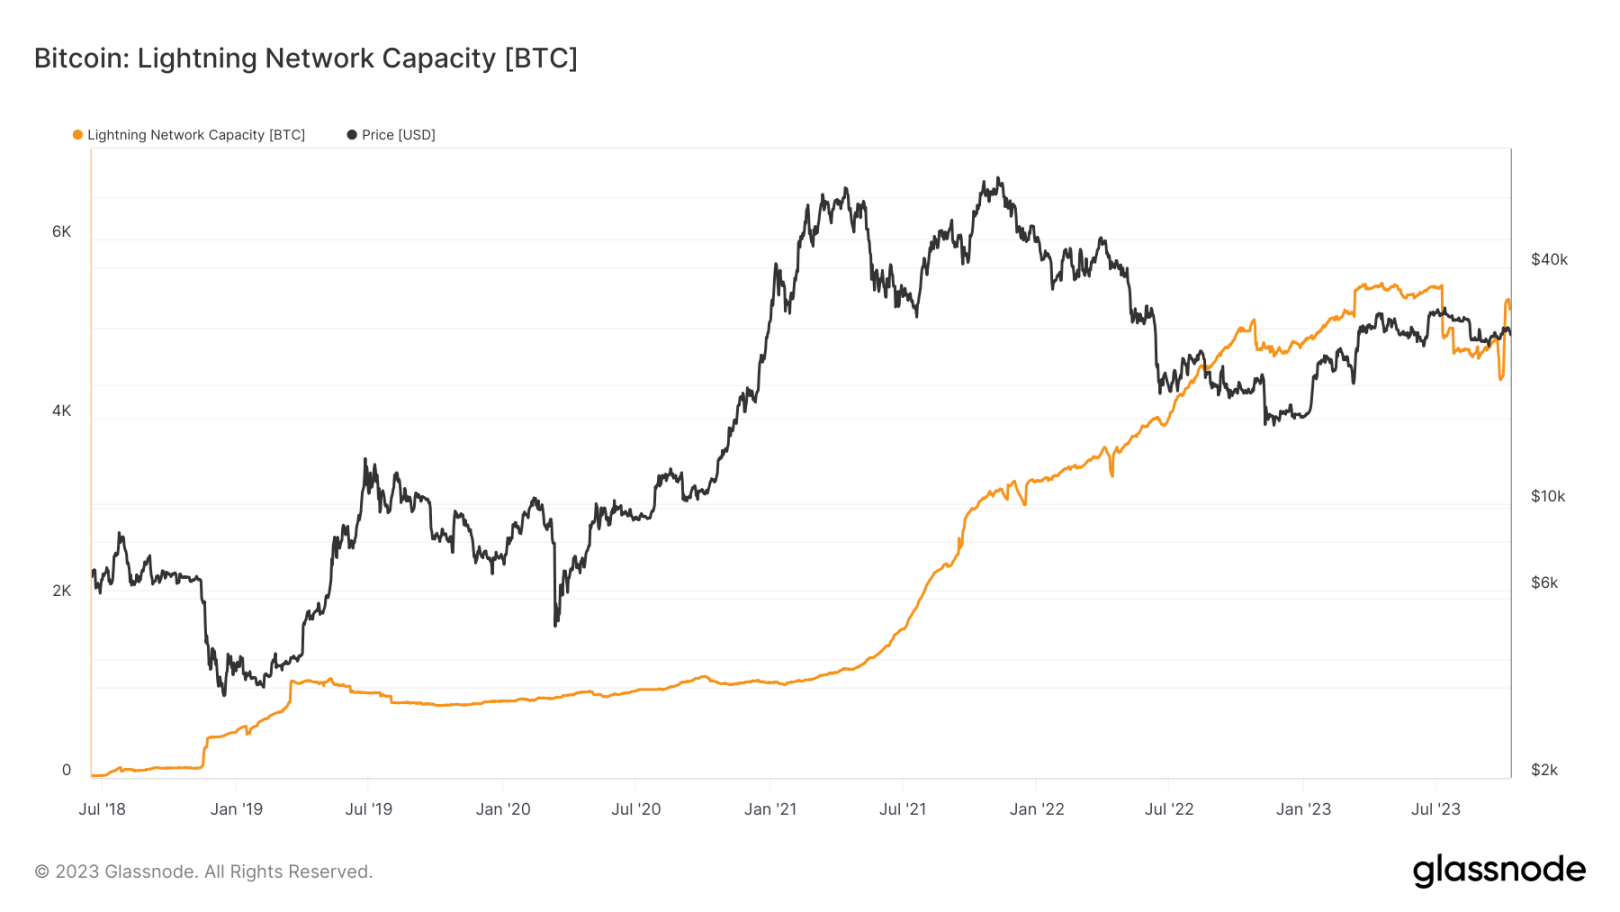
The public Lightning Network capacity of Bitcoin has decreased compared to the peak in July, but has grown in terms of Bitcoin measurement, currently at 5200 BTC. It's worth noting that this is only the public Lightning Network capacity, and actual data may differ.
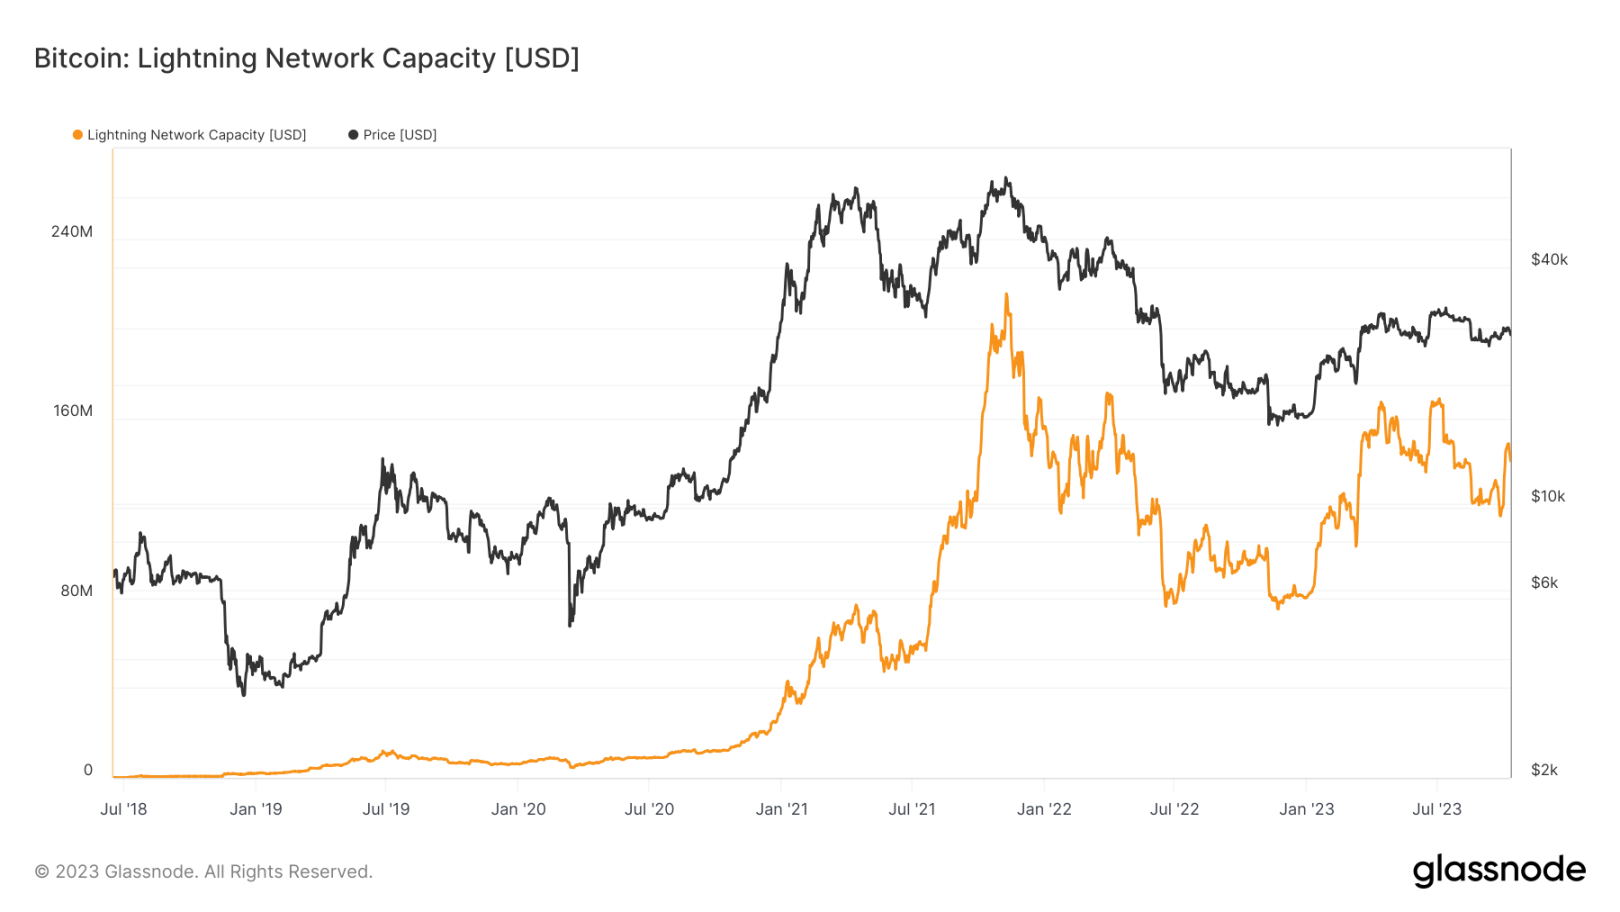
However, the Lightning Network capacity in terms of USD looks less optimistic, decreasing from a peak of $215 million at the end of 2021 to $140 million.
免责声明:本文章仅代表作者个人观点,不代表本平台的立场和观点。本文章仅供信息分享,不构成对任何人的任何投资建议。用户与作者之间的任何争议,与本平台无关。如网页中刊载的文章或图片涉及侵权,请提供相关的权利证明和身份证明发送邮件到support@aicoin.com,本平台相关工作人员将会进行核查。


