1. BTC Market Analysis
Weekly Chart: Bitcoin presented a bullish "one yang piercing three" pattern last week, corresponding to the "one yin piercing three" on August 14, as if it has already recovered from the previous decline. The coin price is still consolidating below the 200-week moving average of 28,000 points. The closing price last week formed a doji, with a lackluster trading volume as both bulls and bears are waiting for a breakthrough. However, the short-term weekly chart of Bitcoin has formed a golden cross above the lifeline, which is a positive signal for an attack. Another logic supporting our bullish view is the golden cross of the KDJ indicator and the appearance of a "shrinking" MACD column above the zero axis, indicating a weakening of bearish strength and a gradual recovery of bullish strength. (27,000 points is the defense of the bulls and cannot be broken)
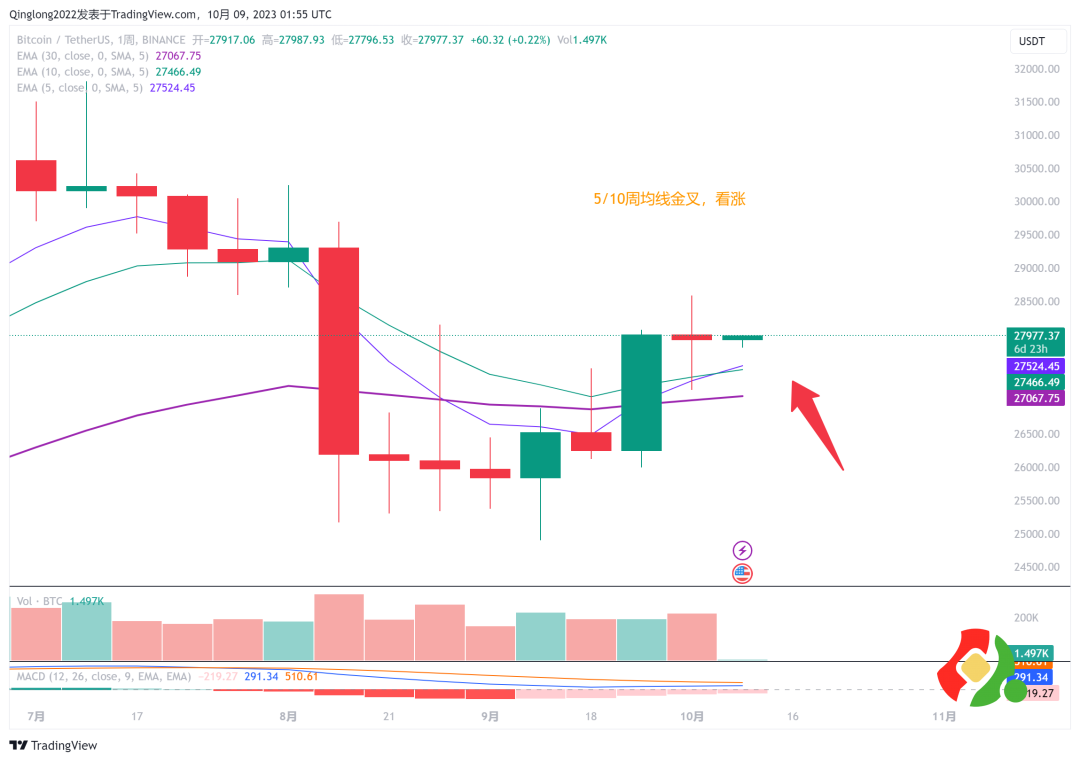
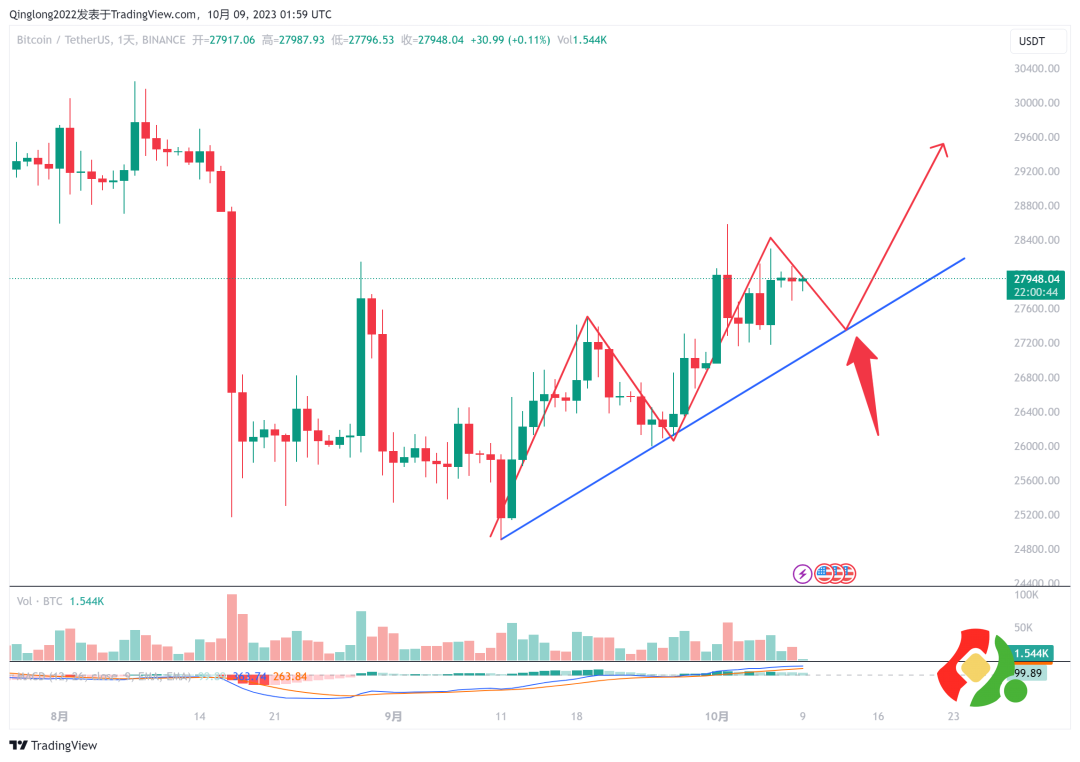
Daily Chart: Yesterday, Bitcoin's closing price remained above the 5-day moving average, but the candlestick formed a doji, indicating relatively light trading. The short and medium-term moving averages are diverging upwards in a bullish arrangement, but there is no trading volume. From a technical perspective, it is still biased towards the bulls in the short term but not very strong, testing the patience of each operator. The support level below is at 27,000 U, and the resistance level above is at 28,500 U. The entry price for Bitcoin in the spot market is 27,500 U, and it can be held, with attention to the volume breakthrough at 28,000 points.
2. ETH Market Analysis
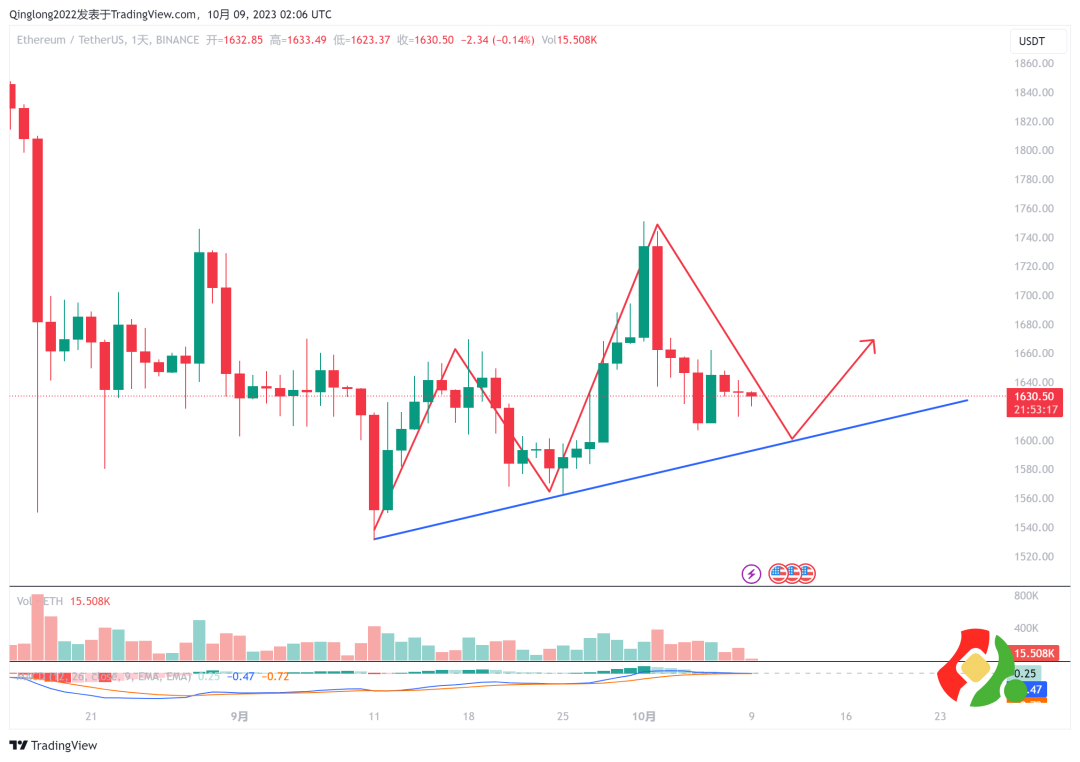
The price trend of ETH is indeed very weak. It is not known what unfavorable news has occurred externally. The weekly chart is tightly suppressed by the 30-week moving average, with support at 1,600 and strong pressure still at 1,745 USD. The support situation of the upward trend line needs to be observed next.
3. Spot Strategy Review
LOOM has already quadrupled from the bottom to the present, belonging to the kind of currency that has risen unnoticed, from 0.11 to 0.19 U, and still looks good for future trends.
The mid-term moving average of TRB is still upward, but there is currently a form of top deviation. Pay attention to the possibility of a short-term pullback, with support at 41.25 U.
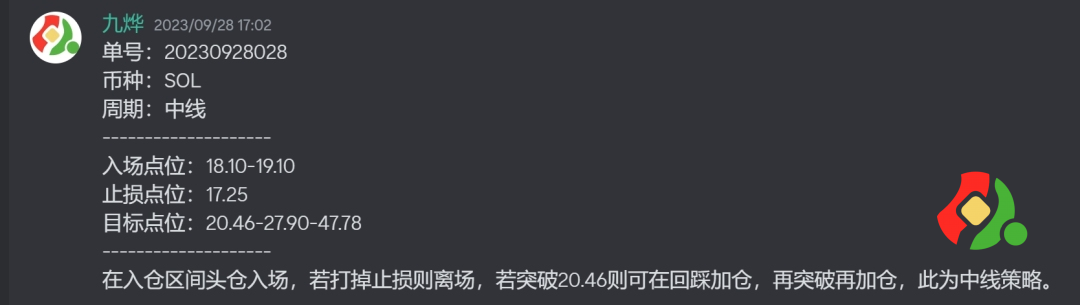
SOL, which entered the spot market in the previous period, is still showing strong performance. We first suggested an entry near 19.1 U, and it has now broken the first target. Since the high on October 1, it has been oscillating with shrinking volume at a relatively high level. If there is an opportunity for a rapid pullback to around 20.6 U, it can continue to be added to the position. The next phase target range is 26.22 U to 27.91 U.
Crypto Academy - Your Intelligent Investment Advisor by Your Side!
免责声明:本文章仅代表作者个人观点,不代表本平台的立场和观点。本文章仅供信息分享,不构成对任何人的任何投资建议。用户与作者之间的任何争议,与本平台无关。如网页中刊载的文章或图片涉及侵权,请提供相关的权利证明和身份证明发送邮件到support@aicoin.com,本平台相关工作人员将会进行核查。


