10/8/Community: Correct Use of Double Needle Top Exploration in Opening Warehouse Skills…
Live broadcast room shares various mainstream technical indicator application methods, as well as daily technical form analysis;


[BTC/4H Chart]
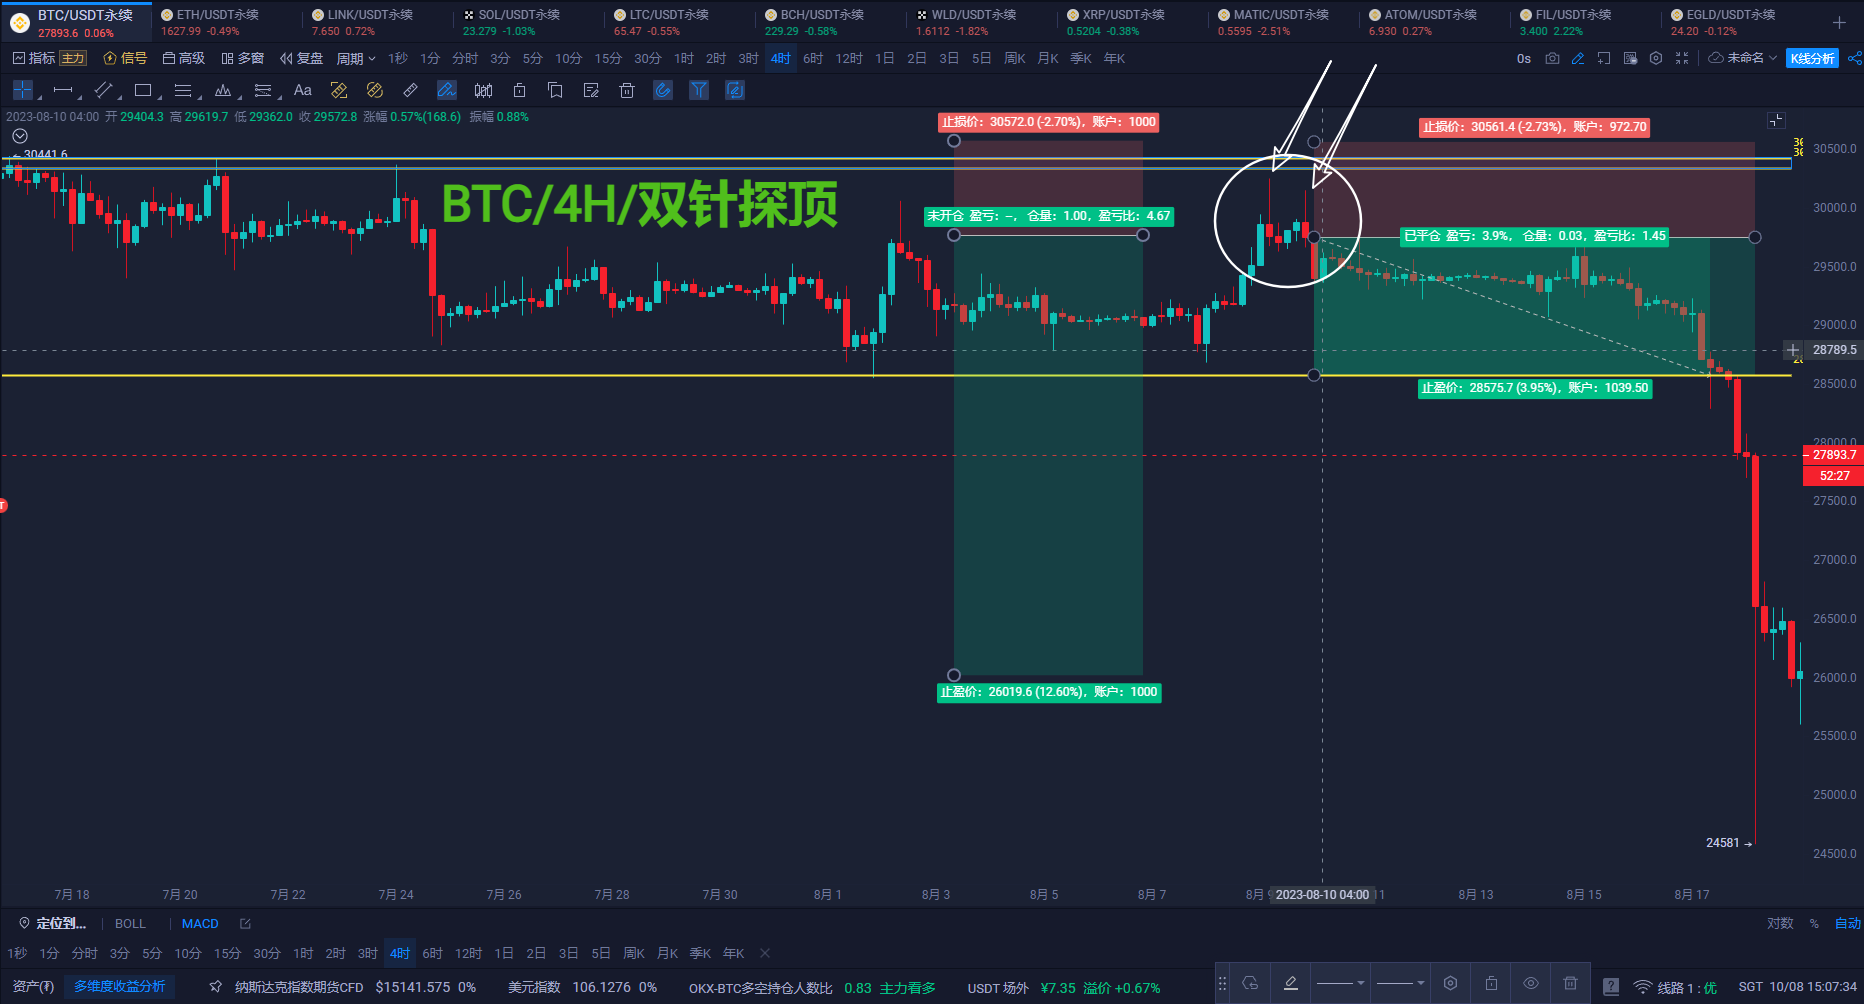
Glossary: The double needle top formation can be felt as "top" between the lines; in technical analysis, it is a short-selling signal for opening positions; the formation of this signal is when the opening price rises to a certain level and then encounters strong resistance from the short side, causing the intraday rise to be suppressed back to near the opening price; the single K generally presents shooting star lines, tombstone lines, and long-legged doji. When these forms are consecutively formed in the closest time period, it is a double needle top exploration signal [more than two needles are called multi-needle top formation], which can capture the opportunity of potential short-selling market; in the review chart, in the first example, during the period from 4 am to 8 pm on August 9, two tests of the strong pressure zone of 30000-30500 were respectively encountered, and a standard double needle top exploration signal was formed, followed by a weakening trend; after breaking through 28500, the price began to accelerate downward, reaching a low of 24580, with a maximum decline of 17.4% after the formation of this signal.
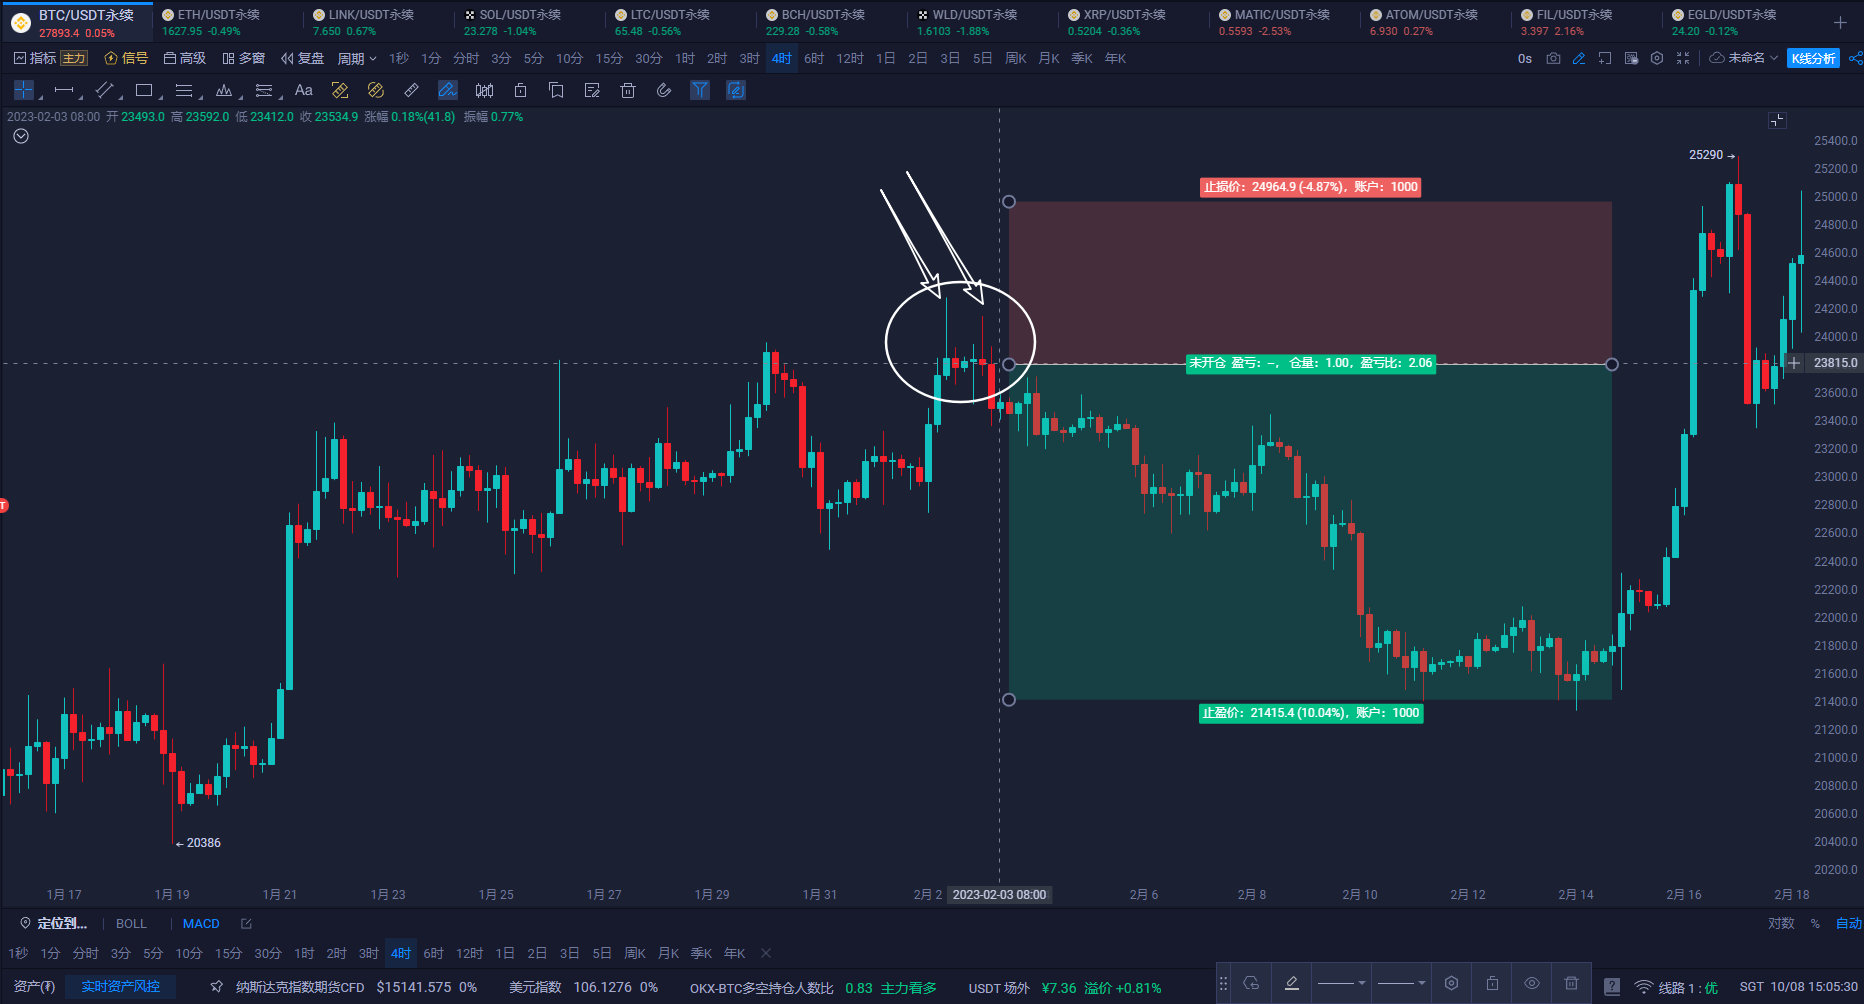
In the second example, from 8 am on February 2 to 12 am on the 3rd, two tests of 24000-24500 were met with strong resistance from the short side, leading to a two-stage oscillating decline in the short-selling market; after the formation of this signal, the price dropped from 23800 to 21300, with a maximum decline of 10%; the above two examples indicate that the market's rise and fall can be foreseen in advance; mastering these basic trading skills will be of great help to everyone on the trading path; today's sharing ends here; more practical cases will be shared in our live broadcast room!
I hope today's article sharing will be helpful to everyone; I wish everyone a better and better performance in the trading field!

Recommended Approach [No advice]
Support/Resistance
Tencent Meeting ID: 565-877-8060
Seven live broadcasts daily: 11:00-21:30 uninterrupted

[Liejinshe] What can you get from the Elite Class???
1. Get midday videos at the first time//2. Get market intraday views at the first time
3. Get short, medium, and long-term strategies at the first time//4. Track and guide the strategy throughout
5. Have the opportunity to participate in exclusive midnight battles//6. Have the opportunity to participate in million-level courses
[Efficient. Accurate. Capturing Breakthrough Trading Opportunities]

2022 Annual Strategy Guidance Record
February-December 2022///10 wins 1 loss
February complete/return rate 2500%///March complete/return rate 2500%
April complete/return rate 2626%///May complete/return rate 3698%
June complete/return rate 3081%///July complete/return rate 7033%
August complete/return rate 4694%///September complete/return rate 5046%
October complete/return rate 1438%///November complete/return rate 2362%
December complete/return rate -474%///
February-December 2022 complete total return rate 34504%
Single margin 100U calculation*34504%=34504U
Each strategy//has evidence and traces, can be traced back to the start time to the year, month, day, hour, minute, second, and retained in both text and image. Interested parties can scan the code to join the group for verification!!


(Scan the code to follow the official account and experience more services)
免责声明:本文章仅代表作者个人观点,不代表本平台的立场和观点。本文章仅供信息分享,不构成对任何人的任何投资建议。用户与作者之间的任何争议,与本平台无关。如网页中刊载的文章或图片涉及侵权,请提供相关的权利证明和身份证明发送邮件到support@aicoin.com,本平台相关工作人员将会进行核查。