Solana (SOL) has recently traded steadily, maintaining below $20.5.
Long-term forecast: Tending towards bearish
Since September 5, Solana has faced resistance at $20.5 and pressure from support at $19 on September 21. The current price is between moving averages, but the $19 support remains stable. When the moving average is broken, the cryptocurrency price will change. The current support is in the oversold market area, and we expect buyers to emerge in the oversold area and push the price higher. If buyers can keep the price above the 50-day moving average, Solana will resume its upward trend.
Solana price indicator analysis:
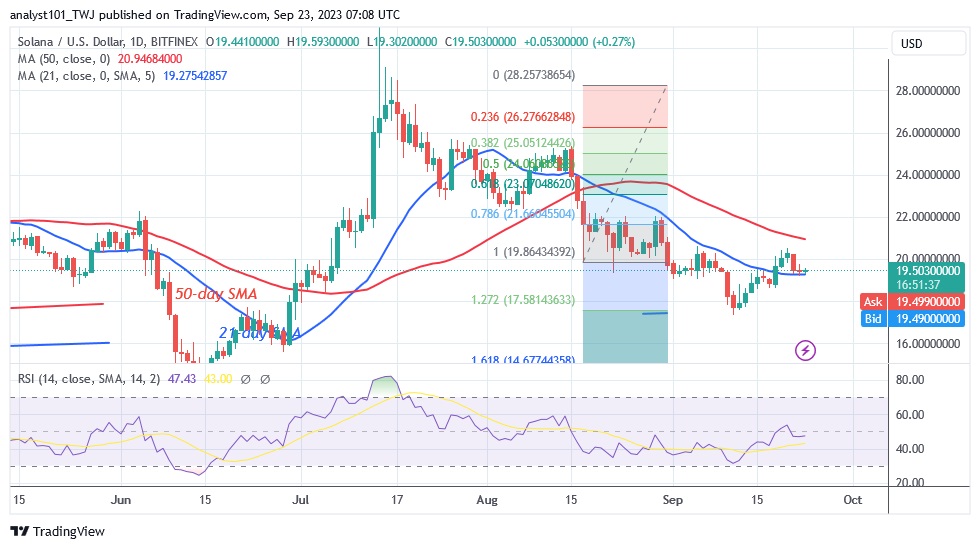
Solana's relative strength index (RSI) has entered a downward trend, at 47, indicating that the cryptocurrency may have risen too quickly or too high, and the market may experience a pullback or decline. As this cryptocurrency trades between moving averages, it will be forced to remain within the trading range as long as it remains in the bearish trend zone. The cryptocurrency has already traded in the oversold area of the market and is below the 20 value of the daily stochastic indicator.
Technical indicators:
Key supply zones: $20, $25, $30
Key demand zones: $10, $5, $1
Future trend of Solana:
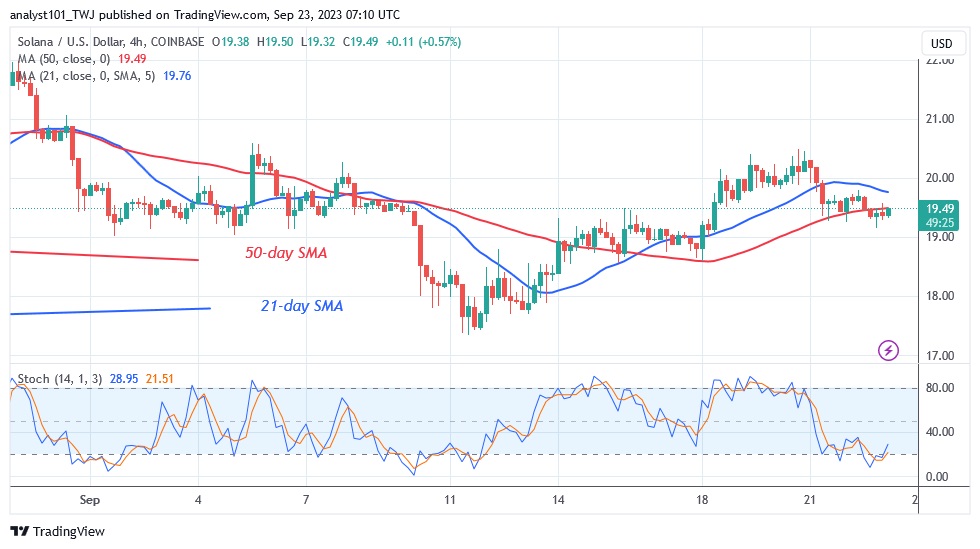
Solana is currently trapped between moving averages and trading above the $19 support. If the bear market breaks the $19 support or the 21-day moving average, the cryptocurrency will face downside risk. Meanwhile, due to trading between moving averages, the price movement is restricted.
免责声明:本文章仅代表作者个人观点,不代表本平台的立场和观点。本文章仅供信息分享,不构成对任何人的任何投资建议。用户与作者之间的任何争议,与本平台无关。如网页中刊载的文章或图片涉及侵权,请提供相关的权利证明和身份证明发送邮件到support@aicoin.com,本平台相关工作人员将会进行核查。


