Charts
DataOn-chain
VIP
Market Cap
API
Rankings
CoinOSNew
CoinClaw🦞
Language
  • 简体中文
  • 繁体中文
  • English
Leader in global market data applications, committed to providing valuable information more efficiently.

Features

  • Real-time Data
  • Special Features
  • AI Grid

Services

  • News
  • Open Data(API)
  • Institutional Services

Downloads

  • Desktop
  • Android
  • iOS

Contact Us

  • Chat Room
  • Business Email
  • Official Email
  • Official Verification

Join Community

  • Telegram
  • Twitter
  • Discord

© Copyright 2013-2026. All rights reserved.

简体繁體English
|Legacy

When was the daily candlestick pattern of Da Bing's peak established?

CN
缠兴荟小管家
Follow
2 years ago
AI summarizes in 5 seconds.

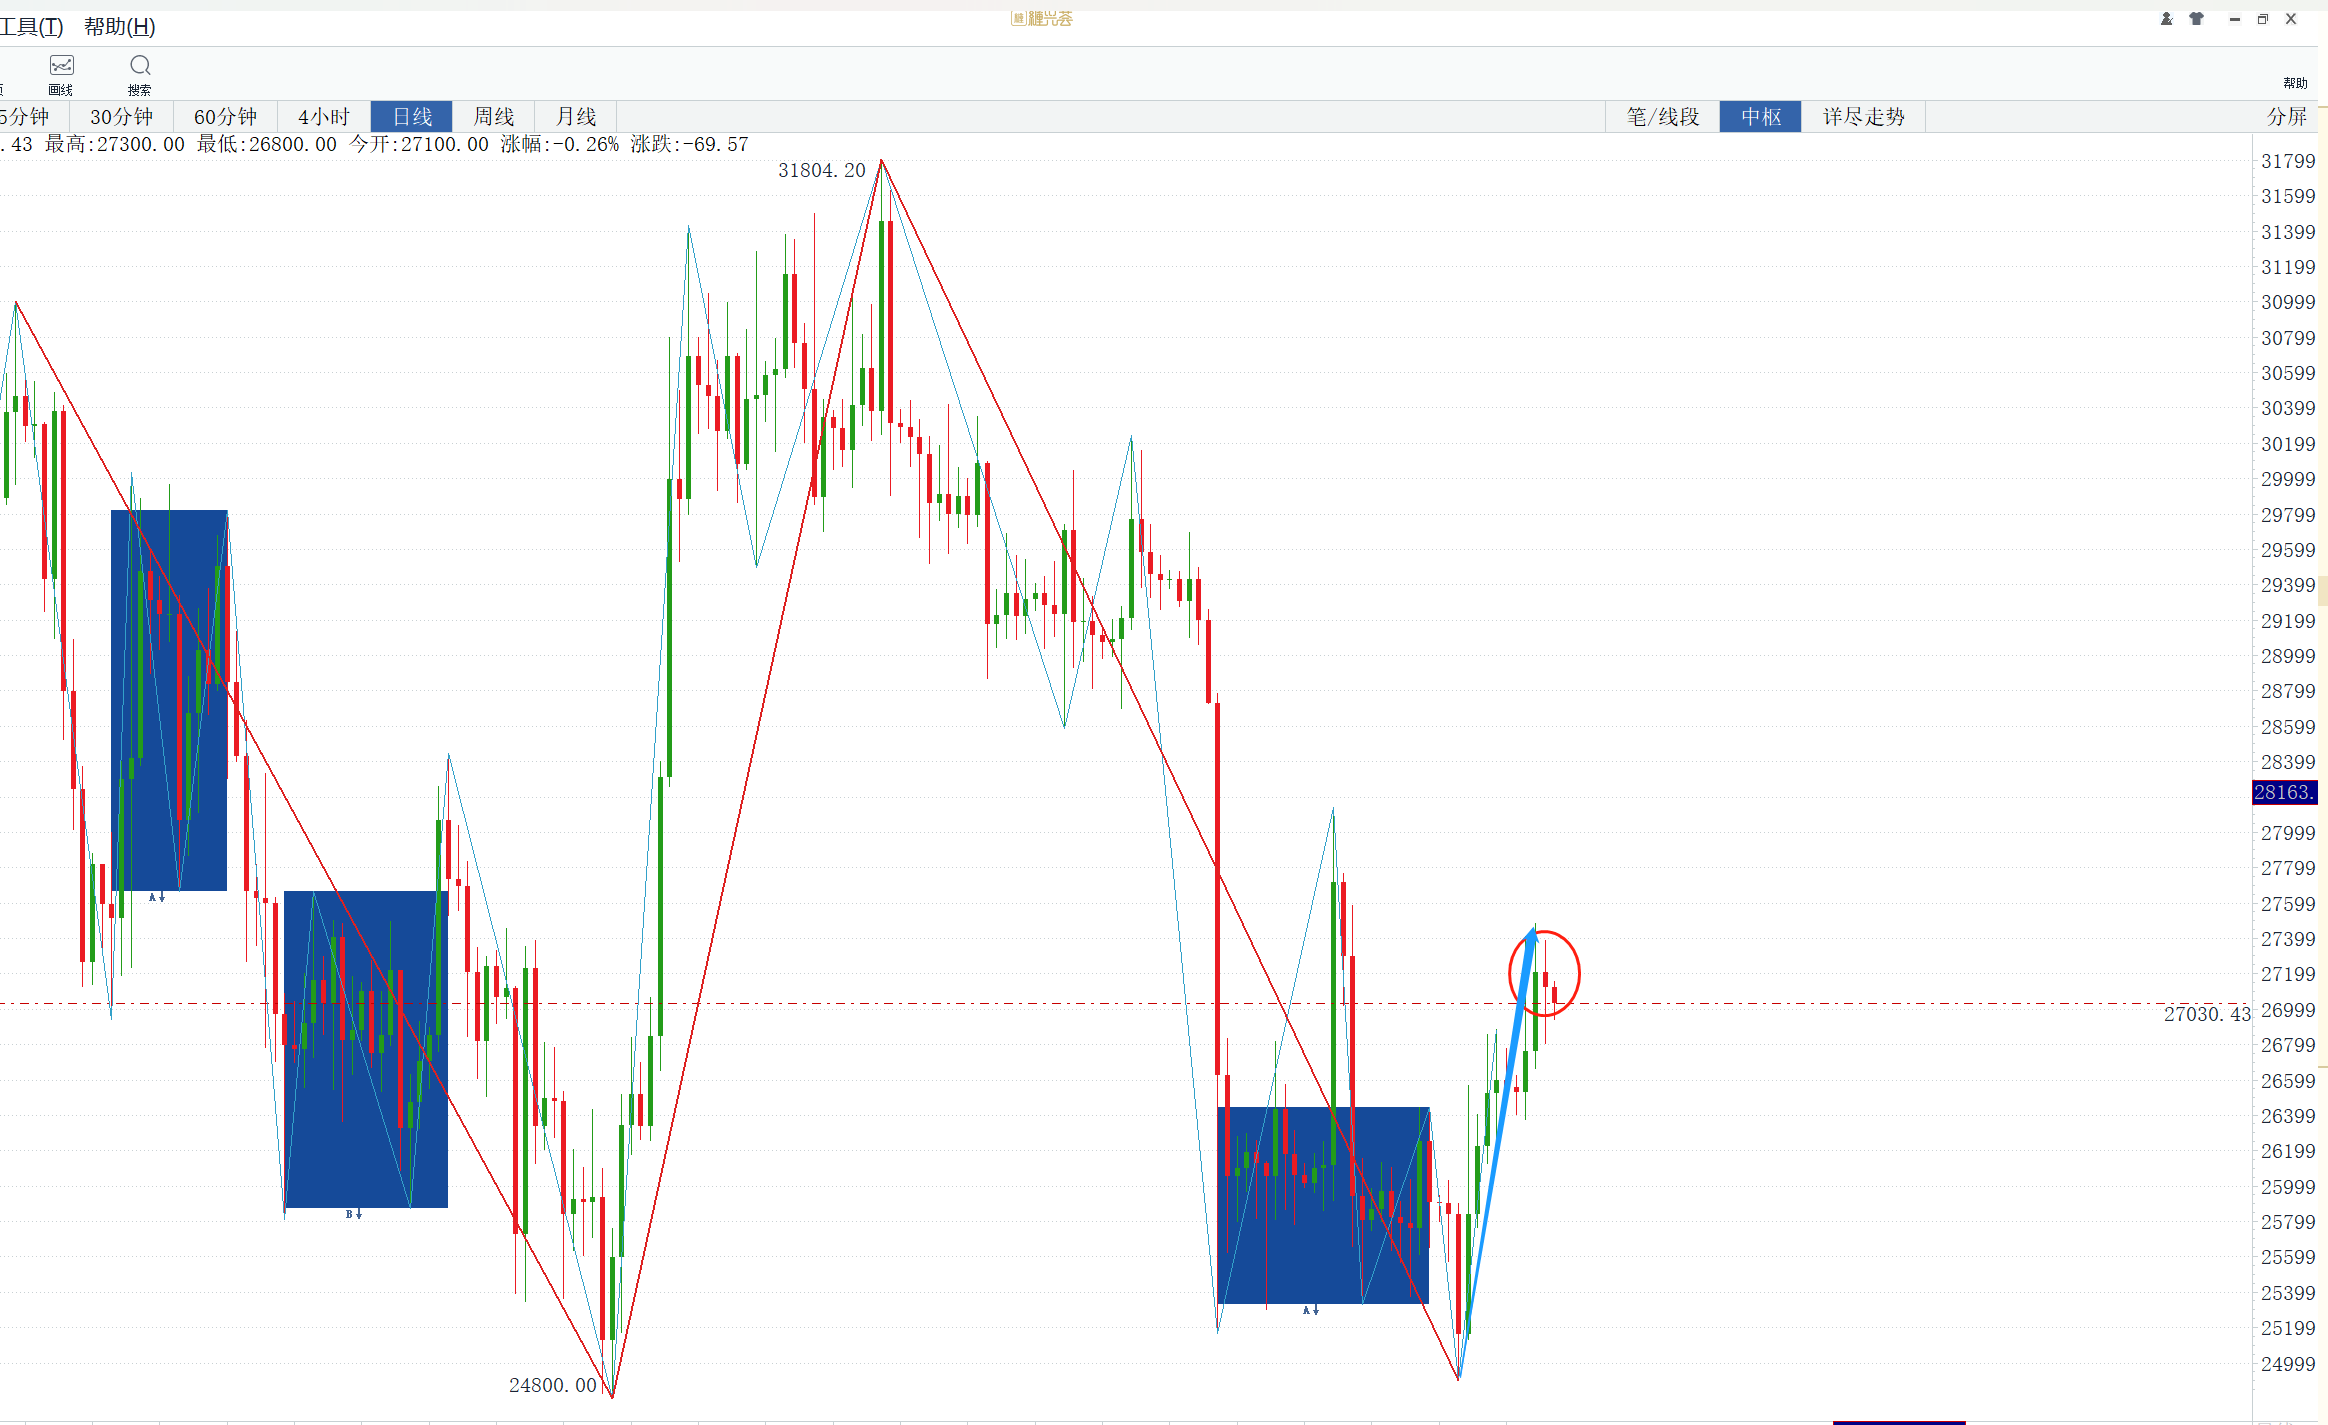
Let's start by looking at the daily chart on the surface. Currently, there is no apparent top distribution in the upward trend, so there is no signal of termination for this trend for now. We need to closely monitor when the top distribution in this trend will be established, as only when the top distribution is confirmed can the trend possibly come to an end.

Chart 1

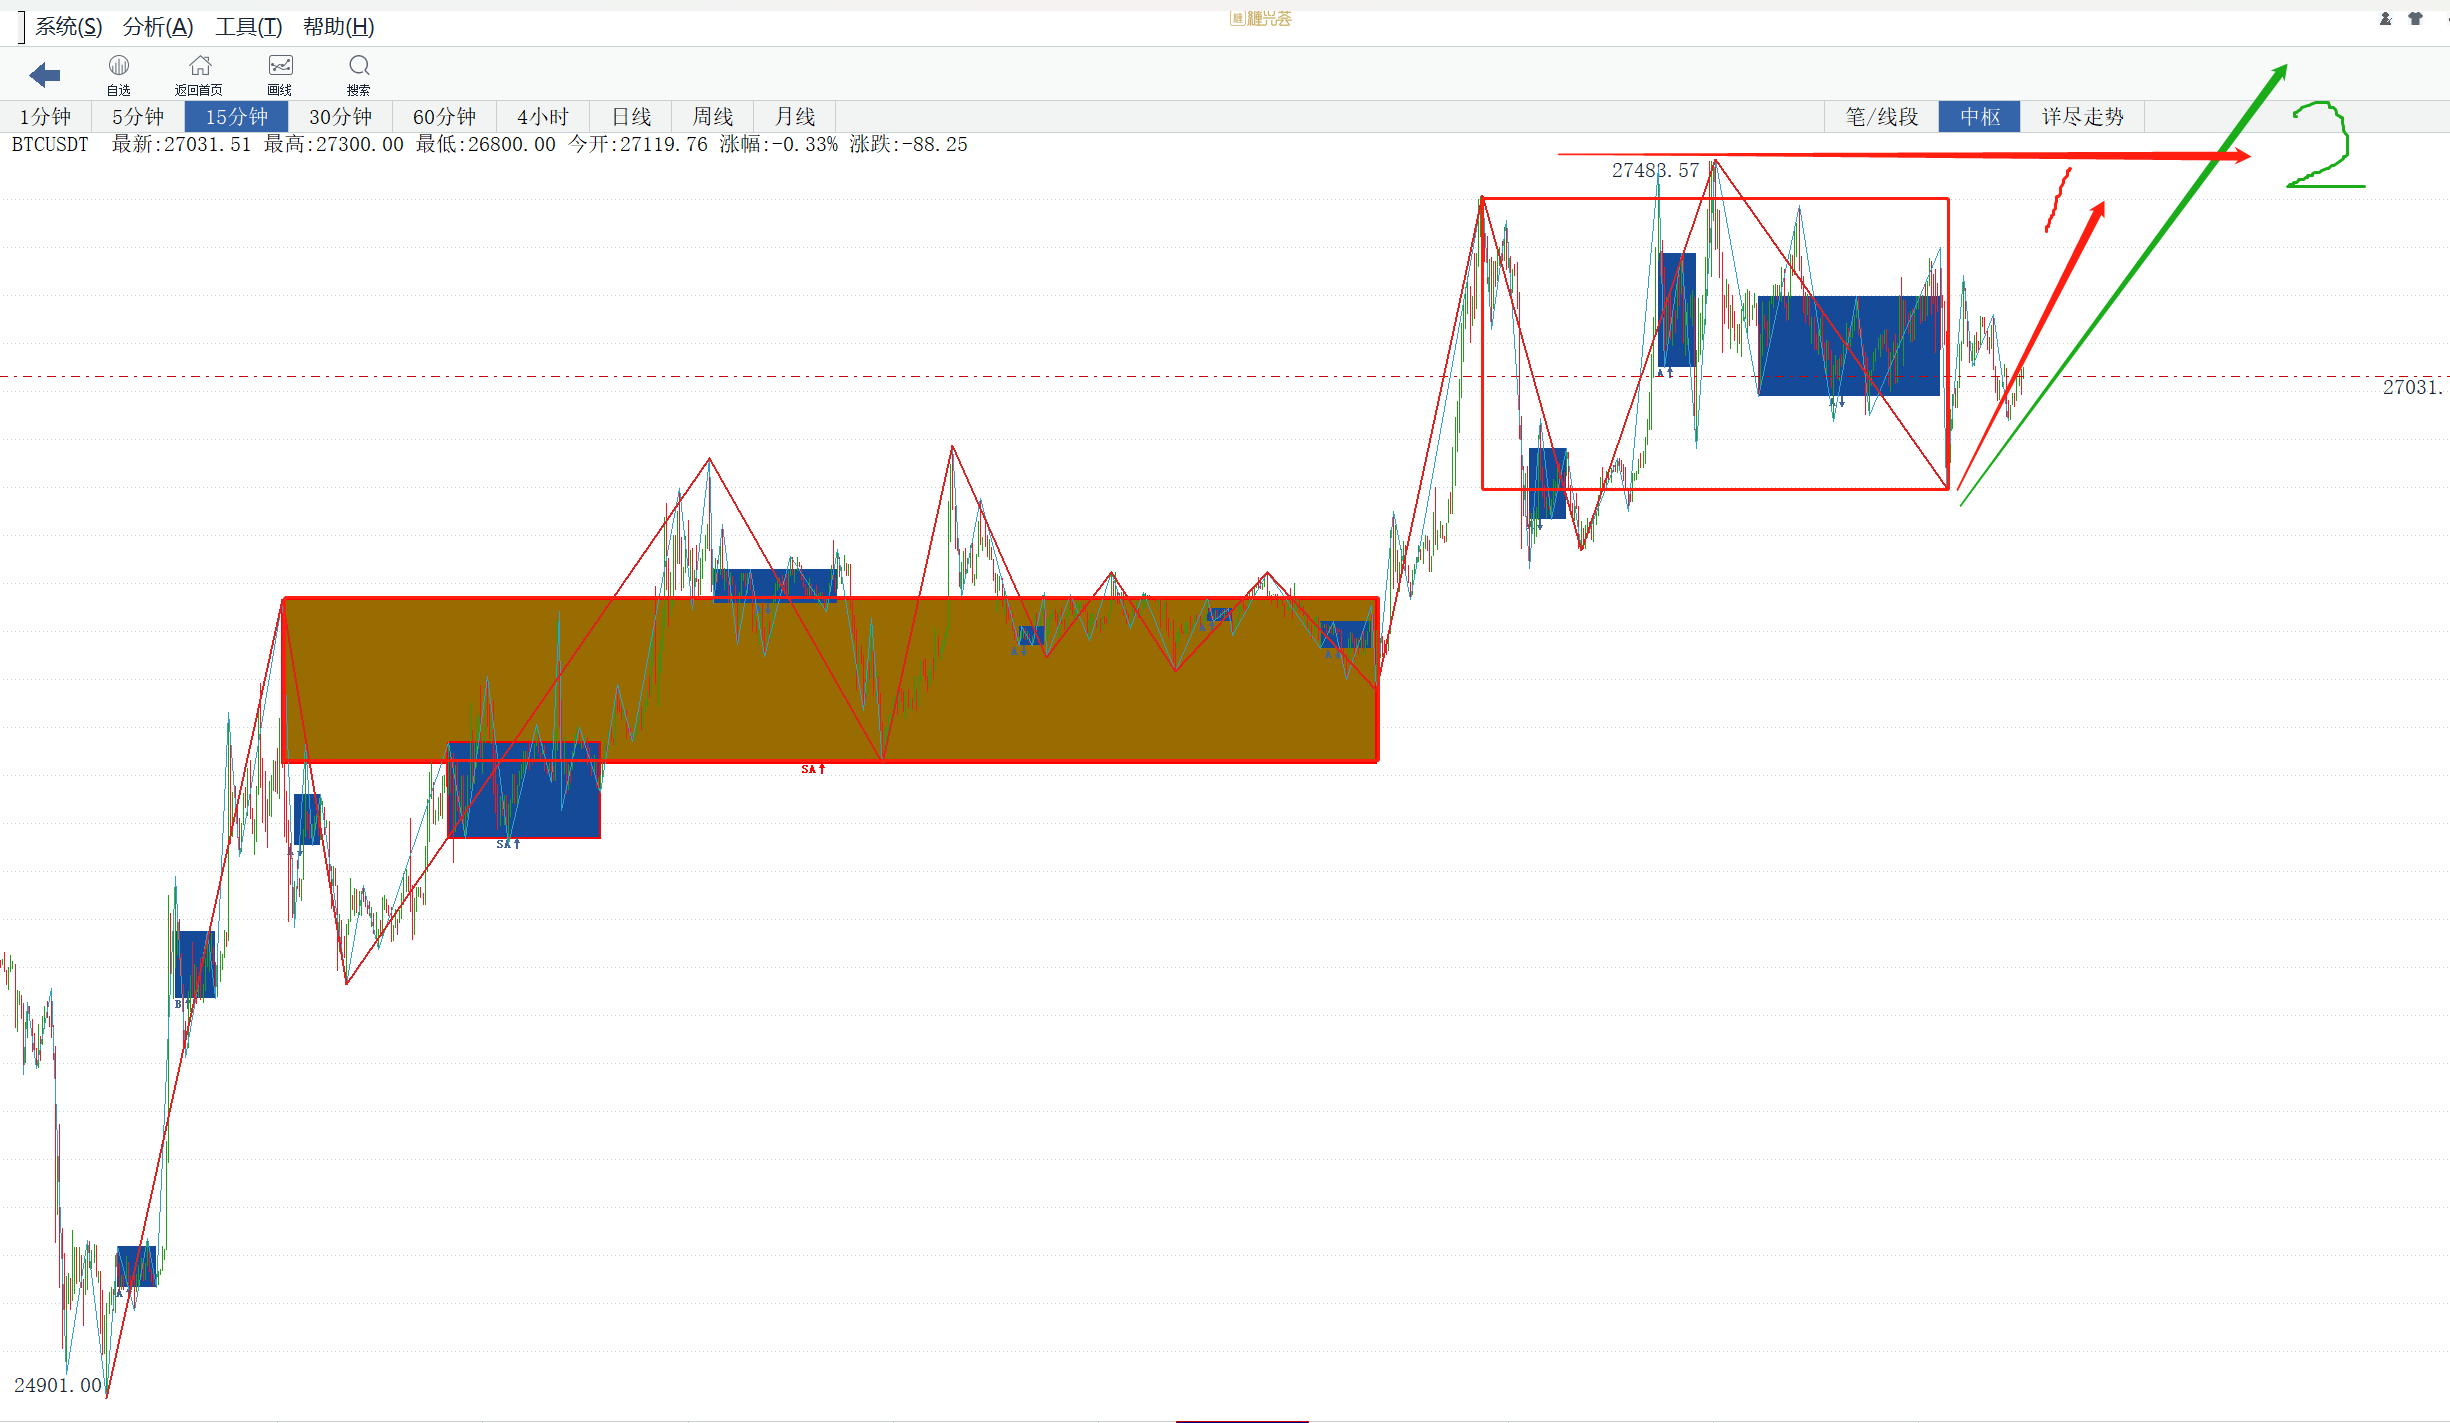
Continuing to observe on a smaller time frame using the range trap:

On the 15-minute chart, the second center is being constructed. We need to pay attention to the strength of the current upward movement.

  1. In the red trend, if a new high cannot be reached, beware of a sell signal. Reduce long positions and layout short positions here.
  2. In the green trend, if the bulls break the new high with strength, then observe for signs of bearish divergence. If there is bearish divergence, continue to reduce long positions to prevent the termination of the 15-minute trend type.

Of course, the strongest scenario is breaking the new high without bearish divergence. In this case, long positions should be held first to observe the subsequent trend development.

According to the principles of the "Chande Kroll" theory, we do not make predictions, only classify the current trend and make contingency plans. Completely follow and respond accordingly.

Chart 2

免责声明:本文章仅代表作者个人观点,不代表本平台的立场和观点。本文章仅供信息分享,不构成对任何人的任何投资建议。用户与作者之间的任何争议,与本平台无关。如网页中刊载的文章或图片涉及侵权,请提供相关的权利证明和身份证明发送邮件到support@aicoin.com,本平台相关工作人员将会进行核查。

唯一支持期权 AI 交易的工具就在OKX
广告
|
|
APP
Windows
Mac
Share To

X

Telegram

Facebook

Reddit

CopyLink

|
|
APP
Windows
Mac
Share To

X

Telegram

Facebook

Reddit

CopyLink

Selected Articles by 缠兴荟小管家

2 years ago
Detailed analysis of BTC0919: Following the structure and strength of the 30-minute pullback.
2 years ago
The 4-hour head and shoulders pattern has formed, signaling exhaustion for the bulls.
2 years ago
Looking to go long after a 30-minute downward trend line is broken today.
View More

Table of Contents

|
|
APP
Windows
Mac
Share To

X

Telegram

Facebook

Reddit

CopyLink

Related Articles

avatar
avatar老崔说币
2 hours ago
Lao Cui says: Will BTC face an epic level crash? The outcome of the US-Iran conflict determines the fate!
avatar
avatar币圈院士
2 hours ago
Cryptocurrency Scholar: Why will Ethereum head south on March 29? Precisely hitting the downward trend from 2380 to 2000! Latest market analysis and thought reference.
avatar
avatar青岚加密课堂
5 hours ago
Extreme Fear 9! Is the BTC rebound coming? 3/29
avatar
avatar币圈伟泽
7 hours ago
Mr. Coin: 3.29 Ethereum ETH Today's Latest Trend Analysis and Forecast. Includes Trading Strategy.
avatar
avatar币圈伟泽
7 hours ago
Mr. Coin: Analysis and prediction of today's latest trend of 3.29 Bitcoin BTC. Includes trading strategies.
APP
Windows
Mac

X

Telegram

Facebook

Reddit

CopyLink