Market laws, twists and turns, cycles of change, inner cultivation, external practice, the road ahead is long. Doubt can filter risks, but it can also lead to missed opportunities. To seize opportunities, one must be brave enough to try. Different attitudes towards life yield different results. Without great ambitions, even with the help of influential people, one will ultimately achieve little. Countless difficulties are not insurmountable. The success story of an investor is actually a history of learning and growth. Through hardships and scenery, never forget the original intention, and one will eventually succeed.

2023.9.19 BTC——————
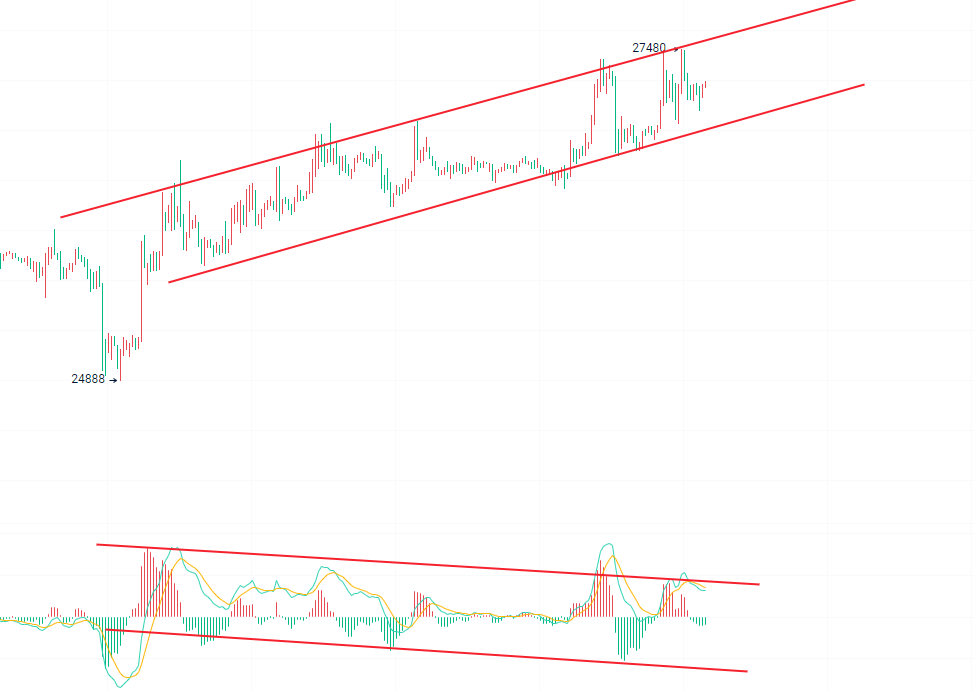
Bitcoin's daily chart continues to rise, with the moving average support moving up to 26600. The KDJ indicator on the attached chart continues to diverge at high levels, and the Bollinger Bands are gradually widening. 26100 is the support level for the current bullish momentum. The daily chart shows some weakness in the bullish trend, reaching oversold conditions. In the short term, the price is maintaining an upward trend within the channel, with the support level at 26880. The MACD indicator on the attached chart shows multiple bullish volume contractions, and the KDJ shows signs of cohesion around 65. Overall, the four-hour chart tends to show a retracement seeking support, while the one-hour chart leans more towards a volatile market. If the price on the hourly chart does not fall below 27000, the price will test around 27400. In summary, the current price is recommended for long positions, and it is suggested to go long at 27180, targeting around 27400.
Pending orders:
Long at 26800-26600, targeting a breakthrough of the previous high, with a 300-point stop loss
Short at 27600-27800, targeting 26900, with a 300-point stop loss
2023.9.19 ETH———————
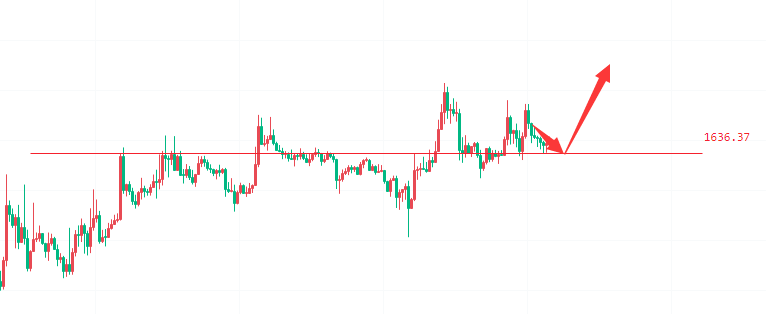
Yesterday, the situation with Ethereum was explained, and 1640 is quite important. Only by staying above 1640 can a new round of upward momentum be initiated. Today, the daily chart shows a good stability above 1640, and the price forms a bullish divergence on the daily candlestick. Therefore, there is potential for a breakthrough in Ethereum this week. In the short term, the price remains within the upward channel on the four-hour chart, and it is advisable to go long at around 1635, with a secondary focus on the position near 1620 as mentioned yesterday. The one-hour chart also shows a Bollinger Bands volatile market, with the indicators leaning towards a stable bullish situation. In summary, it is recommended to focus on retracement and go long, or enter the market at the current price of 1640.
Pending orders:
Long at 1635-1620, targeting a breakthrough of 1670, with a 30-point stop loss
This article is exclusively written by senior analyst Qin Chuan, who has been researching in the investment field of Bitcoin, Ethereum, futures, spot, gold, forex, stocks, etc. for many years. Currently, he mainly guides contract operations. He has a solid theoretical foundation and practical experience, excels in technical and fundamental analysis, emphasizes on capital management and risk control, and has a steady and decisive operating style. He is widely recognized by investment friends for his amiable and responsible character, as well as sharp and decisive operations. For more real-time investment strategies, trading techniques, operational skills, and candlestick knowledge, follow the public account: Zhao Qin Chuan.

Disclaimer: The above analysis represents the author's personal views and does not constitute specific operational advice. Any operations based on this are at your own risk. Investment carries risks, so be cautious when entering the market.
免责声明:本文章仅代表作者个人观点,不代表本平台的立场和观点。本文章仅供信息分享,不构成对任何人的任何投资建议。用户与作者之间的任何争议,与本平台无关。如网页中刊载的文章或图片涉及侵权,请提供相关的权利证明和身份证明发送邮件到support@aicoin.com,本平台相关工作人员将会进行核查。


