Daily Sharing
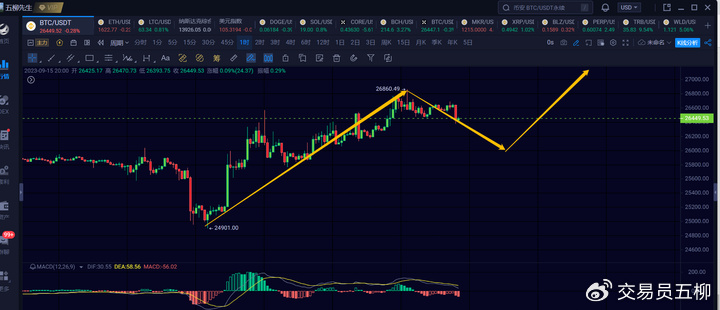
In yesterday's article, we mentioned that Bitcoin may continue to rise to the 26800~27000 range, and it reached a high of 26860 in the early morning, meeting our expectations. From the structure, we can see that in the recent 3-day rebound, Bitcoin has been extending upward in small steps and has not formed an effective 1-hour downtrend. So if we want to go long again, we need to wait a bit longer.
There are actually many opportunities for medium-term operations in Bitcoin. First, we can rely on the 4-hour level to repeatedly make short-term trades. The structure of each 4-hour level movement is still considerable. Secondly, after Bitcoin fell from 31800, there will be a daily level rebound, and we can position ourselves for medium to long-term short trades after the rebound structure emerges, with a target around 20000 for the next medium-term short trade.
In fact, I see Bitcoin's trend as a oscillating downtrend, and it's profitable to repeatedly trade based on the structure of each movement. Of course, it's not possible to predict every movement according to our expectations, and we can't easily capture the profit from every rebound or downtrend. Occasionally, there are movements that are difficult to understand or have complex structures, and we can appropriately ignore them and focus on the ones we can grasp.
BTC Medium-Term
Weekly Chart:
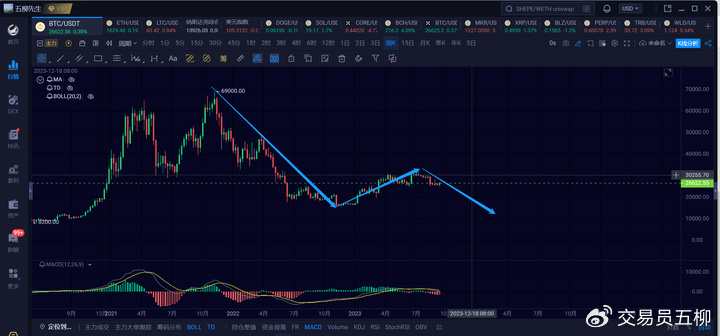
On the weekly level, it's still a oscillating downtrend. Currently, it's the third downtrend on the weekly level, and we are not sure how far the downtrend on the weekly level can go. The first target could be around 18000, and the second target could be around 13000. Overall, the entire downtrend cycle may last until next spring, and we just need to follow the market structure step by step.
Daily Chart:
On the daily level, it's uncertain whether the first downtrend on the daily level has ended. This is mainly because Bitcoin still has the potential to extend downward on the 4-hour level, so we need to observe the strength of the next 4-hour downtrend at least.
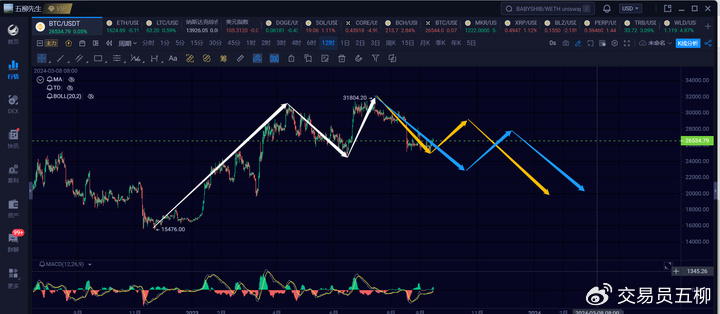
As shown by the yellow arrows in the image, if the first downtrend on the daily level ends around 24900, then the current movement is actually a rebound on the daily level. In this case, the rebound target could be around 28300. There will be a third downtrend on the daily level to around 20000 or below.
If it follows the structure indicated by the blue arrows, then after the current rebound, there will be another break below 24900, followed by a rebound to around 27500, and then a third downtrend on the daily level to around 20000 or below.
Regardless of whether the current movement is a rebound on the daily level, it's definitely okay for us to operate based on the 4-hour level. After all, even a rebound on the daily level will still involve at least three 4-hour level structures.
In summary, it will be more stable to wait for the second rebound on the daily level to emerge before taking the next short position on the daily level. The expected drop in the third daily downtrend will be relatively large.
4-Hour Chart:
There are two possibilities on the 4-hour level. The first is the structure of a rebound on the daily level:
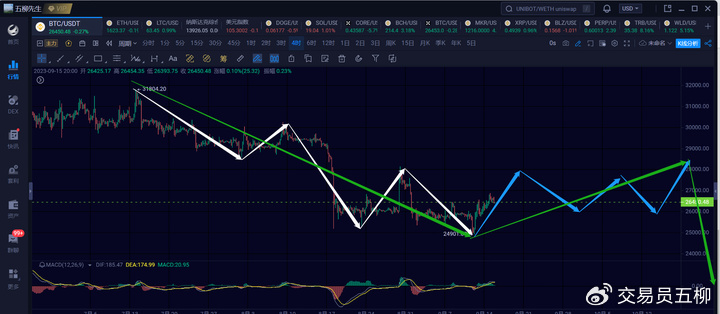
The first possibility is that the first downtrend on the daily level has ended, and a second rebound on the daily level is underway, likely to oscillate between 25500 and 28000 for about a month, and then surge to around 28500 before starting the third downtrend on the daily level. In this case, the current movement is the first rebound on the 4-hour level within the daily level rebound.
The second possibility is the extension of the first downtrend on the daily level:
The current movement involves a rebound on the 4-hour level to around 27000 or slightly higher, followed by the formation of a standard 4-hour level central range, and then a departure from the central range to start a downtrend on the 4-hour level. In this case, Bitcoin will break below 24900 again, and it's currently unknown where it will go after the break.
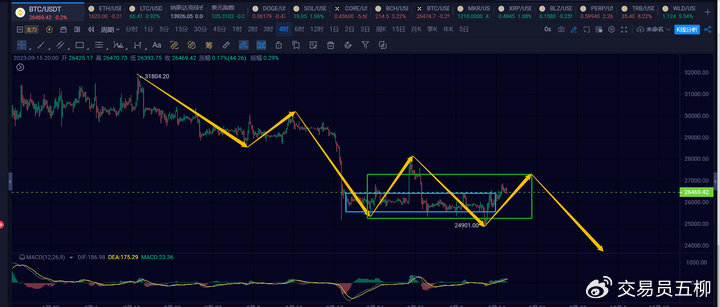
Some may ask, isn't the range between 25300 and 27000 a 4-hour level central range that lasted for over 20 days? This is actually a 4-hour level central range after 9 upward movements, as indicated by the blue box in the image. The structure after 9 upward movements is actually quite complex internally and not particularly stable. The range indicated by the green box in the image is a 4-hour level segment central range, which is more stable.
As for the future direction, both possibilities are possible. We can make judgments based on some detailed structures. If it's a continuation of the daily level downtrend after building a 4-hour central range, then the current 4-hour rebound should not exceed 28000. If it does, then it's definitely a rebound on the daily level. Secondly, if the next 4-hour downtrend does not break below 25000, then it can also be judged that the current movement is a rebound on the daily level, as this situation indicates a "second buy" on the daily level.
For our operations, it doesn't really matter which possibility it is. When the 4-hour rebound ends, we can go short on the 4-hour downtrend. If a "second buy" occurs, we can close the short position and go long, and hold on after breaking below 25000. For other situations, we can use stop-loss to manage the risk.
BTC Short-Term
Due to the rapid changes in the market, this article can only make predictions based on the market at the time of publication. Short-term players should pay attention to the latest market changes and use this information as a reference only.
1-Hour Chart:
On the 1-hour level, the second 1-hour downtrend is currently underway and likely has not ended yet. This pullback should first look at around 26000, and if it doesn't stabilize, then around 25800. It's estimated to continue until tomorrow, and then we can expect the third 1-hour rebound on Sunday or Monday, with a target around 27000~27500. If it surpasses 27500, the probability of a daily level rebound will increase.
15-Minute Chart:
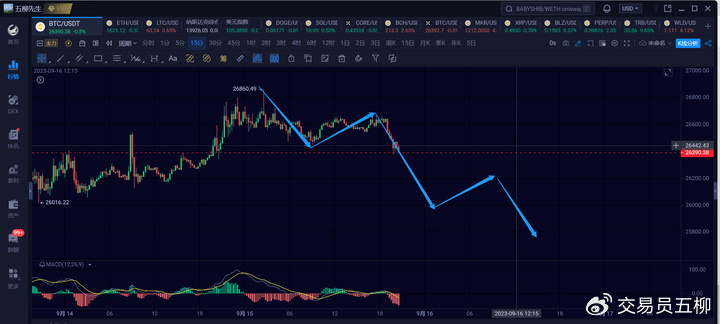
On the 15-minute level, the third 15-minute downtrend is currently underway. This 15-minute downtrend should first look at 26200, and if it breaks below, then the third 15-minute downtrend will not be a retracement, and there will be a fourth 15-minute rebound and a fifth 15-minute downtrend. As for going long, it's advisable to wait a bit. If the 4-hour MACD crosses bearishly, it will likely need at least two or three 4-hour candlesticks to end.
ETH
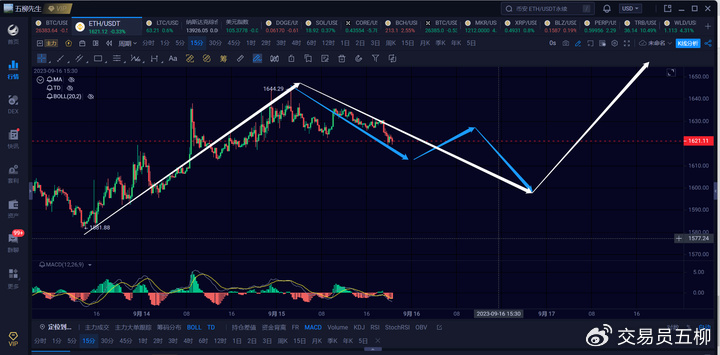
On the 1-hour level, Ethereum is also in the second 1-hour downtrend, which has not ended yet, with a target around 1590~1600. On the 15-minute level, it seems to be the first 15-minute downtrend, and there may be a subsequent 15-minute rebound and another 15-minute downtrend. It's best to observe and not rush.
Trend Direction
Weekly Level: Downward, in the process of oscillating downtrend on the weekly level
Daily Level: Downward, it's currently uncertain whether the first daily downtrend has ended, and we need to observe the subsequent rebound
4-Hour Level: Upward, currently observing a 4-hour rebound, which has not ended yet
1-Hour Level: Downward, currently in the second 1-hour downtrend, first focus on 26000, and if it breaks below, then around 25800
15-Minute Level: Downward, currently in the third 15-minute downtrend, observing whether it breaks below 26200
Feel free to follow my public account for discussions and exchanges:

The article is time-sensitive, so be cautious of risks. The above is only personal advice and for reference only!
免责声明:本文章仅代表作者个人观点,不代表本平台的立场和观点。本文章仅供信息分享,不构成对任何人的任何投资建议。用户与作者之间的任何争议,与本平台无关。如网页中刊载的文章或图片涉及侵权,请提供相关的权利证明和身份证明发送邮件到support@aicoin.com,本平台相关工作人员将会进行核查。


