Article editing time August 11, 2023, 11:00 AM, all opinions do not constitute any investment advice! For learning and communication purposes only.
Last night, the United States announced that the Consumer Price Index (CPI) for July increased by 3.2% year-on-year, better than market expectations, and the core CPI increased by 4.7% year-on-year, reaching a near two-year low. After the data was released, many institutions believed that the annual inflation rate in the United States for July rose compared to June, but the monthly price increase remained moderate, which may prevent the Federal Reserve from raising interest rates in September. Federal funds rate futures show that the probability of maintaining interest rates unchanged in September is approaching 90%.
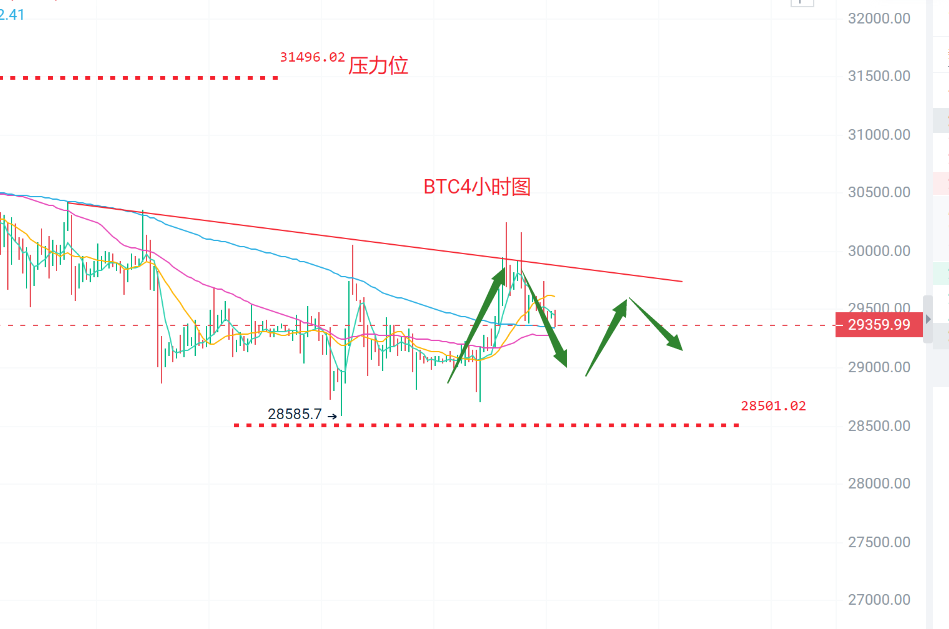
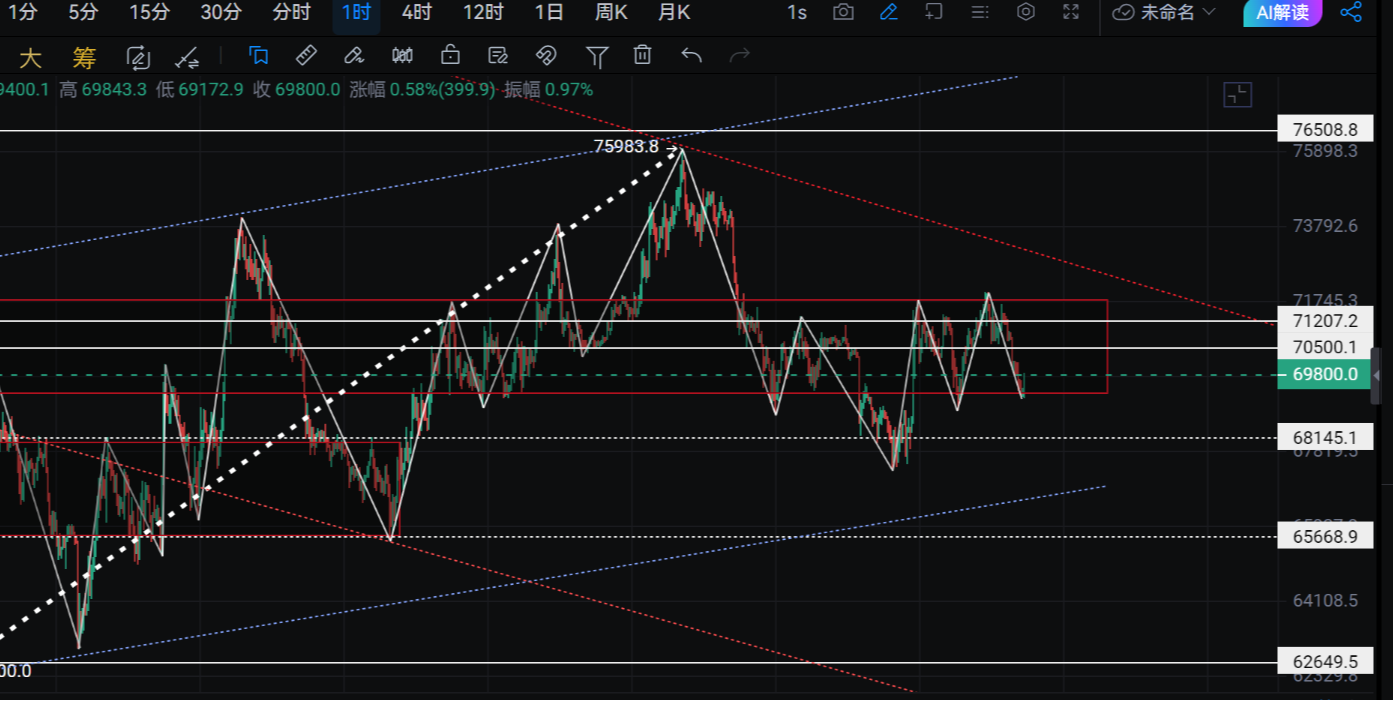
Bitcoin reached a high near 29740 yesterday and a low near 29320. After the CPI data was released last night, Bitcoin experienced a slight up and down trend, reaching a high of 29738 before starting to fall back. The recent data had little impact on the market, with overall small fluctuations and low trading volume. In the short term, it is still in a downward trend, with short-term attention to the resistance at 30000.
On the daily chart, a small bearish candle was formed yesterday, and the Bollinger Bands are trending downwards, suppressed by the upper band at 29900. The MACD volume remains low, and on the 4-hour chart, the Bollinger Bands are starting to contract, supported by the middle band at 29100, with a strong downward MACD volume. In terms of operation, it is recommended to go long with a light position near 28700 on the pullback, with targets at 29300-29800. A light short position can be taken near 30100, with targets at 29500-28800, and stop losses of 350 points each. The market changes are diverse, and specific operations should be based on real-time strategies.
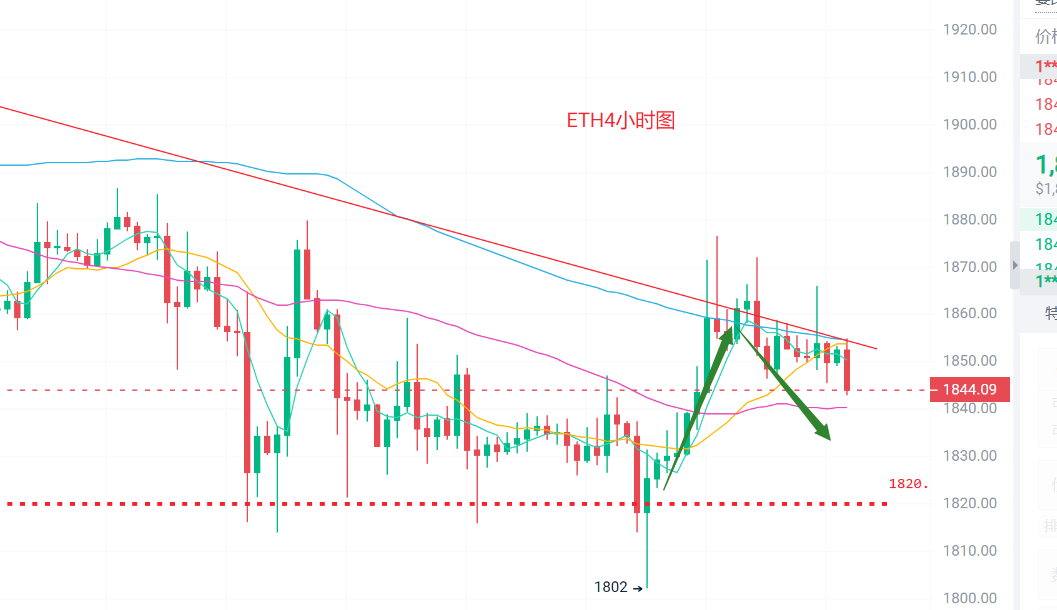
Ethereum reached a high near 1865 and a low near 1845 yesterday. After the data was released, Ethereum experienced a upward surge, reaching a high of 1865 before starting to fall back. There was no effective breakthrough of the trend line, and it is currently running along the downward trend line, still in a converging phase, patiently waiting for the market to choose a direction.
On the daily chart, a small bearish candle was formed yesterday, and the Bollinger Bands are trending downwards, supported by the lower band at 1820. The MACD volume is low, and on the 4-hour chart, the Bollinger Bands are starting to contract, suppressed by the upper band at 1870. In terms of operation, it is recommended to go long with a light position near 1820 on the pullback, with targets at 1850-1860. A light short position can be taken near 1860, with targets at 1830-1800, and stop losses of 25 points each. The market changes are diverse, and specific operations should be based on real-time strategies.
Disclaimer: The above content is for personal opinions only, and the strategies are for reference only and not as a basis for investment. Please bear the risk if you choose to follow.

Friendly reminder: The above content is from the public account: "Floating Bamboo Li Jun". The advertisements at the end of the article and in the comments section are not related to the author. Please discern carefully, and thank you for reading.
免责声明:本文章仅代表作者个人观点,不代表本平台的立场和观点。本文章仅供信息分享,不构成对任何人的任何投资建议。用户与作者之间的任何争议,与本平台无关。如网页中刊载的文章或图片涉及侵权,请提供相关的权利证明和身份证明发送邮件到support@aicoin.com,本平台相关工作人员将会进行核查。