Daily Sharing
Bitcoin dropped below 28800 in the early morning, but the price quickly rebounded, indicating a potential demand for further rebound. It is expected to rebound for another two days or so.
In the past week, we have been expecting a 4-hour rebound for Bitcoin, but it has not materialized as anticipated. Based on the structure, it is likely that Bitcoin will rebound regardless of whether it drops below 28500. Therefore, I did not open a short position at 29000 recently because the structure did not meet the requirements.
Regarding YGG, its price movement is heavily manipulated by market makers, making it difficult to predict using technical analysis. It is risky to trade futures contracts on such altcoins. The volatility is high, and luck plays a crucial role.
BTC
Due to the fast-changing market conditions, the analysis only reflects the moment of publication and should be used as a reference for short-term traders.
1H:
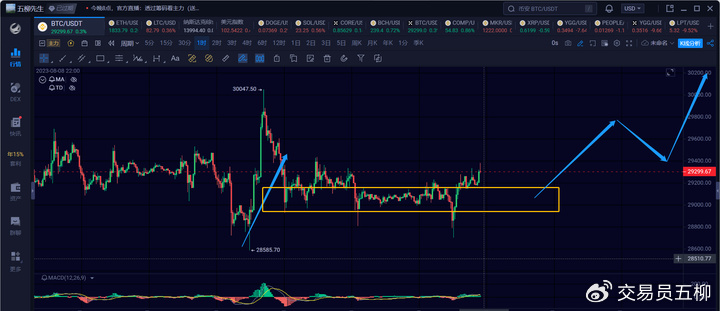
The price did not drop significantly last night, indicating a potential for further consolidation or rebound. If the price remains above 29000 in the short term, there is a high probability of a rebound towards 30000 or 30300 in the next day or two.
Once the 4-hour rebound for Bitcoin is completed, we need to be cautious of the next potential drop to 27000 or lower. As long as the 4-hour rebound has not materialized, the bullish trend is relatively safe in the short term.
15M:
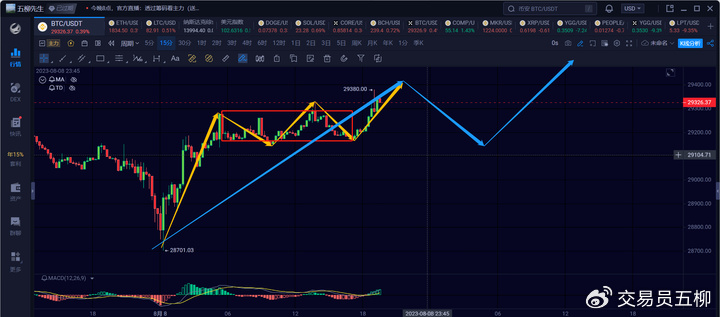
The rebound from 28701 last night on the 15-minute chart has not ended yet. A temporary pullback is expected, and as long as it stays above 29100, there could be a third 15-minute rebound. A breakthrough above 29500 would indicate a potential move towards 30000 or higher.
ETH:
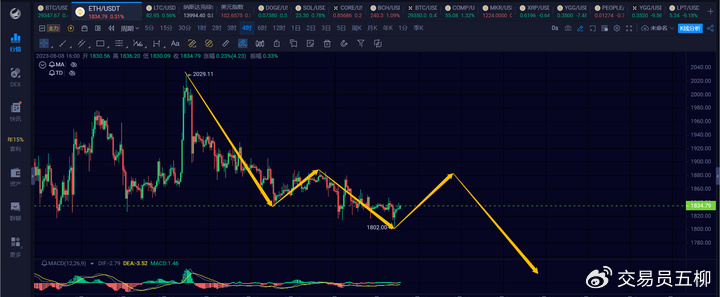
On the 4-hour chart for Ethereum, there is a possibility of forming a 4-hour consolidation and continuing the downtrend. The key resistance levels are around 1880 and 1900.
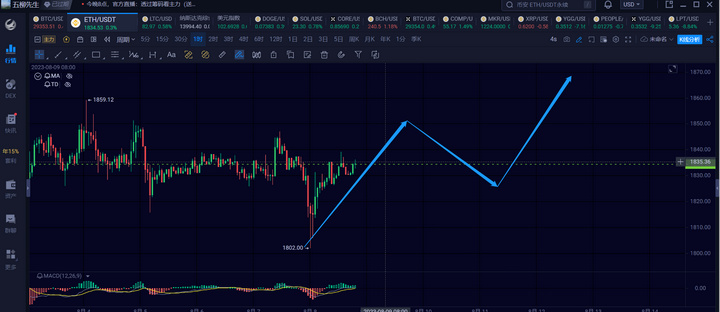
On the 1-hour chart, we are looking for a potential 1h-level three-wave structure to form a 4-hour rebound. The short-term resistance is around 1855.
Trend Direction
Weekly Chart: Downward, with a tendency to oscillate near the top before a decline
Daily Chart: Downward, with a high probability that 31800 is the top
4-Hour Chart: Upward, with a potential for a 4-hour rebound towards 30000
1-Hour Chart: Upward, with a potential for a 1-hour rebound, and focus on whether it breaks above 29500
15-Minute Chart: Upward, with a potential for continued rebound if it does not drop below 29000 in the short term
Feel free to follow my public account for further discussion and exchange:

This article is time-sensitive. Please be aware of the risks, and the above is for reference only!
免责声明:本文章仅代表作者个人观点,不代表本平台的立场和观点。本文章仅供信息分享,不构成对任何人的任何投资建议。用户与作者之间的任何争议,与本平台无关。如网页中刊载的文章或图片涉及侵权,请提供相关的权利证明和身份证明发送邮件到support@aicoin.com,本平台相关工作人员将会进行核查。


