The Federal Reserve's minutes are coming tonight. Can BTC hold the 63,000 threshold? (August 17)
Friends, in today's morning news, there are two important things worth highlighting. First, spot gold has broken through 4,400 dollars, with a daily increase of 0.57%, indicating a significant rise in demand for safe-haven assets. Second, the Federal Reserve's minutes and PMI data are coming tonight, and market sentiment is cautious. If the minutes lean hawkish, the rebound potential for BTC may be directly suppressed. On one hand, there is buying from safe-haven funds, while on the other hand, there is policy uncertainty. BTC is stuck at 63,347, and a directional decision is imminent.
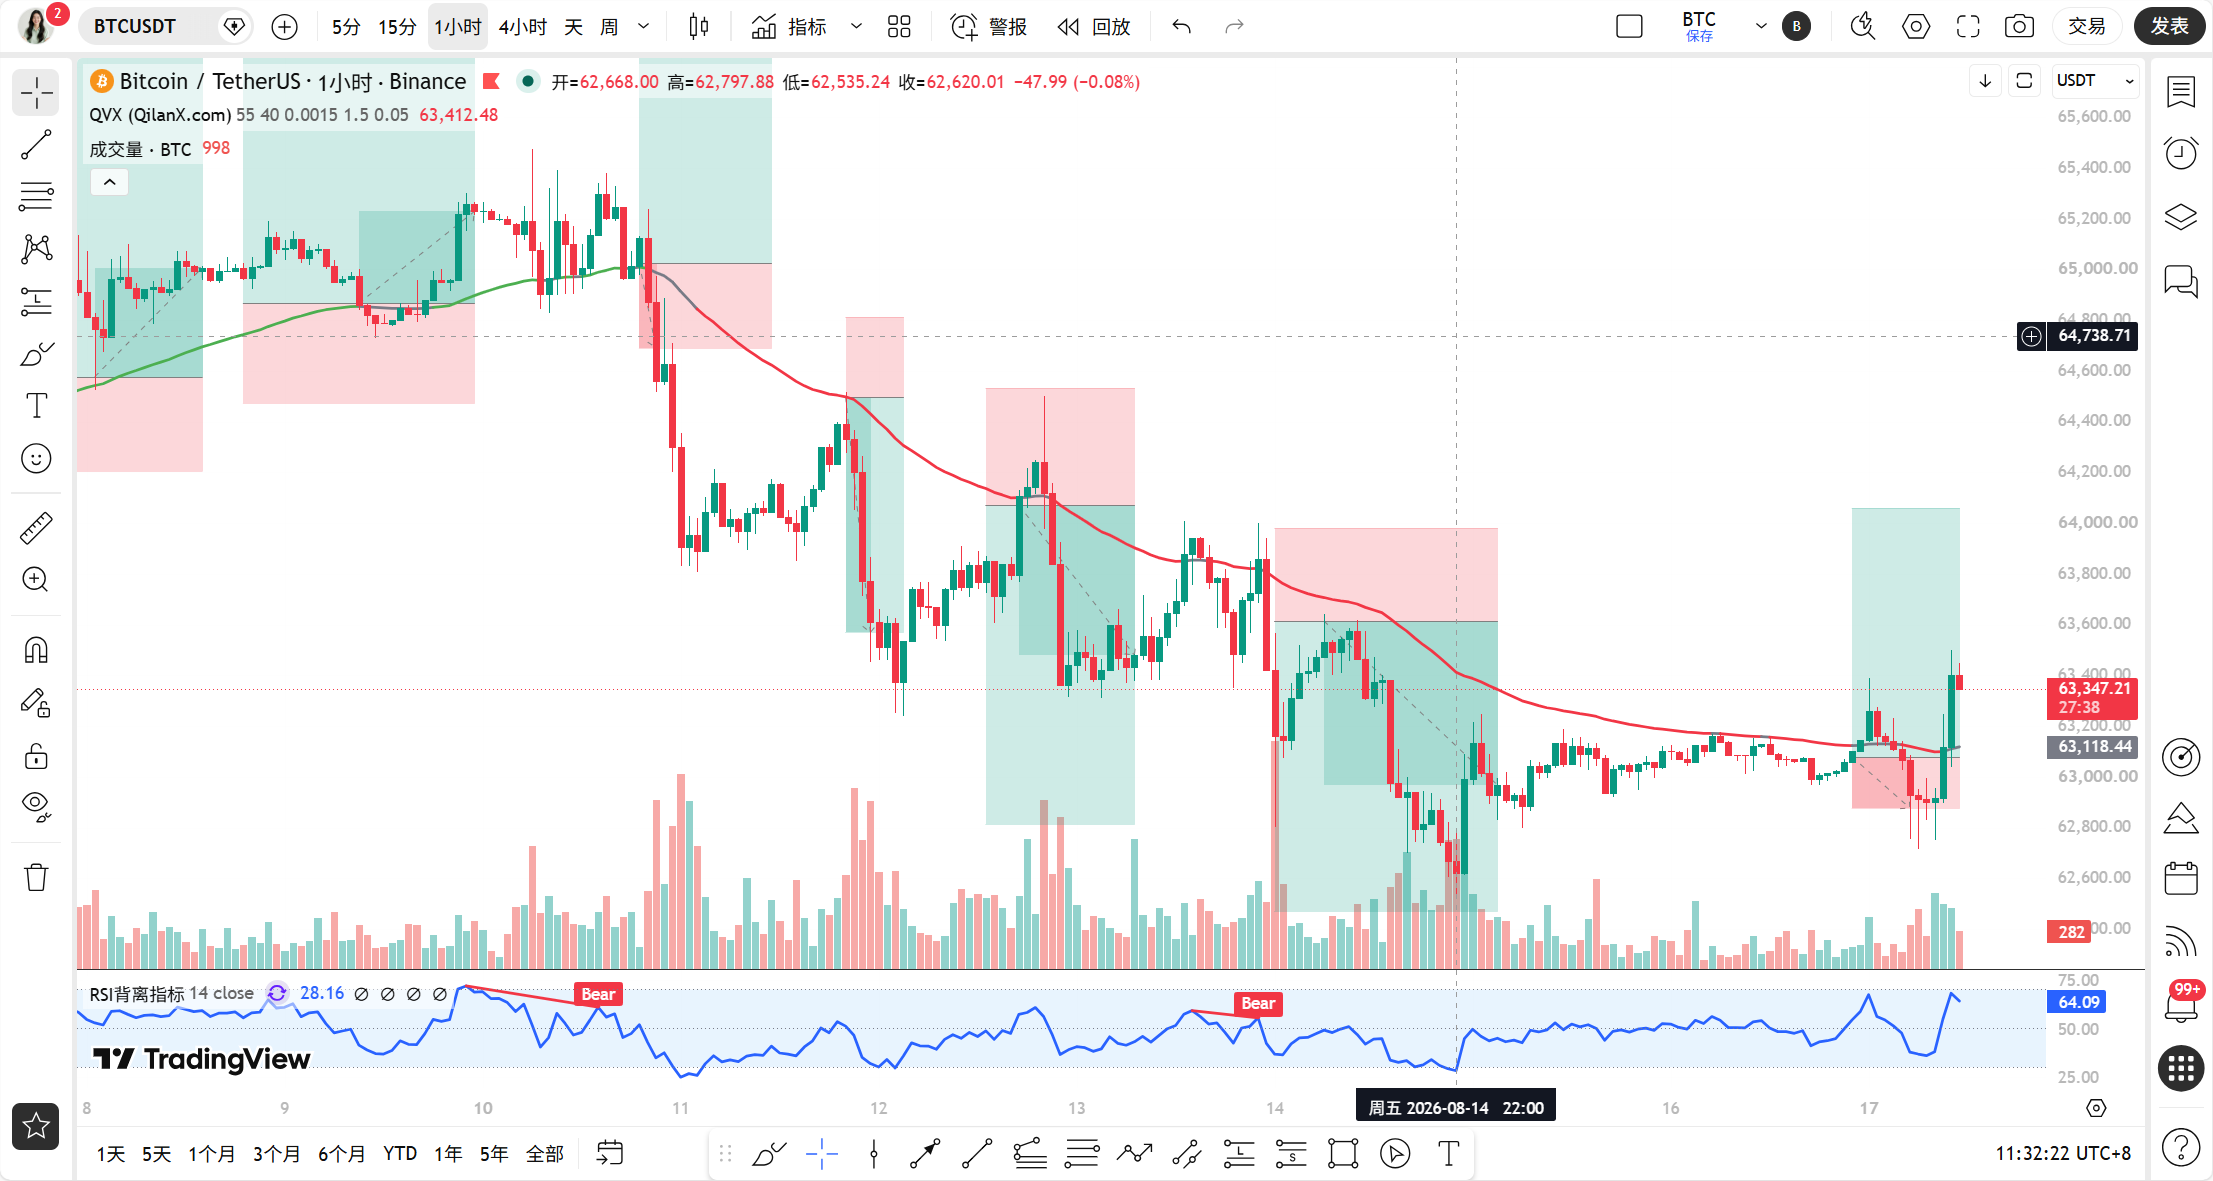
As of 11:32 AM on August 17, BTC is at 63,347 USDT, with a 24-hour increase of 0.39% and a market share of 56.18%. The price is consolidating above 63,000, but the signals from multiple time frames are not consistent; short-term is slightly strong, while the medium-term remains under pressure.
Firstly, looking at the daily chart. The MA5 is at 63,173, MA10 is at 63,678, and MA30 is at 64,199. Short-term moving averages are still trending downwards. Although the price is above the MA5, it is still some distance from the MA10 and MA30. The MACD's DIF is operating in the negative region, and although the histogram has narrowed, it remains negative, indicating that the bearish momentum at the daily level has not yet been fully released. The RSI is around 48, neutral and slightly weak, without clear directional guidance. Overall, the daily chart is categorized as a repair phase after a decline, with limited rebound strength.
Next, looking at the 4-hour chart. MA5 and MA10 are basically converged around 63,100, MA30 is at 63,266, and the price is right above the dense area of the moving averages. The MACD's DIF and DEA are both in the negative area, but the histogram has turned positive, showing that short-term momentum has somewhat repaired. RSI is at 64.68, slightly strong but not overbought. The 4-hour level is in a rebound structure within a bearish trend, and its continuation depends on whether it can stabilize above 63,300.
The 1-hour level is currently the most critical observation window. EMA55 is at 63,101, and the current price is 63,347, above EMA55 by about 0.39%. MA5 is at 63,136, MA10 is at 63,084, and MA30 is at 63,087, with short- to medium-term moving averages starting to diverge upwards. The MACD's DIF is at 29.23, and DEA is close to the zero axis, with a histogram of 29.28, indicating that bullish momentum continues to enlarge. The RSI is at 62.83, slightly strong but not overbought. The 1-hour level is slightly bullish in the short term, but note that the price distance from EMA55 is only 0.39%, so if there is a retracement, the support strength needs to be validated.
Looking at the 15-minute level, MA5 is at 63,356, MA10 is at 63,250, and MA30 is at 63,044, with the moving averages in a bullish arrangement. The MACD histogram is at 44.09, and momentum remains, but the RSI has reached 72, indicating signs of short-term overbought that need caution against a pullback.
Now, let's verify the signals using the Qinglan TPV system. In the past 8 one-hour candlesticks, the closing price greater than EMA55 occurred 3 times, with a crossover occurring once, and the price distance from EMA55 is 0.39%, not meeting the shock threshold, currently in a one-sided trend observation period. As for the long conditions, the price has closed above EMA55 for 2 consecutive one-hour candlesticks, which condition has just been met. On the support stability aspect, there have been multiple lower shadows confirming around 63,000 at the one-hour level, indicating effective support. On the bearish momentum exhaustion aspect, the MACD histogram continues to expand, and the RSI has rebounded from a low position, fulfilling momentum conditions. The three conditions are generally met, but note there has only been one crossover, so the trend's stability needs more candlestick confirmation.
On-chain data indicates the fear and greed index is unknown, but combined with the current consolidation trend, market sentiment is moderately neutral. Whales have withdrawn 5,300 ETH from Kraken, suspected to be pledged, reducing circulating supply, which is bullish for ETH and indirectly beneficial for BTC. The UNI whale's coin hoarding has reached a five-year high, with Binance averaging an outflow of 7,300 coins daily, indicating large holders are positioning themselves at lower prices. Tether has undergone the largest audit by KPMG in history, increasing the transparency of USDT reserves, enhancing trust in the stablecoin, which is a positive signal for the overall crypto market. However, the rise of AI trading craze is drawing funds away from the crypto market to AI stocks, which is a sustained blood-letting pressure that cannot be ignored.
On key attack and defense points, the first resistance level above is at 63,500, which is near the MA30 of the 4-hour level and also represents the recent rebound high region. The second resistance level is at 64,200, corresponding to the MA30 position on the daily chart, with a breakout here able to open up upward space. The first support level below is at 63,100, corresponding to the EMA55 of the one-hour level, a boundary line for bulls and bears; if broken, it indicates a short-term weakening. The second support is at 62,700, corresponding to the convergence area of MA5 and MA10 at the 4-hour level, which is a key position for medium-term bullish and bearish contest.
In terms of trading strategy, the current one-hour level is slightly bullish, but the daily pressure has not cleared, so the operation should focus on short-term low buying and not chasing high prices. For the long direction, entry conditions are for the price to stabilize after retracing to the 63,100 to 63,200 range, showing a bottoming formation or a long lower shadow in the one-hour level while the MACD histogram does not continue to narrow, allowing for a light position entry. Stop-loss is set below 62,900, with a target at 63,500; if broken, look for 64,200. If the price breaks 63,500 directly with significant volume, wait for a retracement confirmation before chasing long, and adjust the stop-loss to 63,200. For the short direction, if the price is under pressure in the range of 63,500 to 63,600, and forms a topping pattern or a long upper shadow in the one-hour level while the RSI falls from a high position, a short attempt can be made with a stop-loss set above 63,800, targeting 63,100, and if broken, then 62,700. Currently, it is not recommended to enter long positions directly around 63,300, as the risk-reward ratio is not favorable.
In terms of risk warning, the Federal Reserve's minutes tonight are the biggest variable; if hawkish signals are released, BTC may quickly break the 63,100 EMA55 support, and short-term long positions must adhere strictly to stop-loss.
Follow Qinglan Crypto Classroom to grasp more trading opportunities! Welcome to visit the official website www.qinglan.org
📊 Qinglan TPV Trading Strategy Backtesting Reference
🕒 Last Backtesting Time 08-17 07:00:02
Total Analysis: 3578 Backtests: 3572 Accuracy Rate: 79.8% (2851/3572)
免责声明:本文章仅代表作者个人观点,不代表本平台的立场和观点。本文章仅供信息分享,不构成对任何人的任何投资建议。用户与作者之间的任何争议,与本平台无关。如网页中刊载的文章或图片涉及侵权,请提供相关的权利证明和身份证明发送邮件到support@aicoin.com,本平台相关工作人员将会进行核查。