The main bellwether of the Ripple ecosystem — the XRP token — is steadily losing value against the U.S. dollar, hovering around the dangerous psychological level of $1.
However, the Bollinger Bands on TradingView are sending the opposite signal — while the asset's fiat value is fading, XRP is preparing for a strong technical move against the market's flagship cryptocurrency, Bitcoin.
Dollar pressure on XRP
Looking at the XRP/USD chart, the picture appears troubling. Following its explosive rise in the previous cycle, when the token surged above $3.20, the asset has entered a prolonged decline. By mid-August 2026, its price had moved close to the psychological barrier of $1.00.
HOT Stories Shiba Inu (SHIB), Bitcoin (BTC), Near Protocol (NEAR) and Hyperliquid (HYPE) Price Analysis for August 16: Foundation for Market Recovery Solana Set for Major Finality Upgrade
The Bollinger Bands indicator on the weekly and monthly charts clearly shows that the price is effectively sliding along the lower boundary of the range.
You Might Also Like
Fri, 08/14/2026 - 12:27 XRP Whales Absorb 72 Million More Coins as ETFs Drop Below $1 Billion NetByGamza Khanzadaev
If the $1.00 level fails to hold, the technical corridor will open the door to a further decline, potentially toward the long-term support zone between $0.65 and $0.85.
Escaping the Bitcoin trap
The situation looks entirely different when the dollar is removed from the equation and XRP is compared directly with Bitcoin through the XRP/BTC pair. Here, the charts are signaling that sellers are exhausted.
Over the past five years, XRP has gone through a massive capitulation against the market leader and is now testing a historic bottom. On the monthly chart, the price has reached the rock-solid level of 0.00001480 BTC. Major players did not allow the token to fall below this level even during its darkest periods.
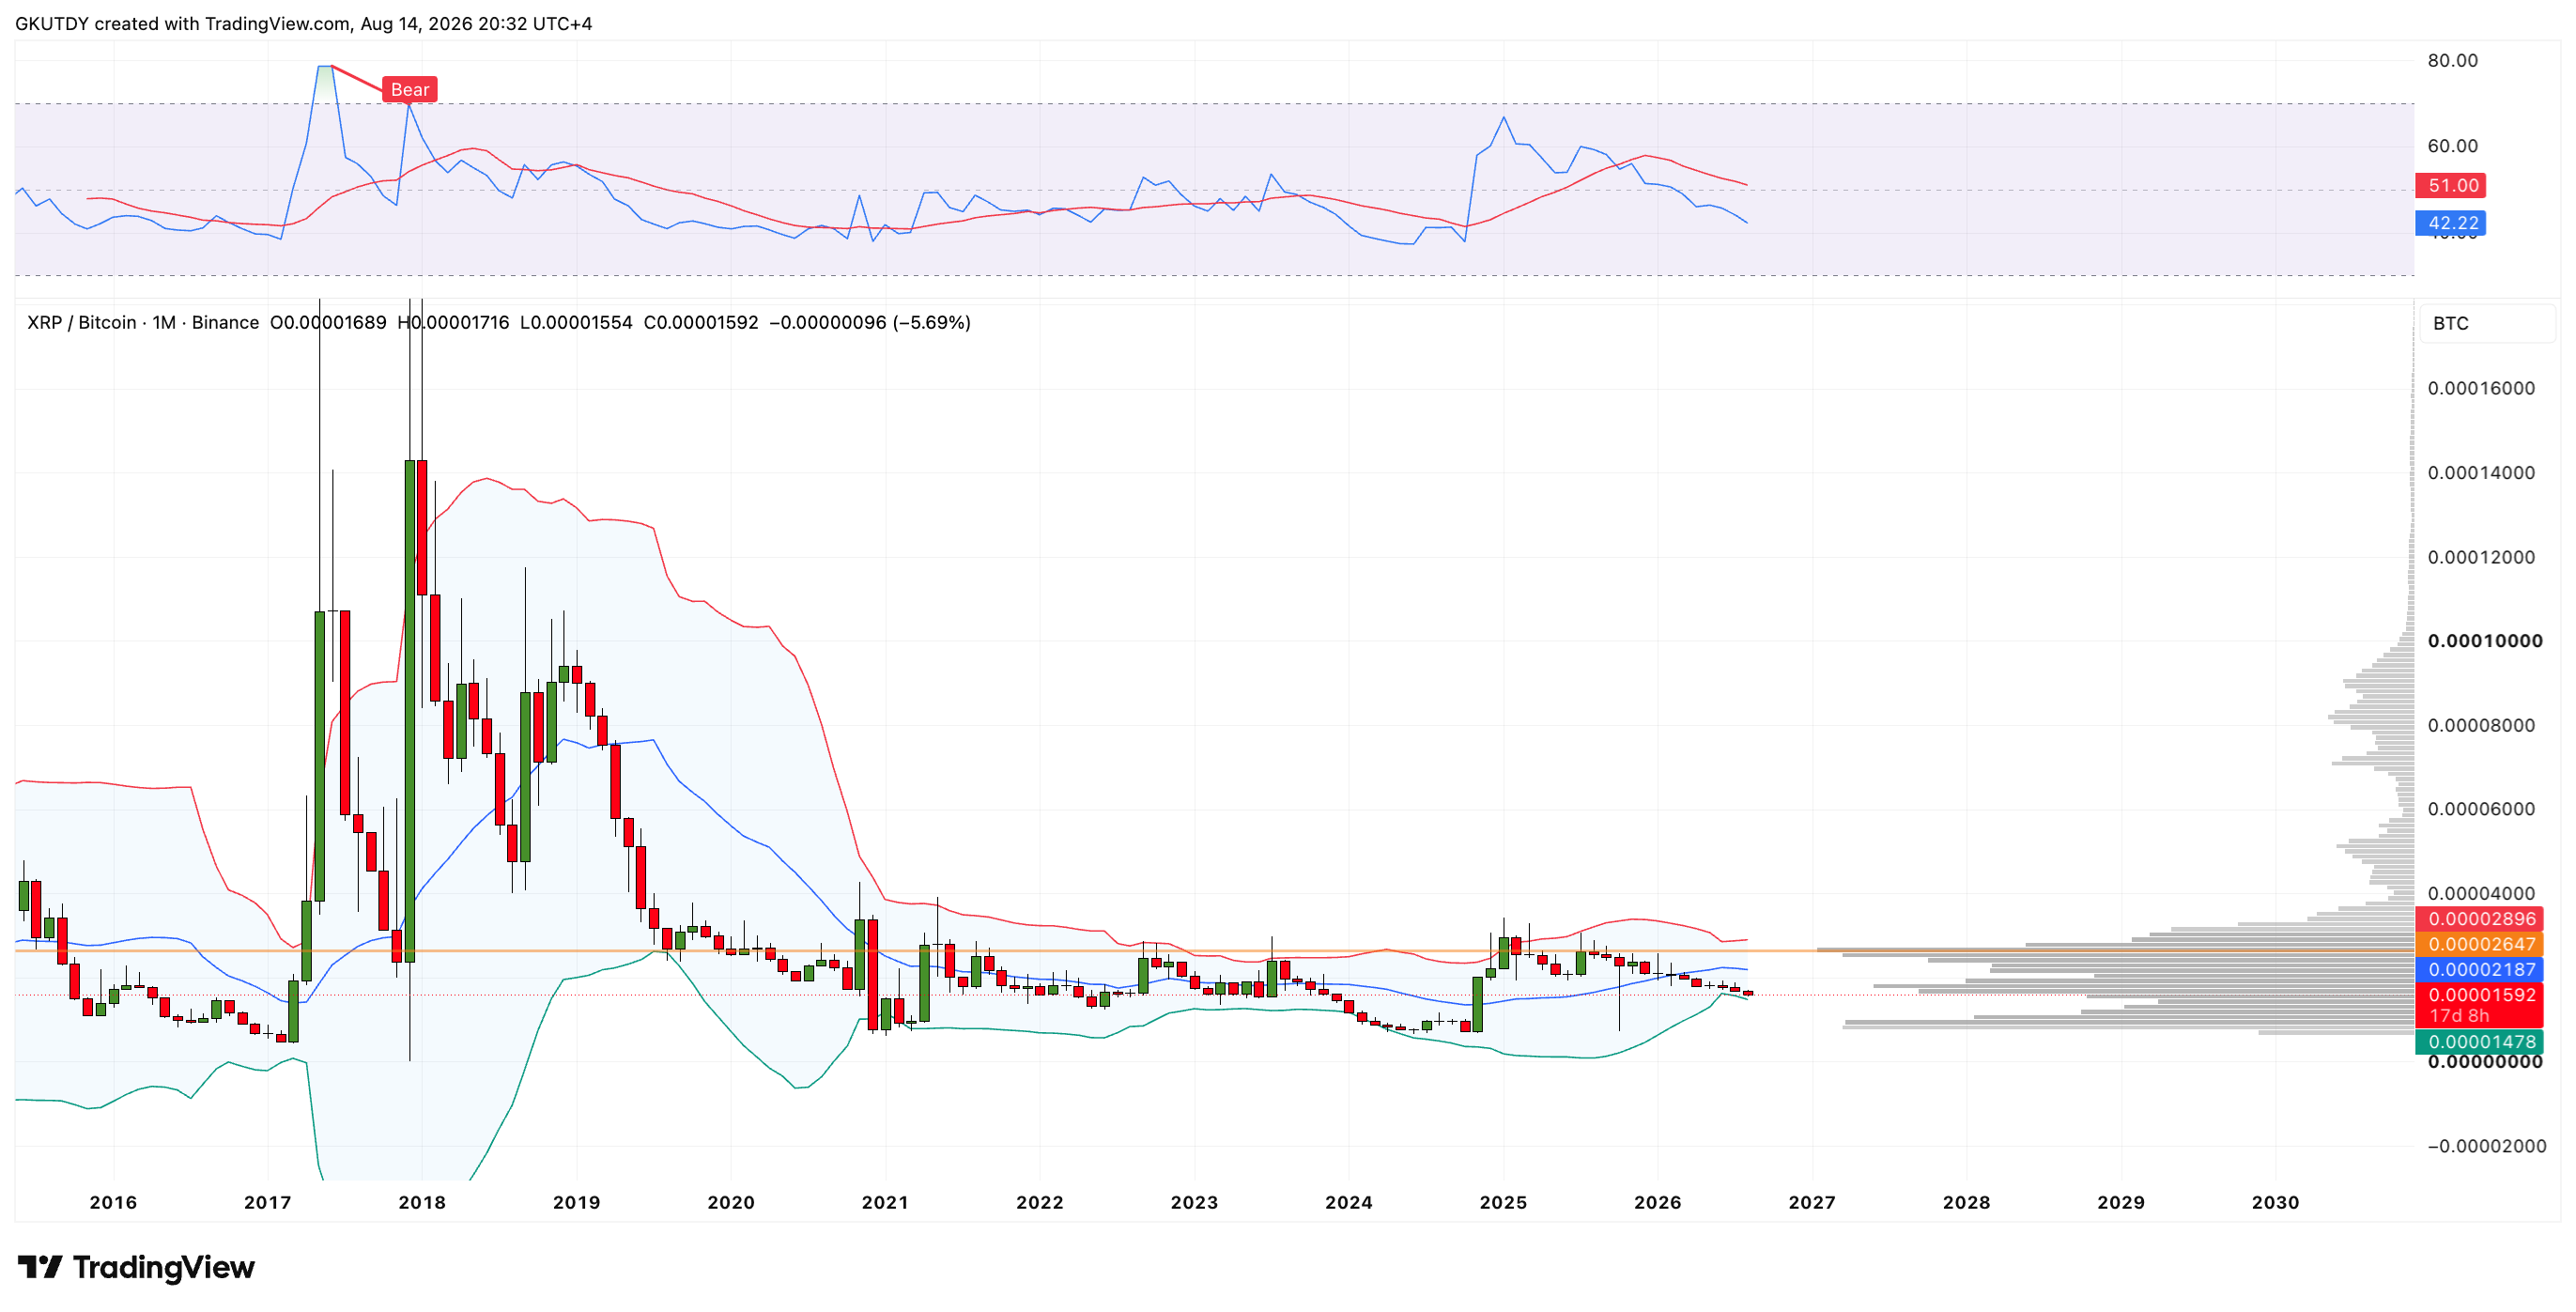
XRP/BTC monthly chart within Bollinger Bands, Source: TradingView
This is where pure mathematics comes into play. After its prolonged rise, Bitcoin looks overheated and exhausted, while its volatility has contracted to a minimum. If the cryptocurrency market continues to fall, Bitcoin could lose market capitalization much faster because of its sheer size.
XRP, meanwhile, has practically nowhere left to fall — it is already at the bottom. Because of this difference in the pace of decline, the XRP/BTC chart could begin to reverse upward.
The daily XRP/BTC chart has already produced a local bullish signal from the RSI, while the volume profile shows that a so-called "vacuum" lies above the current price — an area with almost no sell orders.
You Might Also Like

Fri, 08/14/2026 - 15:02 Top Tesla Bull Says He Is Done With Bitcoin Due to SaylorByAlex Dovbnya
This means that once Bitcoin finally stalls, XRP/BTC could move upward with very little resistance. The nearest target for this technical rebound is a return to average levels, which would give the token a gain of roughly 28% against Bitcoin.
As of August 2026, buying XRP with U.S. dollars remains risky, as the decline caused by macroeconomic pressure could continue. However, for those looking to rotate out of a stalled Bitcoin position and sit out the broader market storm, Ripple's "North Star" is becoming one of the most promising candidates for a local victory.
免责声明:本文章仅代表作者个人观点,不代表本平台的立场和观点。本文章仅供信息分享,不构成对任何人的任何投资建议。用户与作者之间的任何争议,与本平台无关。如网页中刊载的文章或图片涉及侵权,请提供相关的权利证明和身份证明发送邮件到support@aicoin.com,本平台相关工作人员将会进行核查。


