The cryptocurrency market has once again played out a "leverage game": Approximately $208 million was liquidated across the network in the past 24 hours, with a significantly higher proportion of shorts, triggering a typical short squeeze; meanwhile, on-chain data shows that Bitcoin whales' holdings (excluding exchanges) have steadily increased from about 2.87 million coins at the end of last year to around 3.06 million coins, with institutions like CryptoQuant believing this could be a signal in the later stages of the bear market. These hotspots lead to a core question—while A-shares have a clear "golden half hour" at the end of trading, cryptocurrencies operate 24 hours without rest; when and how should one analyze them?
Short-term traders in A-shares consider the time from 2:30 PM to 3:00 PM as the "golden half hour," where selecting stocks at the end captures the final stance of the main forces; however, the cryptocurrency market operates year-round, truly 24 hours. The different rhythms dictate completely different analysis focuses. Below, we will focus on the core analysis dimensions of the cryptocurrency market, especially how to view liquidation heatmaps and on-chain data.
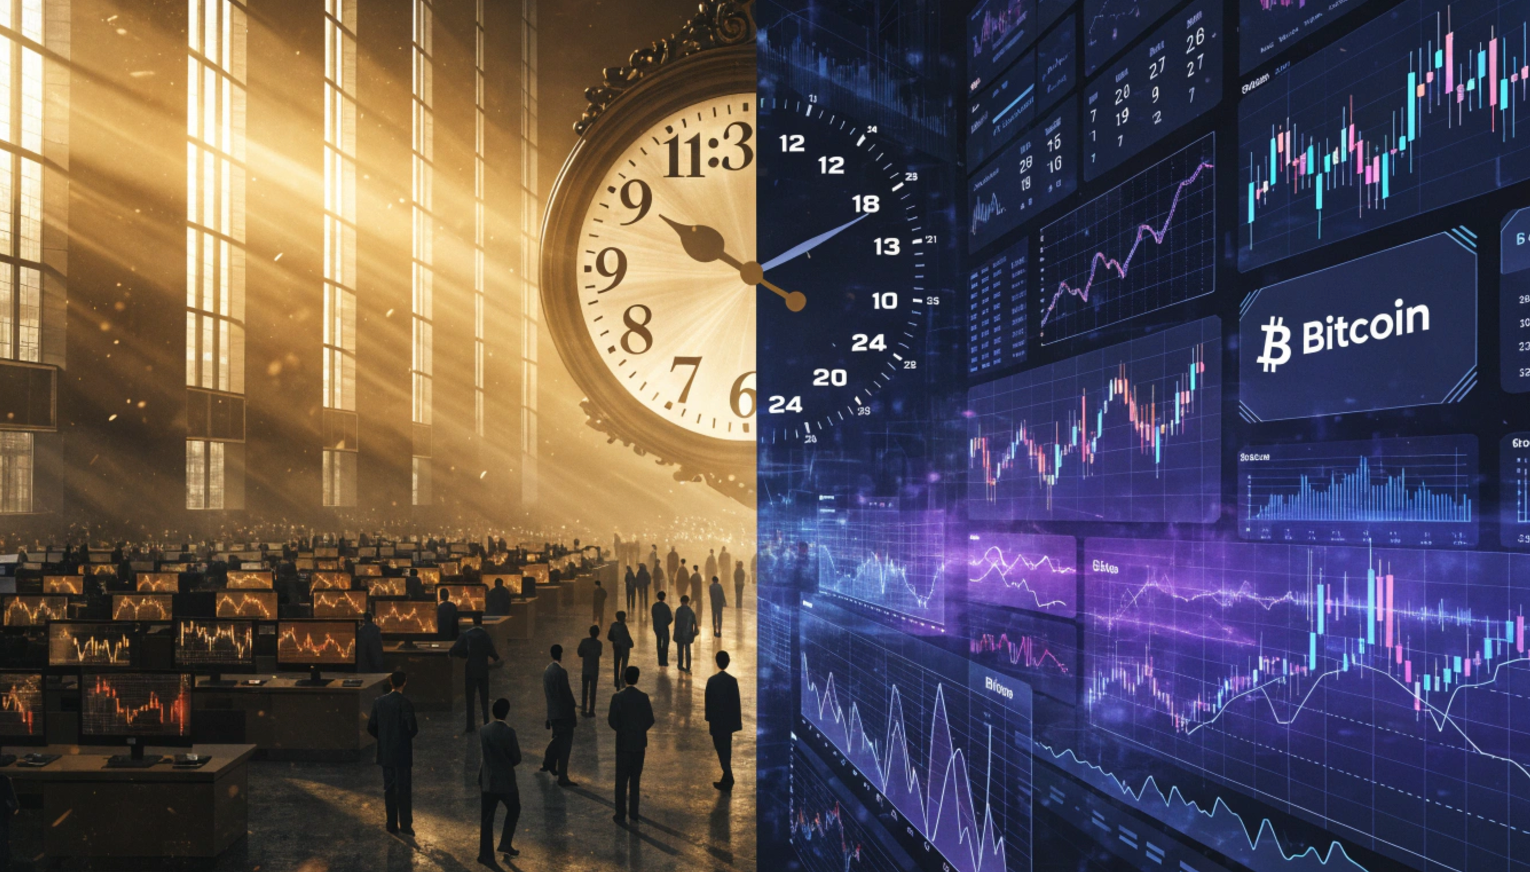
First, a quick review of the A-share closing window
A-share trading times are fixed (9:30-11:30, 13:00-15:00), and the closing period after 2:30 PM sees a close to the end of the capital game, making minute-by-minute and volume analysis harder to disguise. Common short-term practices involve selecting stocks with a 3%-5% increase, moderate volume ratio and turnover, and real volume at the close, speculating for the next day's premium. The fixed price trading after the market (15:05-15:30) in 2026 further changed the final stage of closing speculation. This part is suitable for short-term strategies with a clear closing rhythm, but the focus of the text shifts to cryptocurrency.
Cryptocurrency market: 24/7 operation, but liquidity has "tides"
Mainstream coins like Bitcoin trade year-round, without opening or closing times. Actual activity is not uniform—Asia, Europe, and America take turns driving volume, with the overlap between Europe and America, as well as around the opening of the American market (from evening to late night Beijing time), often showing the highest trading volume and volatility. Late night to early morning sees thinner liquidity and higher slippage risk. Analysis can be conducted at any time, but signals during high liquidity periods are more reliable.
Core analysis dimension one: Liquidation heatmap
The liquidation heatmap is one of the most commonly used tools by perpetual contract traders, intuitively displaying potential liquidation amounts for longs or shorts at different price levels.
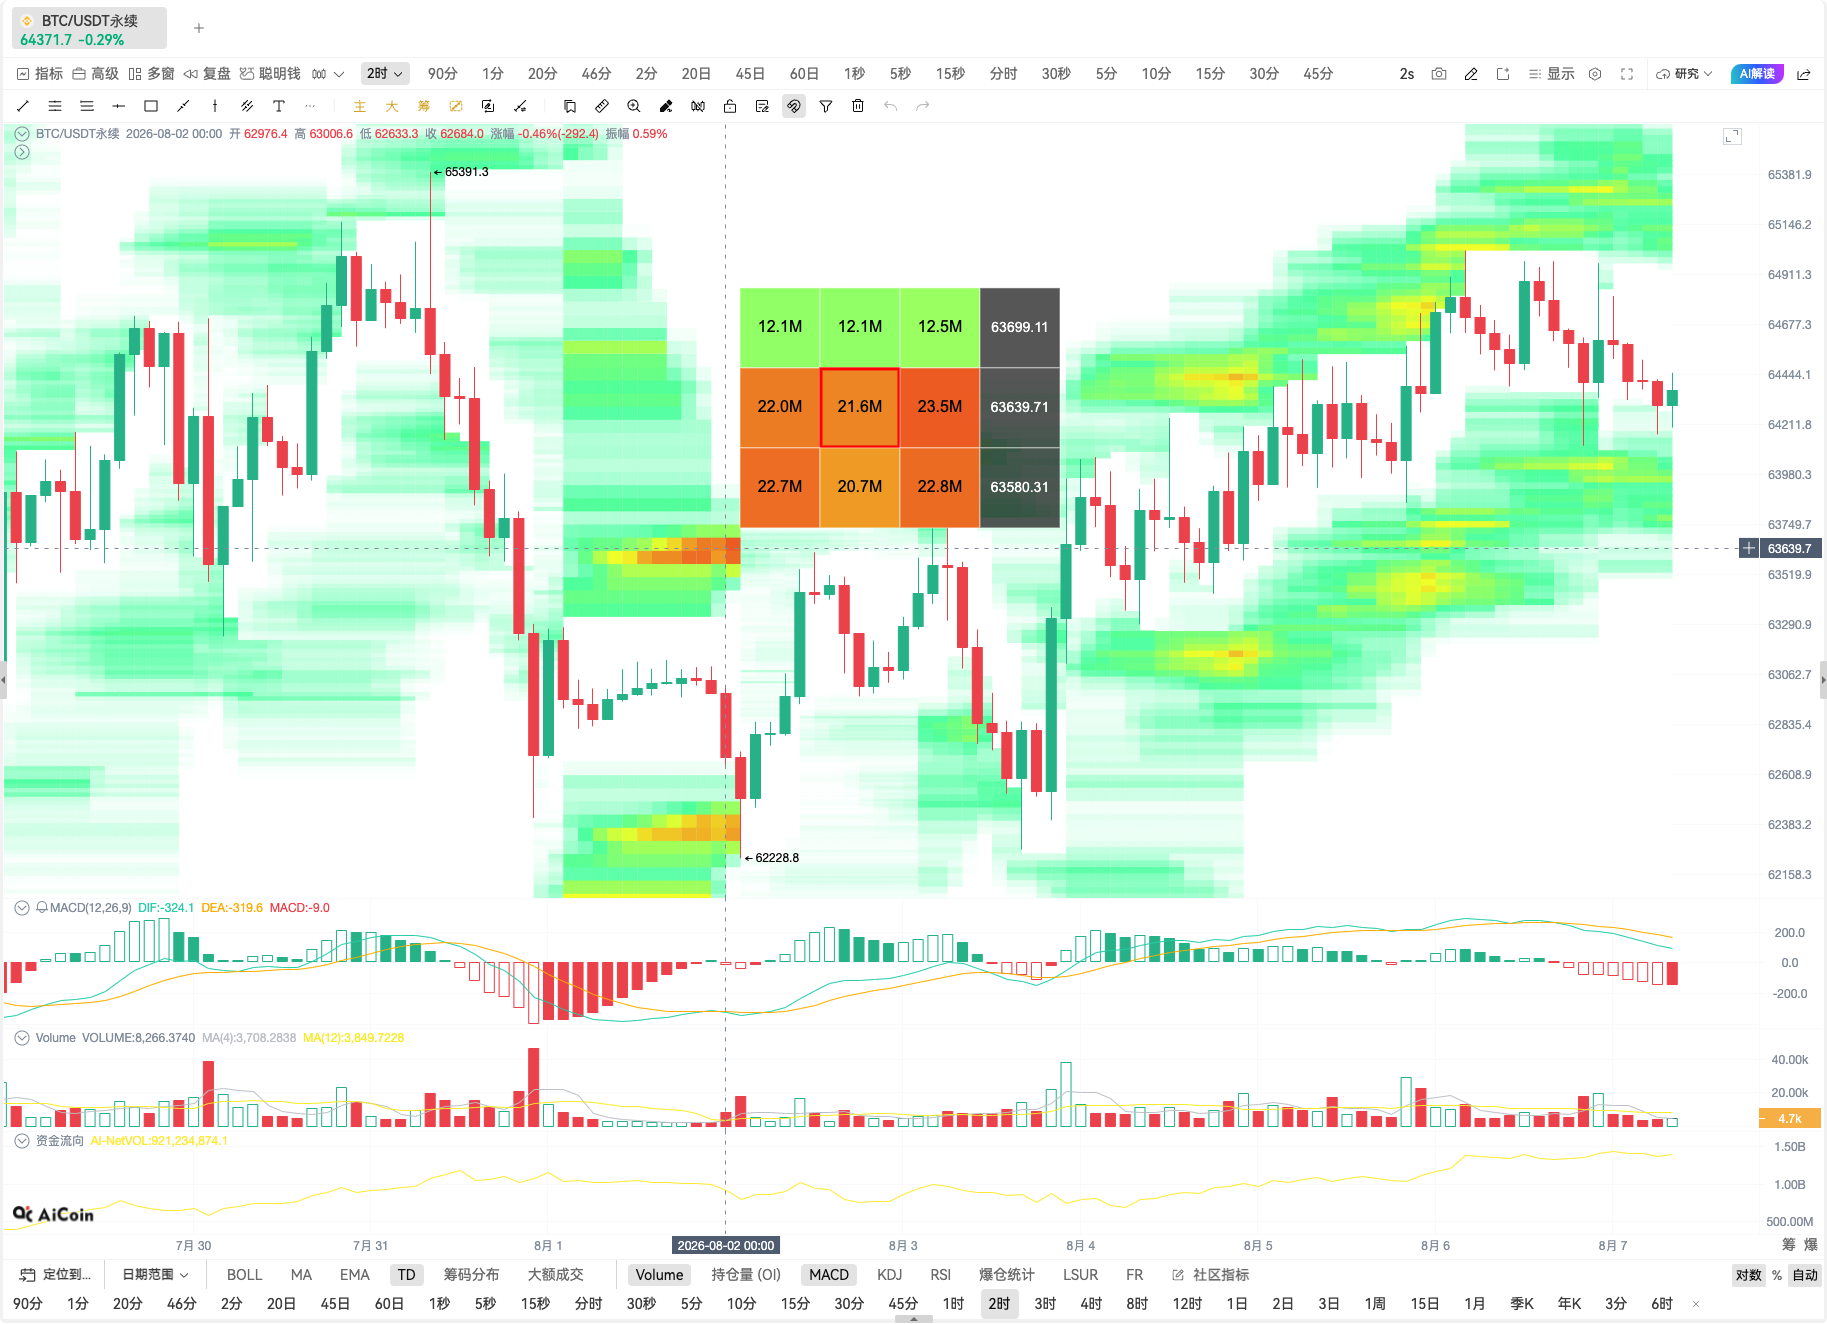
How to interpret:
- The heatmap uses variations in color intensity to represent liquidation density. The darker the color, the more leveraged positions piled up near that price.
- A large area of red or highlighted regions often becomes a short-term support or resistance—prices are likely to trigger cascading liquidations nearby, accelerating market movements.
- Below concentrated liquidation zones for longs, a breakdown may trigger a cascade; above concentrated zones for shorts, a breakthrough may accelerate upward movement.
- Combine with current open positions and funding rates: if the heatmap shows a significant buildup of longs and the funding rate is high, the market is likely vulnerable to "long squeezes."
Applicable time: The heatmap changes most rapidly during high liquidity periods (Europe and America overlapping, before and after US market opening), providing more valuable signals. The heatmap may distort during low liquidity periods.
Recent case (around August 5-6, 2026):
While Bitcoin consolidated around $64,000, the liquidation heatmap showed:
- There was significant liquidity/short liquidation concentration in the $64,800-$65,100 area, causing a brief touch before meeting resistance and falling back.
- The downward area at $64,000 became a crucial short-term defense level. Historically larger events (such as nearly $19 billion liquidated in a single day in October 2025) often unfold along high-density areas of the heatmap.
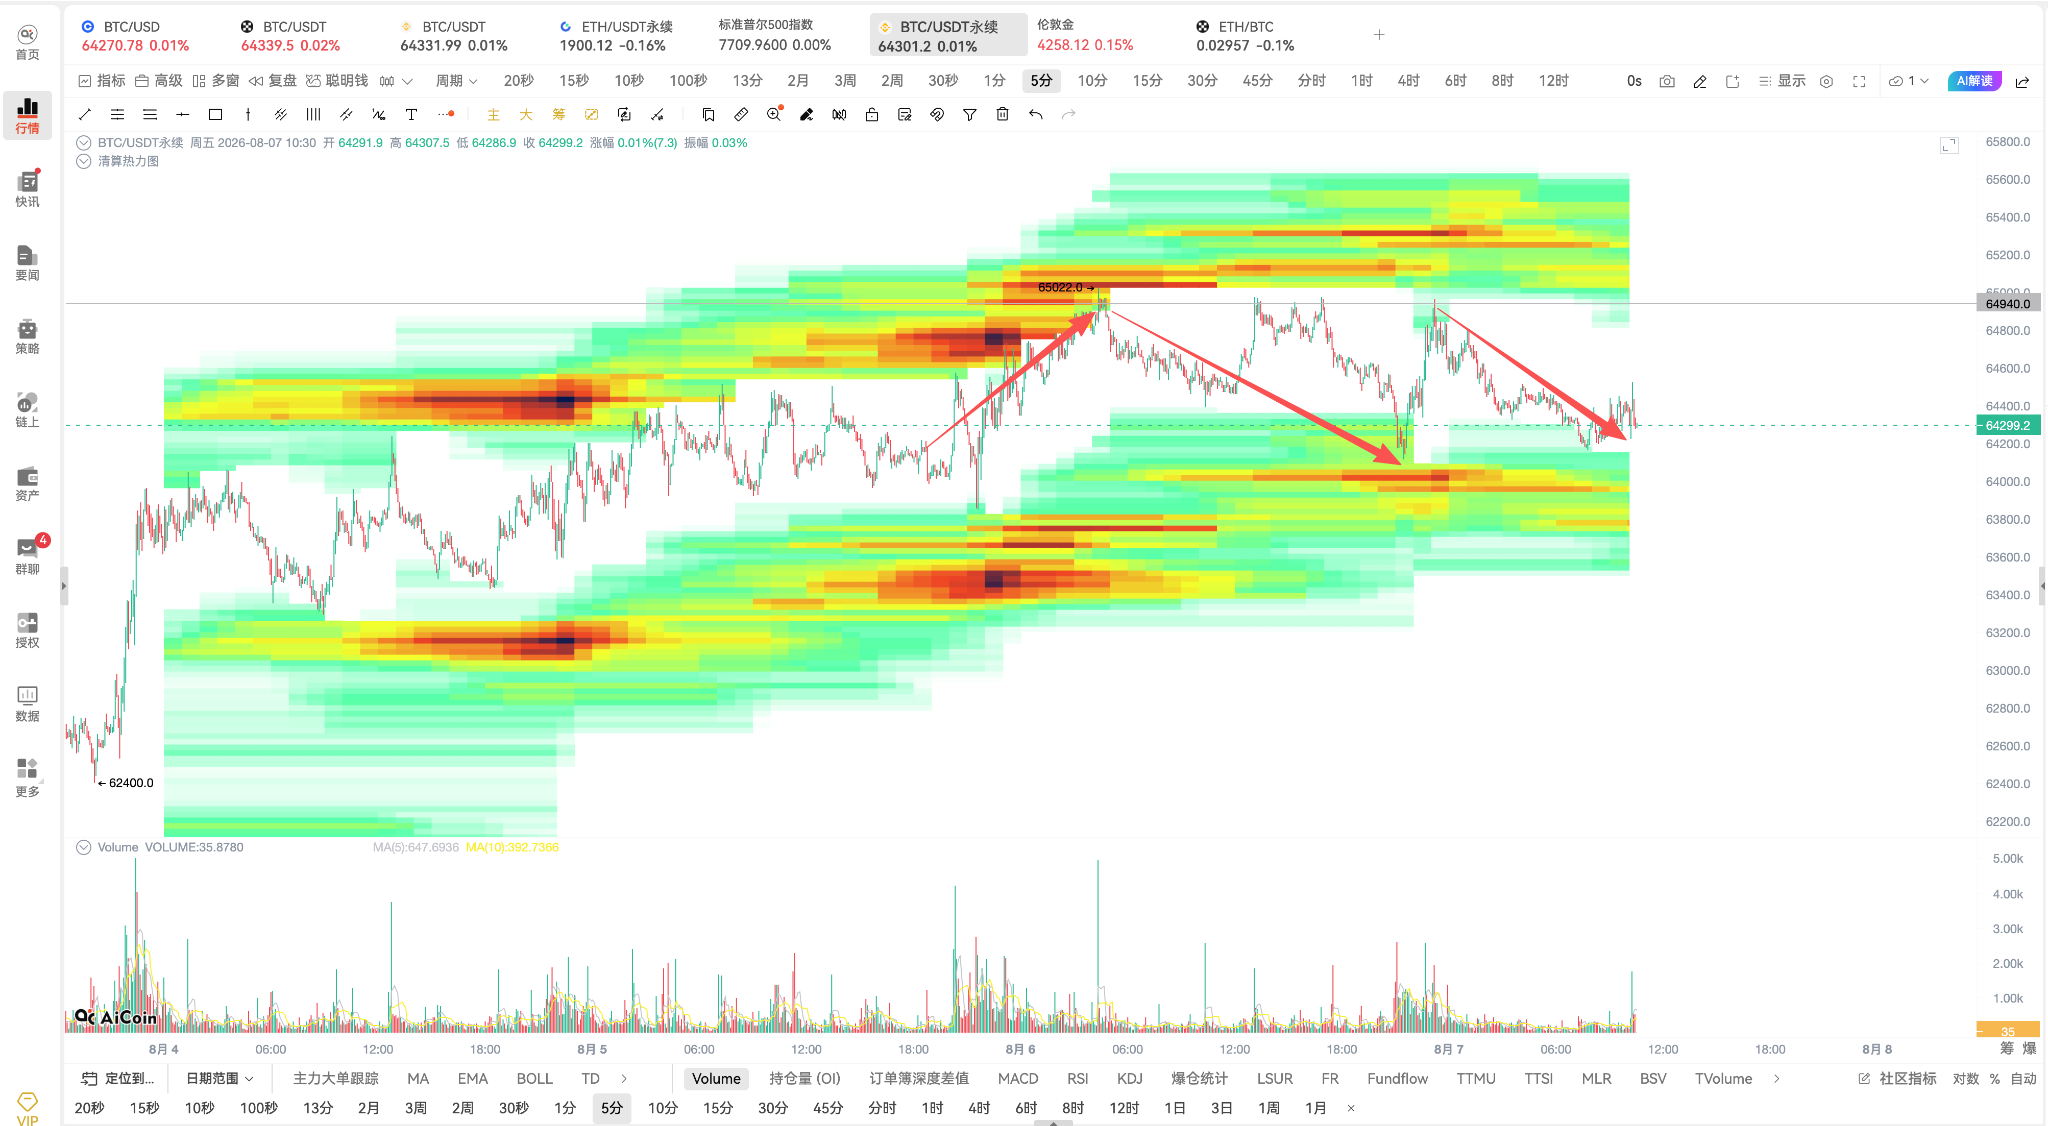
The heatmap is suitable for real-time tracking during high liquidity periods, helping to predict where short-term "fuel" lies, but it must be validated against actual trades to avoid being misled by false dense areas created by large funds.
Core analysis dimension two: How to interpret on-chain data
On-chain data directly reflects real capital and behavior on the blockchain, being more "honest" than simple prices. The main focuses include:
1. Exchange inflow/outflow
- A large inflow of coins to an exchange → may increase selling pressure (holders preparing to sell).
- A large outflow from an exchange → may indicate funds moving to cold wallets or long-term holding, tightening supply.
- Watching large transfers (whale alerts) can better capture whale movements.
2. Active addresses and transaction counts
- A continued increase in active addresses usually indicates rising network usage.
- Combining with new addresses can determine whether new funds are entering or existing users are becoming active.
3. Whales and holding distribution
- Track movements of addresses holding a large number of tokens. Concentrated buying or dispersed selling by whales often leads price movements.
- Decreasing exchange reserves are positive for the supply side in the long term.
4. Valuation indicators
- MVRV (Market Value to Realized Value ratio): An excessive value may indicate overheating, while an excessively low value may indicate overselling.
- Realized price, SOPR, etc., help assess the overall profit and loss status of holders.
5. Other useful signals
- Changes in stablecoin supply (issuance or redemption of USDT, USDC).
- Gas fees and network congestion levels (reflecting actual usage demand).
On-chain data updates almost in real-time, making it suitable for tracking throughout the day. Short-term traders can validate against price reactions in high liquidity periods; medium to long-term investors are better suited for in-depth reviews in relatively calm periods.
Recent case:
CryptoQuant data indicates that Bitcoin whale balances (excluding exchanges and mining pools) have steadily increased from about 2.87 million coins in December 2025 to around 3.06 million coins, with accumulation picking up significantly after the price fell below $60,000. Addresses holding 10,000 to 100,000 Ethereum also recorded record accumulations. Analysis suggests that when prices near or fall below realized prices, whales continue to absorb, fitting the characteristics of later-stage bear markets, but an absolute bottom has not been confirmed, and prices may still fluctuate further. Additionally, a whale that had been dormant for seven months transferred about 16,400 BTC (worth over $1 billion) to a new address, which is interpreted more as a safe migration rather than a sell-off.
On-chain data is suitable for tracking around the clock; short-term validations can be conducted during volatile periods, while medium to long-term deep reviews are best done during quieter times.
The A-share golden half hour is about capturing closing signals in a limited window; cryptocurrencies' 24 hours involve seeking tides and real capital trajectories in continuous flow. The liquidation heatmap tells you "where might get washed out," while on-chain data reveals "whether big money is accumulating." Cross-validating both with price behavior gets you closer to the essence of the market than just chasing highs and lows.
Other important cryptocurrency analysis dimensions
- Funding Rate: Costs of longs and shorts in perpetual contracts. A persistently positive funding rate that is too high indicates crowded longs; a negative funding rate indicates crowded shorts.
- Open Interest: Rising open interest accompanying price increases indicates a healthier trend; caution is needed for reversals when divergences occur.
- Order book depth and buy/sell walls: Real-time order situation, observing large order support/resistance.
- Volume and volatility distribution: Identifying genuine breakthroughs driven by capital or false breakouts.
What time is more suitable for which type of analysis?
- High liquidity periods (Europe and America overlapping, before and after US market opening): Prioritize viewing liquidation heatmaps, funding rates, order books, real-time prices, and volumes. Suitable for capturing short-term fluctuations.
- Relatively calm periods (early Asian session or late night low liquidity): More suitable for reviewing on-chain data, whale movements, and mid to long-term valuation indicators, for trend judgments or dollar-cost averaging decisions.
- Can be done all day: Core on-chain data, macro news, regulatory dynamics. Cryptocurrencies lack a "closing price"; analysis emphasizes continuity and multidimensional cross-validation.
Practical reminders
Liquidation heatmaps and on-chain data are both auxiliary tools, not a holy grail. Heatmaps reflect leverage distribution, which may be deliberately manipulated by large funds; on-chain data also faces delays, labeling errors, and interference from privacy coins. It is best to examine them alongside price behavior, volume, and macro environments, while strictly controlling positions and stop-losses.
The golden half hour of A-shares captures closing signals in a limited window; cryptocurrency's 24 hours seek tides and real capital trajectories in continuous flow. Understanding these analysis dimensions can help you shift from "trading anytime" to "seeing the right things at the right time." Markets carry risks, and investments should be done cautiously.
免责声明:本文章仅代表作者个人观点,不代表本平台的立场和观点。本文章仅供信息分享,不构成对任何人的任何投资建议。用户与作者之间的任何争议,与本平台无关。如网页中刊载的文章或图片涉及侵权,请提供相关的权利证明和身份证明发送邮件到support@aicoin.com,本平台相关工作人员将会进行核查。