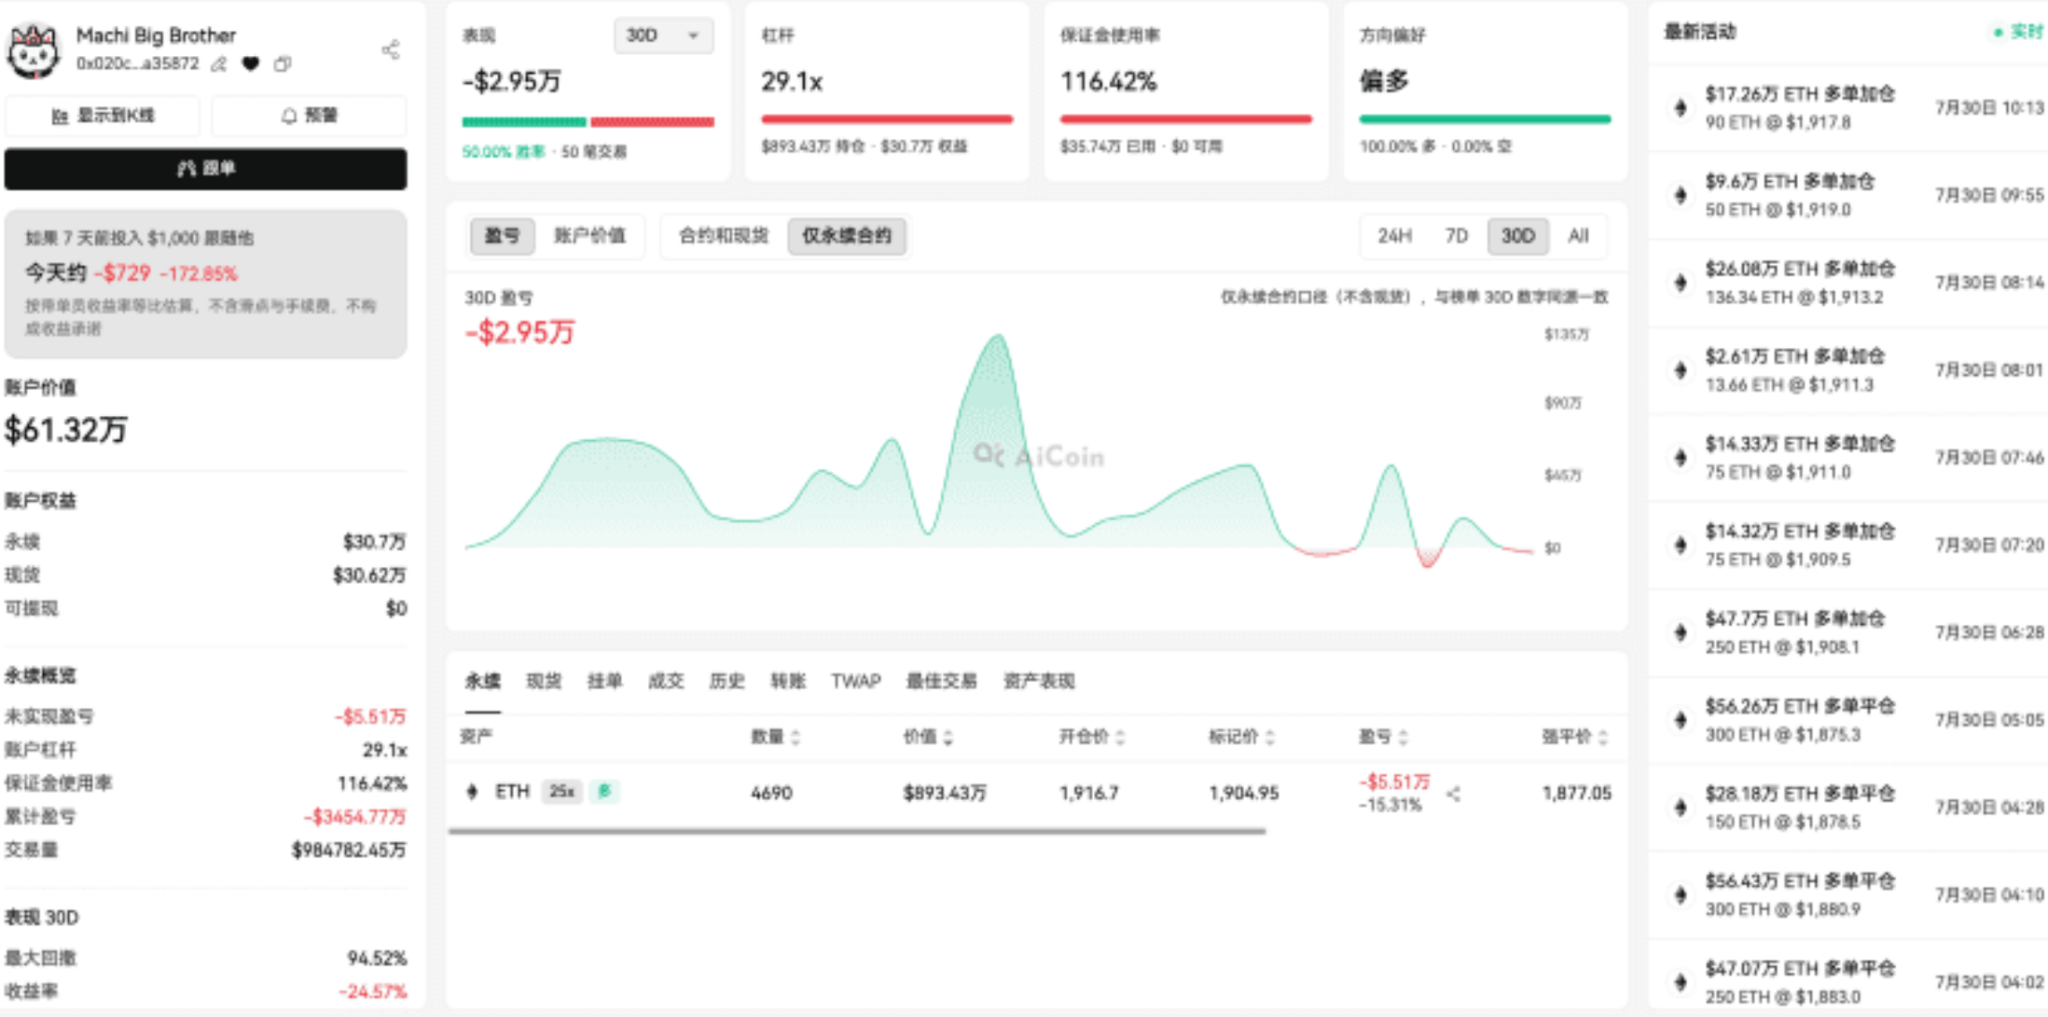
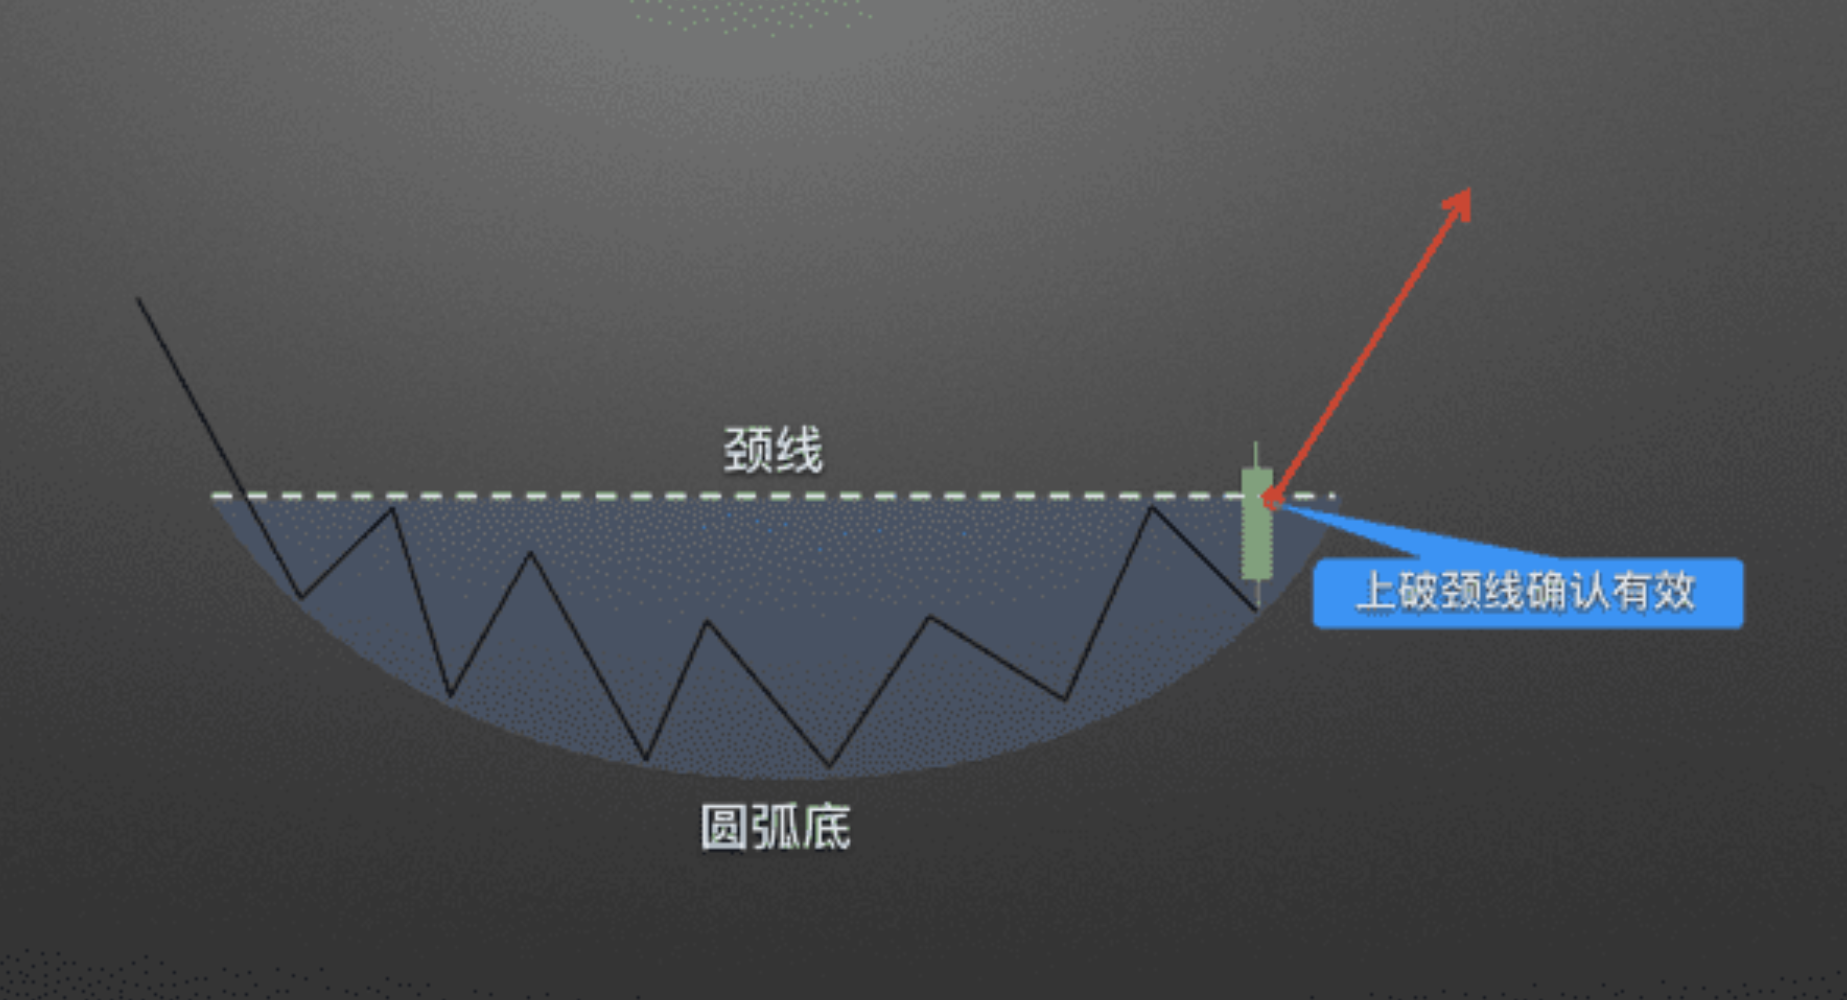
In the morning, I reviewed the recent popular targets and understood them clearly. At this stage, most of the losses are incurred by traders who blindly chase after ups. This EMA resonance trading strategy can now come in handy. Without further ado, let’s directly use the highly focused SK Hynix for a practical demonstration.
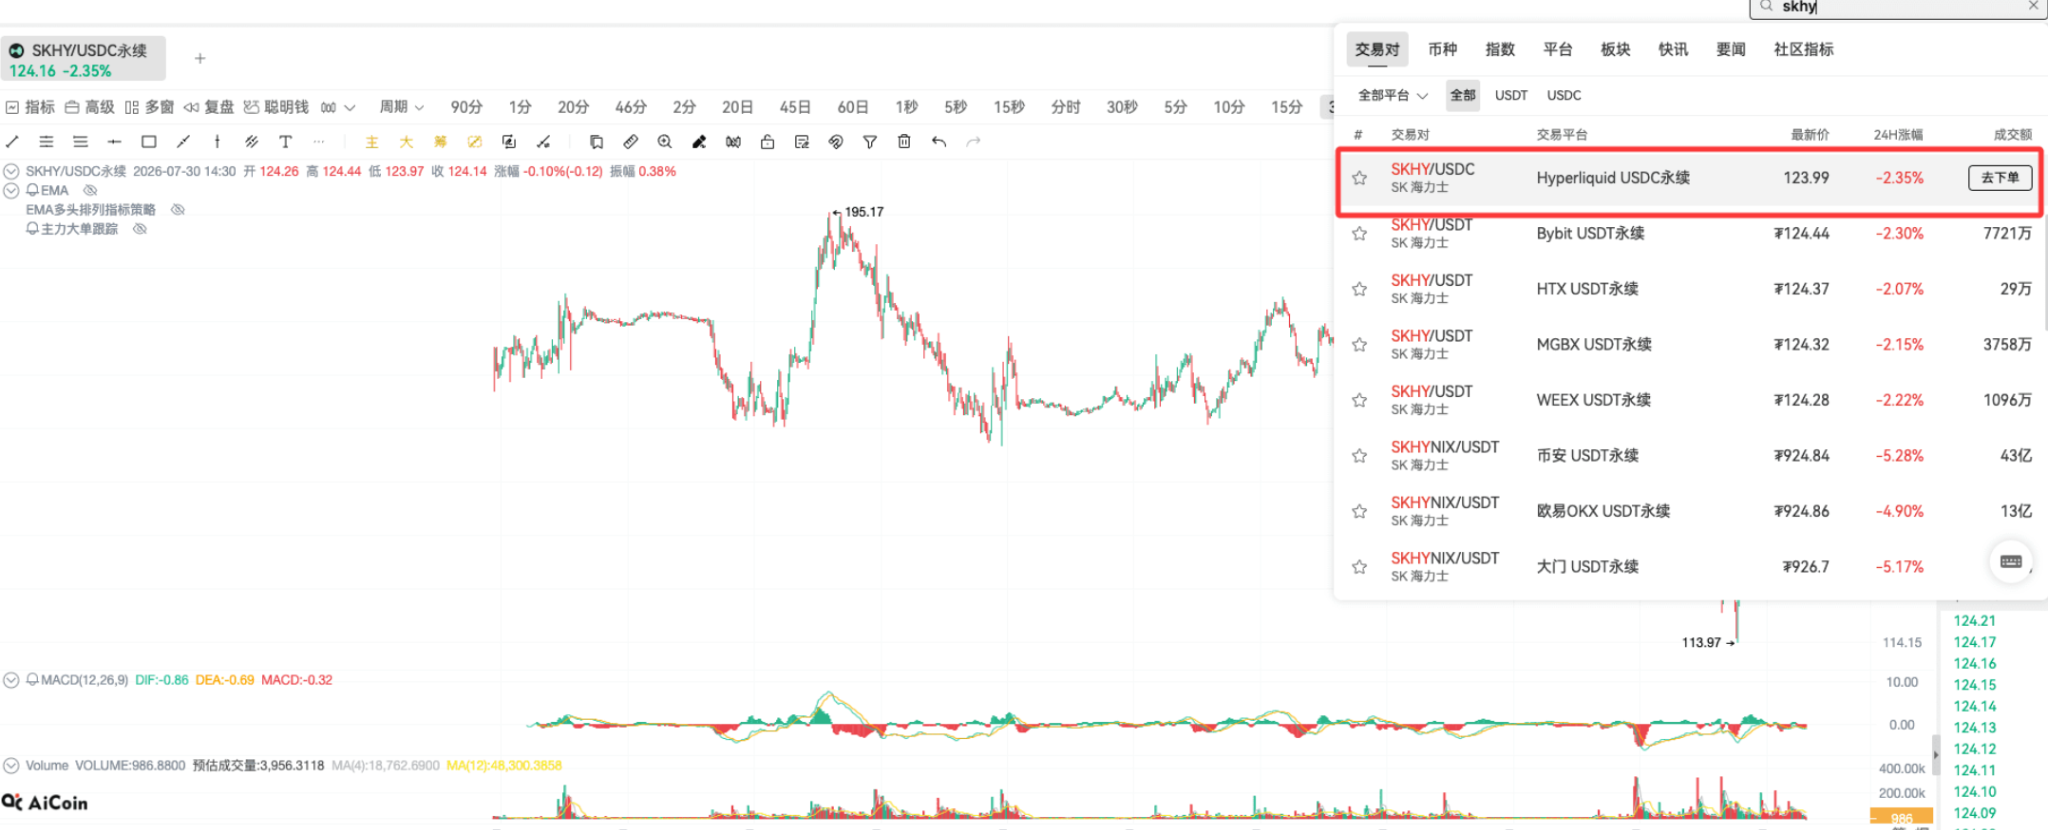
Everyone, follow along. Open the SKHY/USDT perpetual trading pair. Is the interface set up?
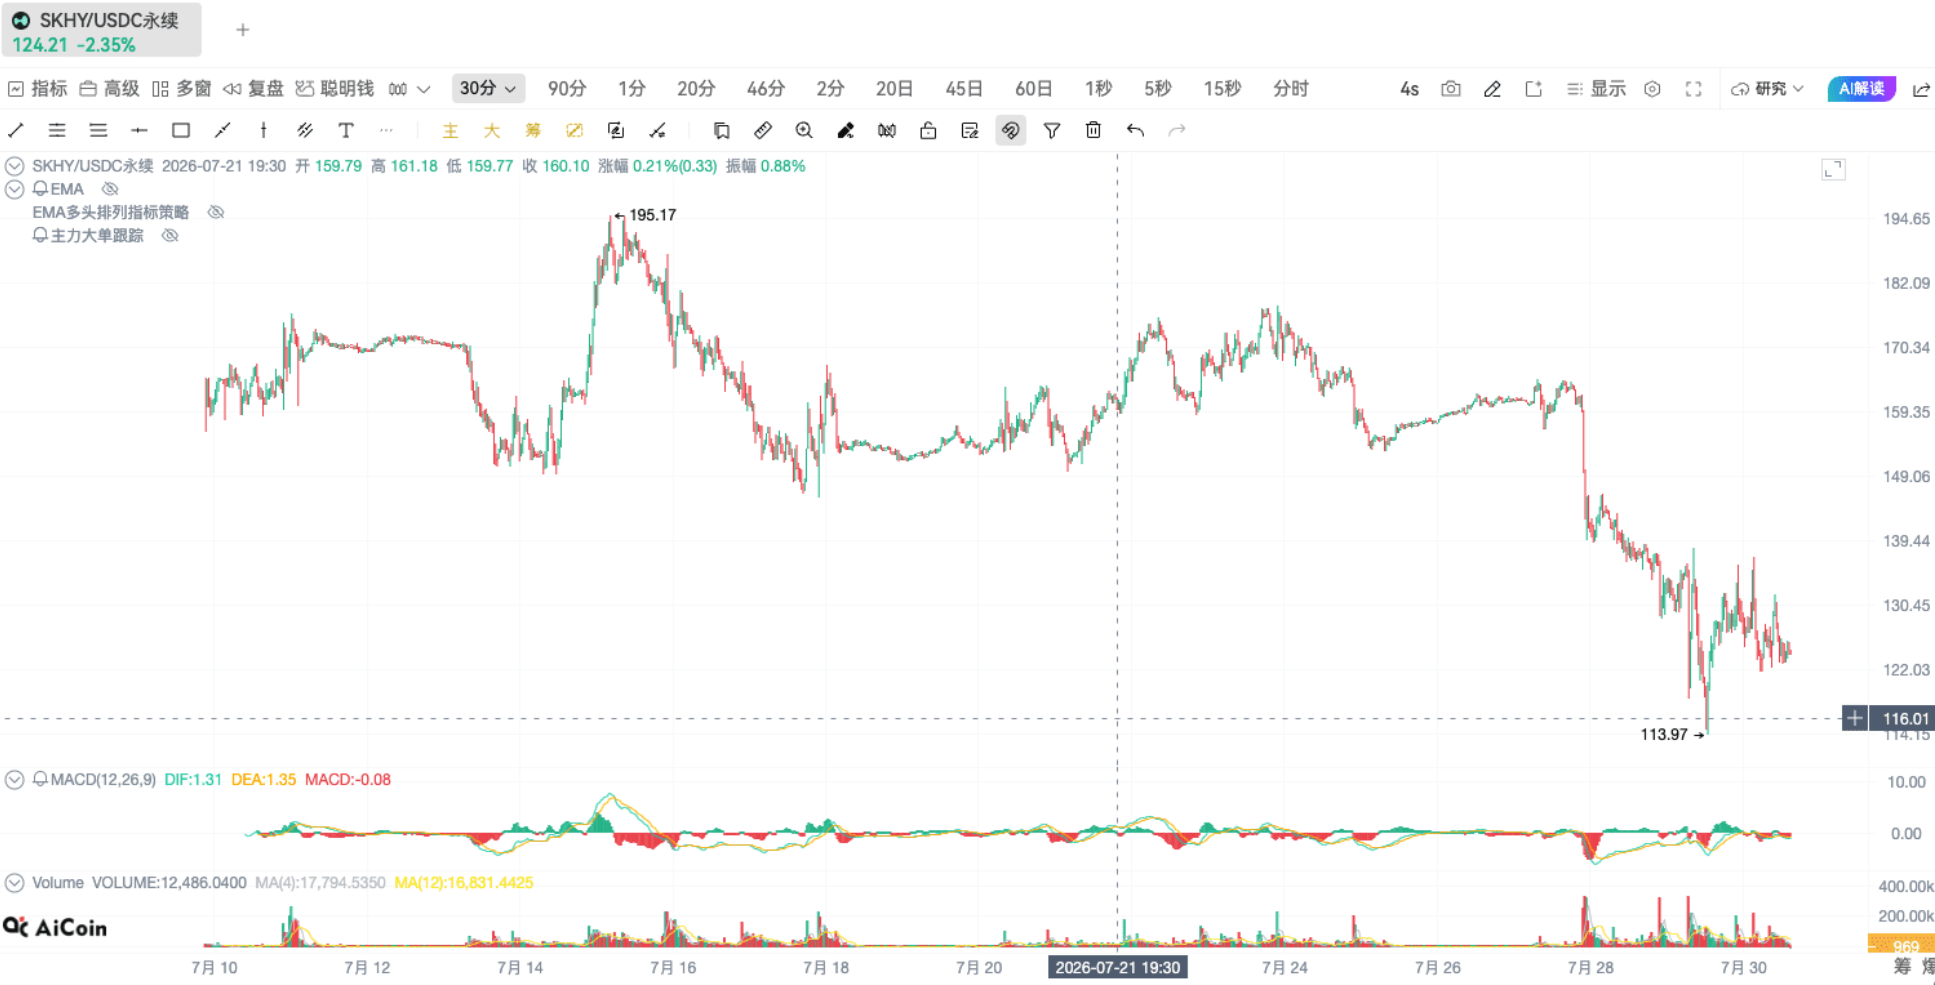
Choose a period of 30 minutes and observe the market using this bullish resonance strategy. Many people wonder why they often lose when going long. Utilizing the EMA bullish resonance concept can effectively avoid such issues.
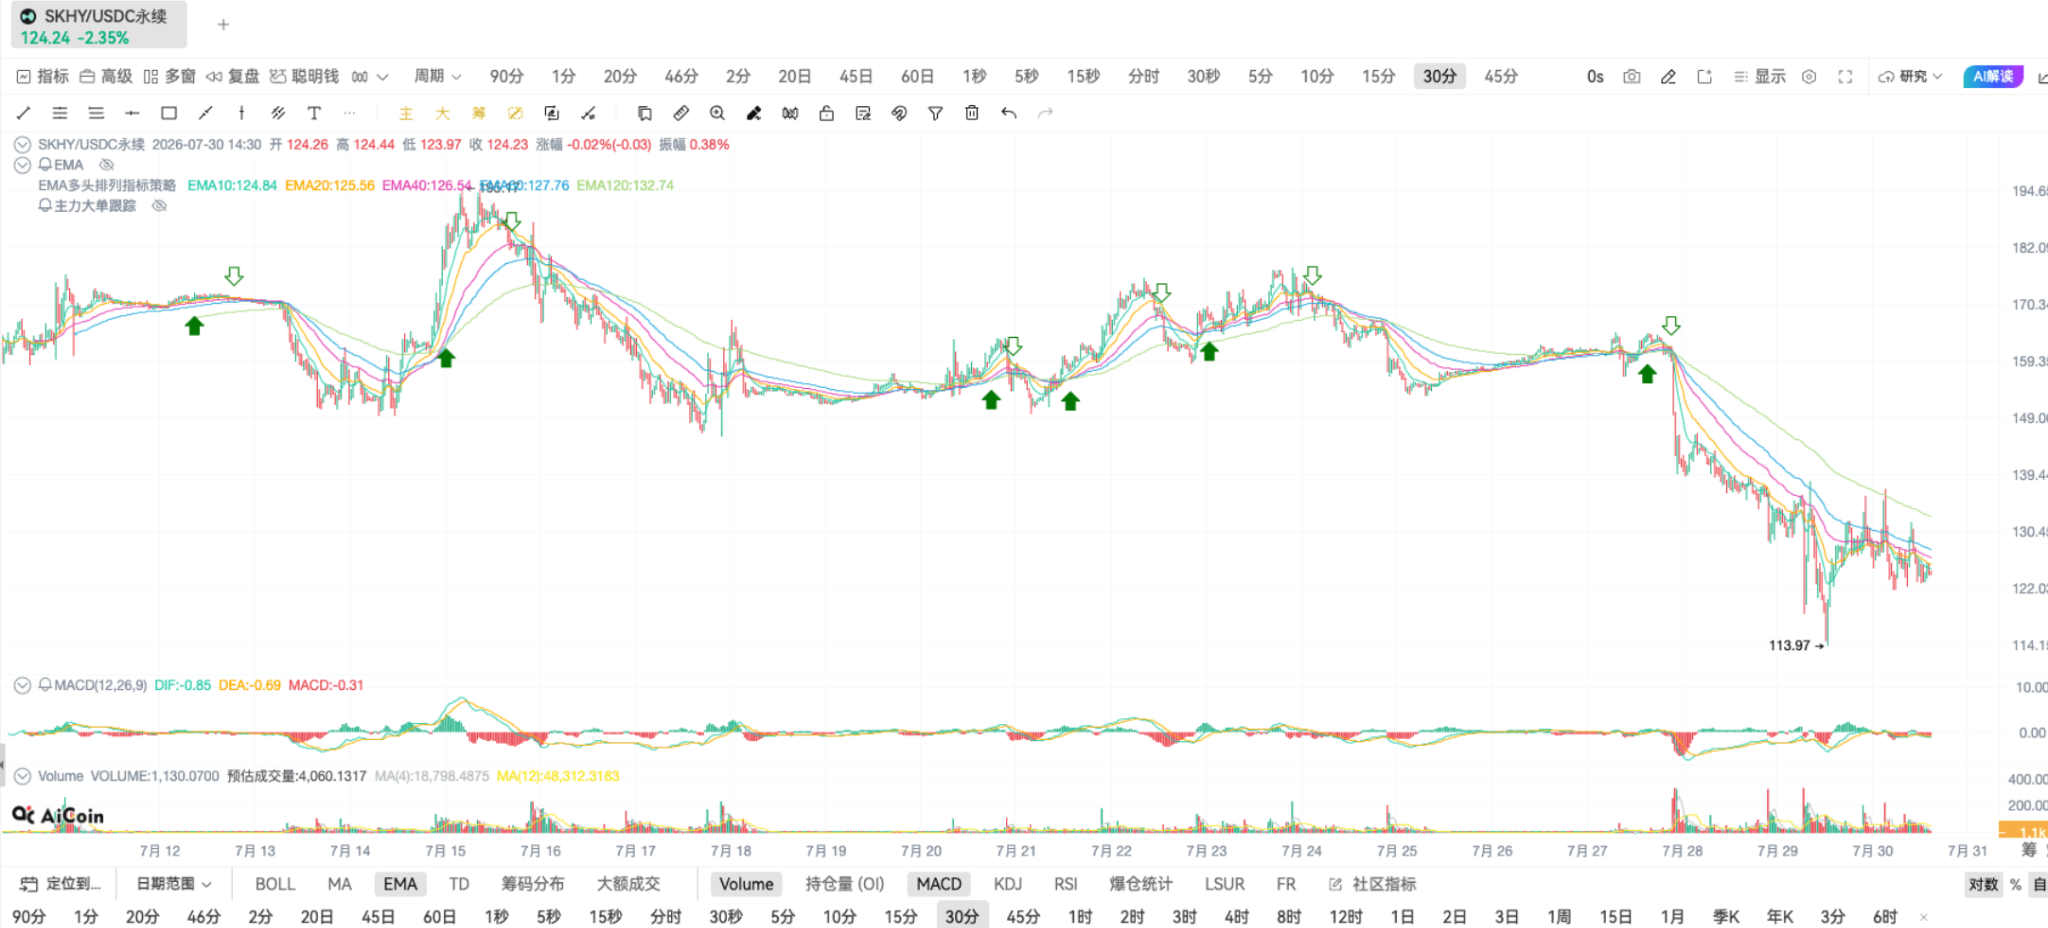
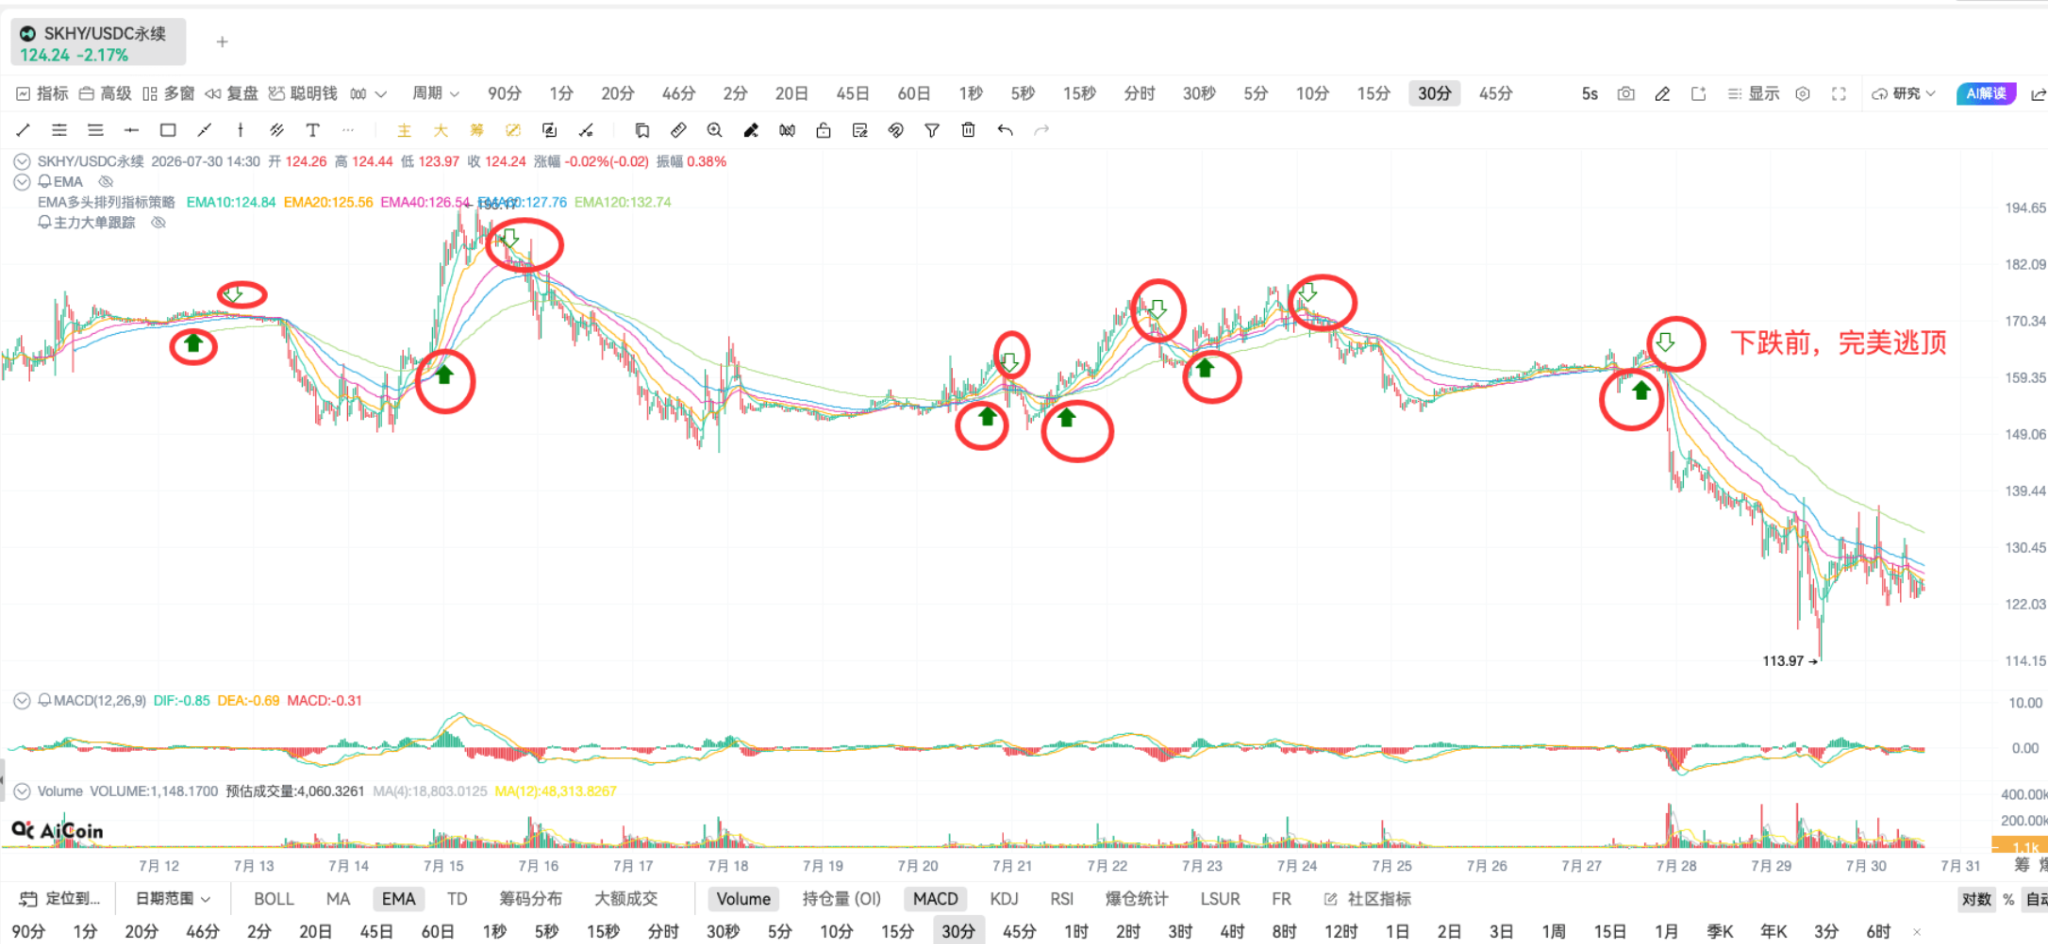
When a bullish resonance signal appears, enter the market. Once the resonance pattern dissipates, exit decisively, capturing most of the upward wave, avoiding the downward trend. Of course, this system also has shortcomings; repeated trading during a continuously narrow sideways fluctuation will incur some fees, but at least it won’t let everyone hold positions against the trend.
I wonder if my friends are interested in this resonance concept. This method is particularly suited for the A-share market and various ETFs that can only go long, clearly distinguishing appropriate buying and selling points, providing solid references for friends working on fund and index investments.
At this stage, Bitcoin and Ethereum are temporarily not suitable for this strategy as the market is still in a continuous fluctuation phase. After explaining the complete theory, we will simulate together to determine when this strategy works best on mainstream cryptocurrencies.
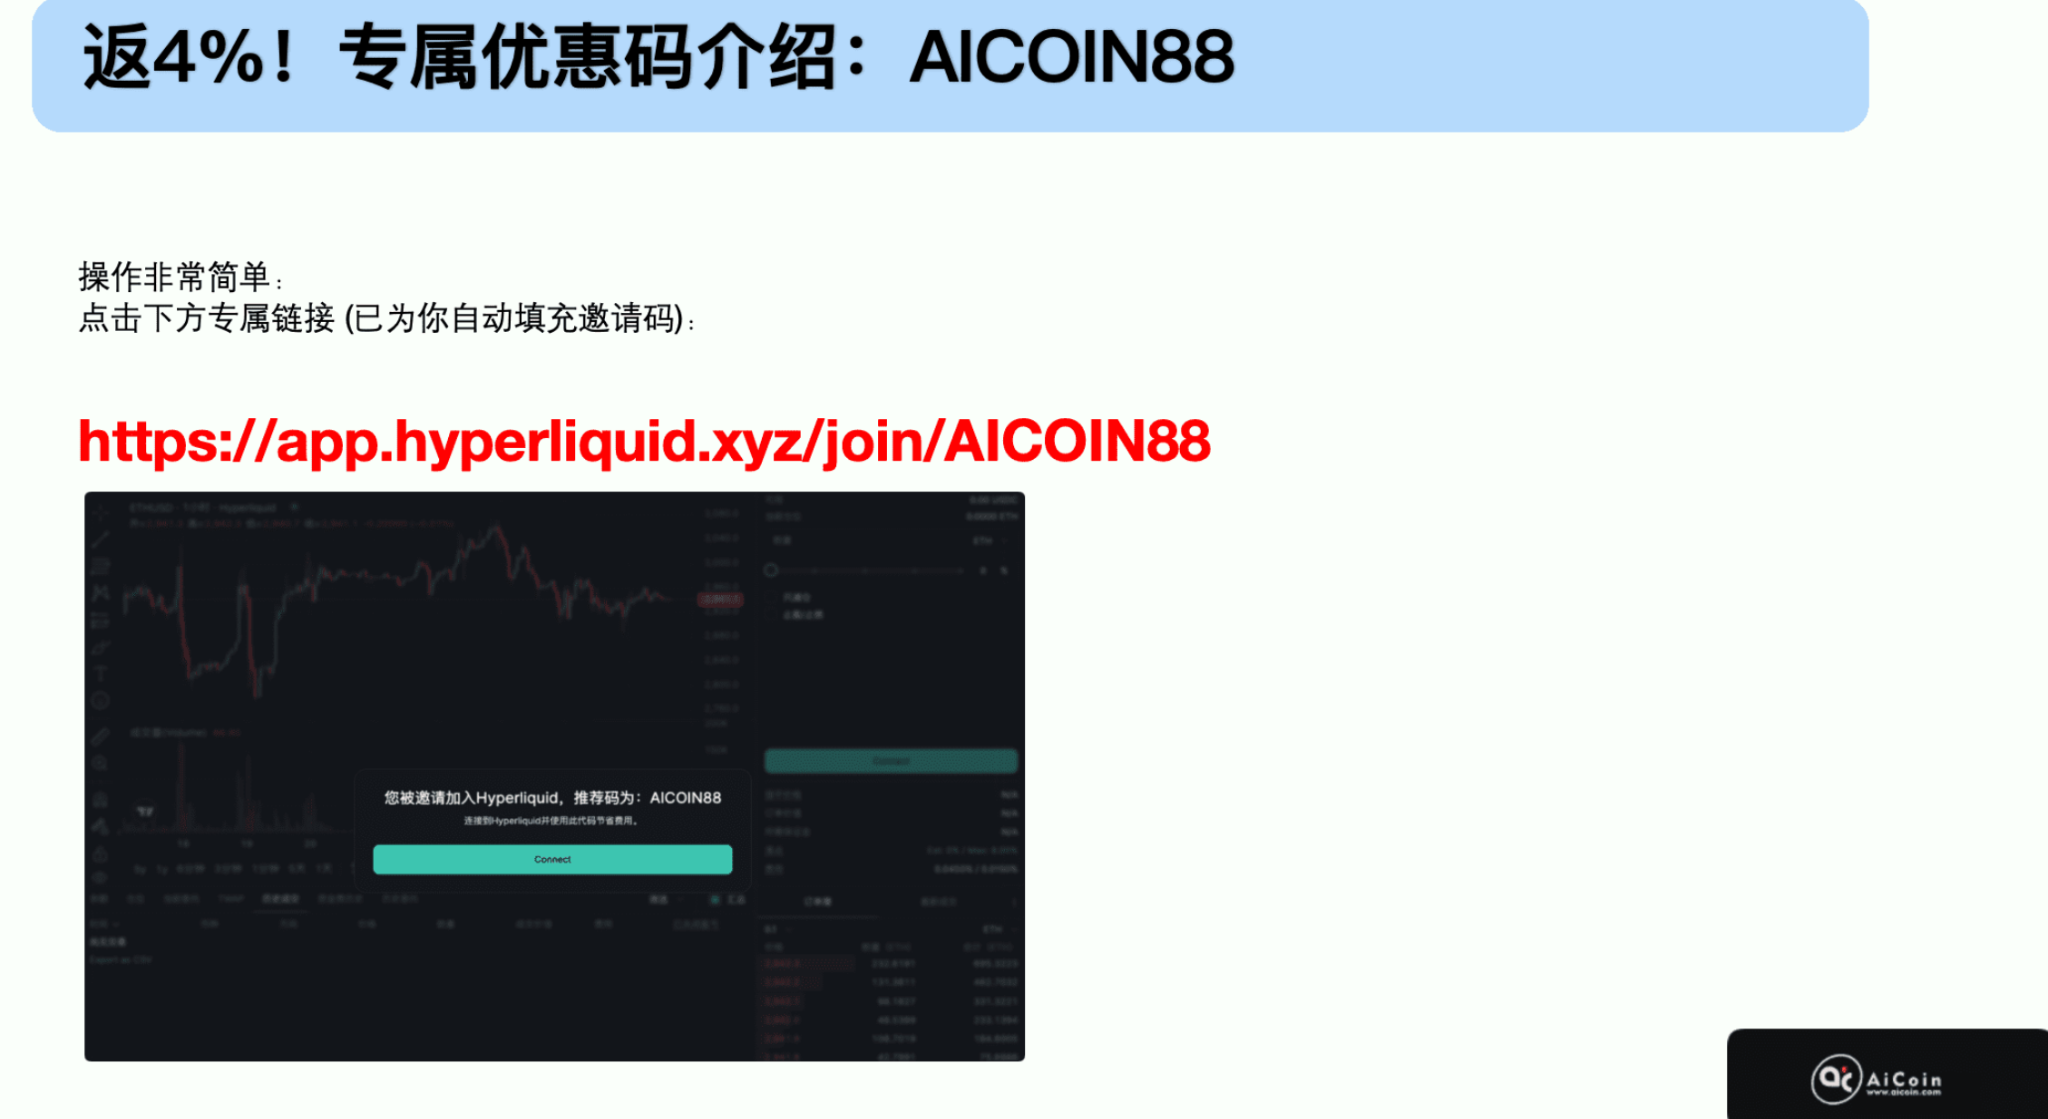
Remember to bind Hyperliquid through the AiCoin exclusive link or invitation code to enjoy a 4% rebate. Friends who are unclear about the binding process can directly consult customer service for assistance.
Assets fluctuate sharply back and forth; we have been trading in the crypto scene for a long time and will be more sensitive to market fluctuations. In fact, it’s completely possible to broaden the view and layout such overseas assets, which is a good asset transition choice.
Next, I will talk about two ideas for judging the core trends of EMA:
Identify trends relying on golden cross and death cross signals.
Bullish signals are the golden crosses that everyone often talks about:
When the price breaks above the EMA moving average, it is a basic bullish signal.
As a simple example, when the short-term EMA5 crosses above the EMA10, it often indicates that a buying point is near.
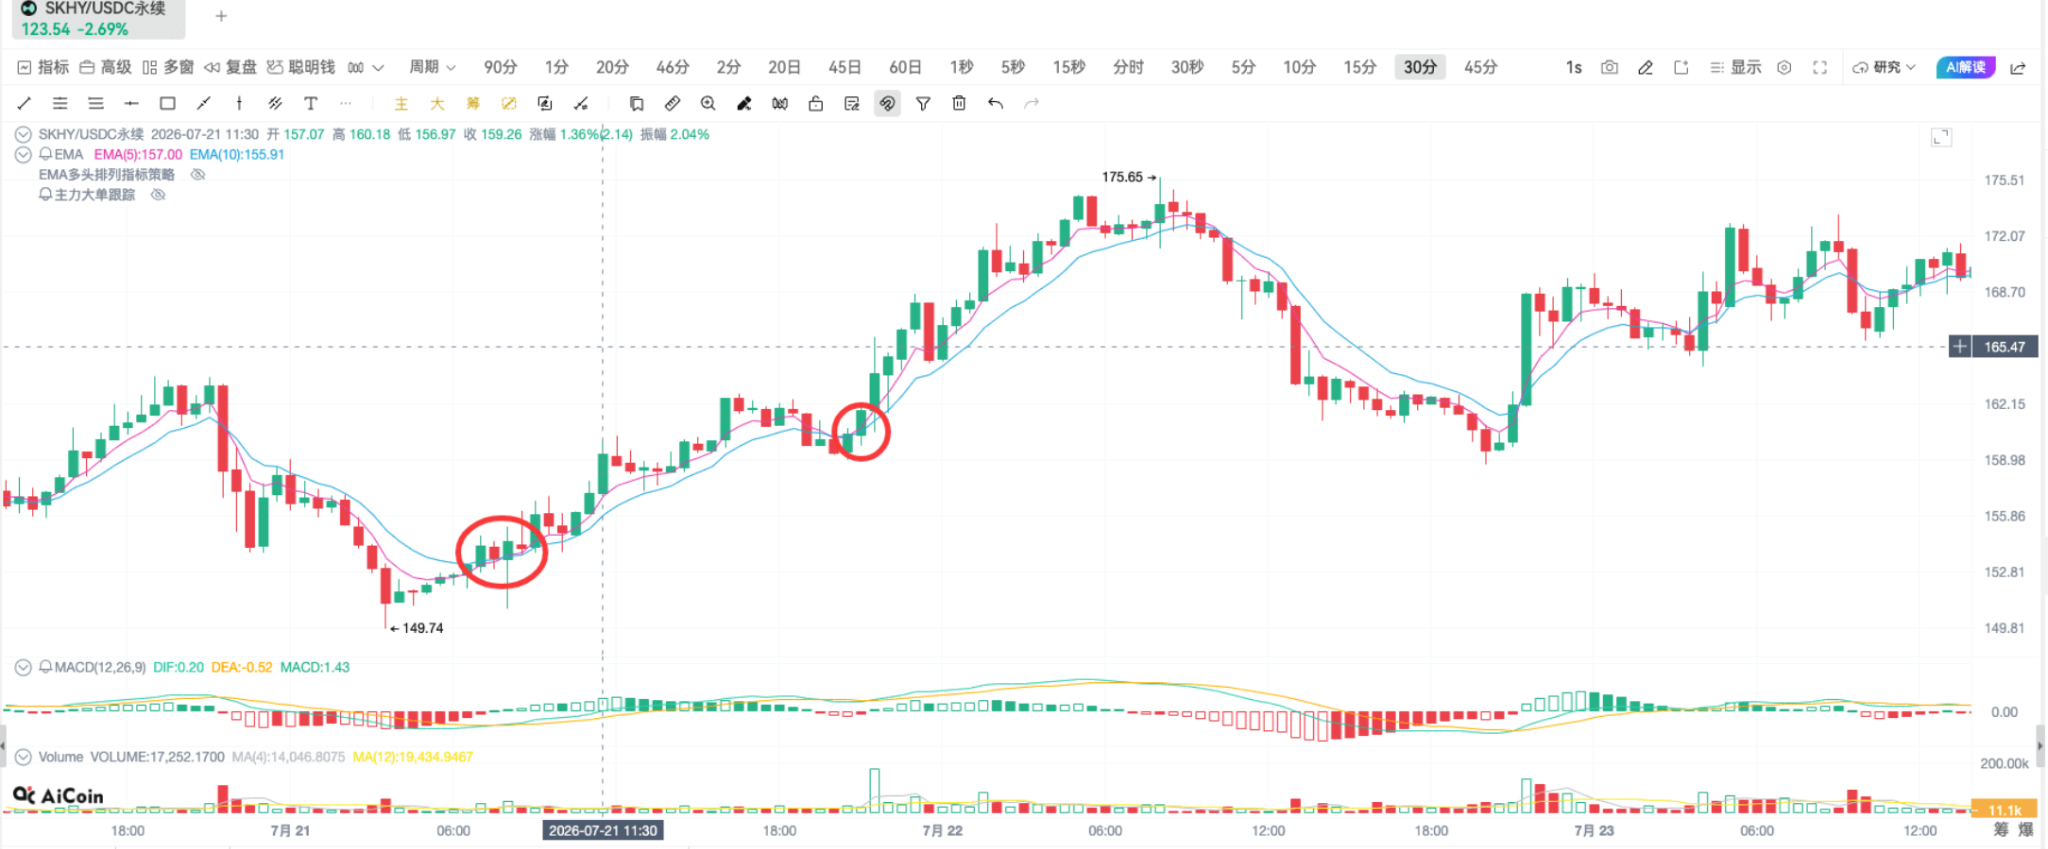
The signals formed by these segments crossing above indicate that the subsequent market has all risen as expected.
Bearish signals are death crosses:
When the price falls below the EMA moving average, it releases a risk alert.
When the short-term EMA5 crosses below the EMA10, one should consider reducing positions or avoiding adjustment risks.
Still, let me visually demonstrate this trend.
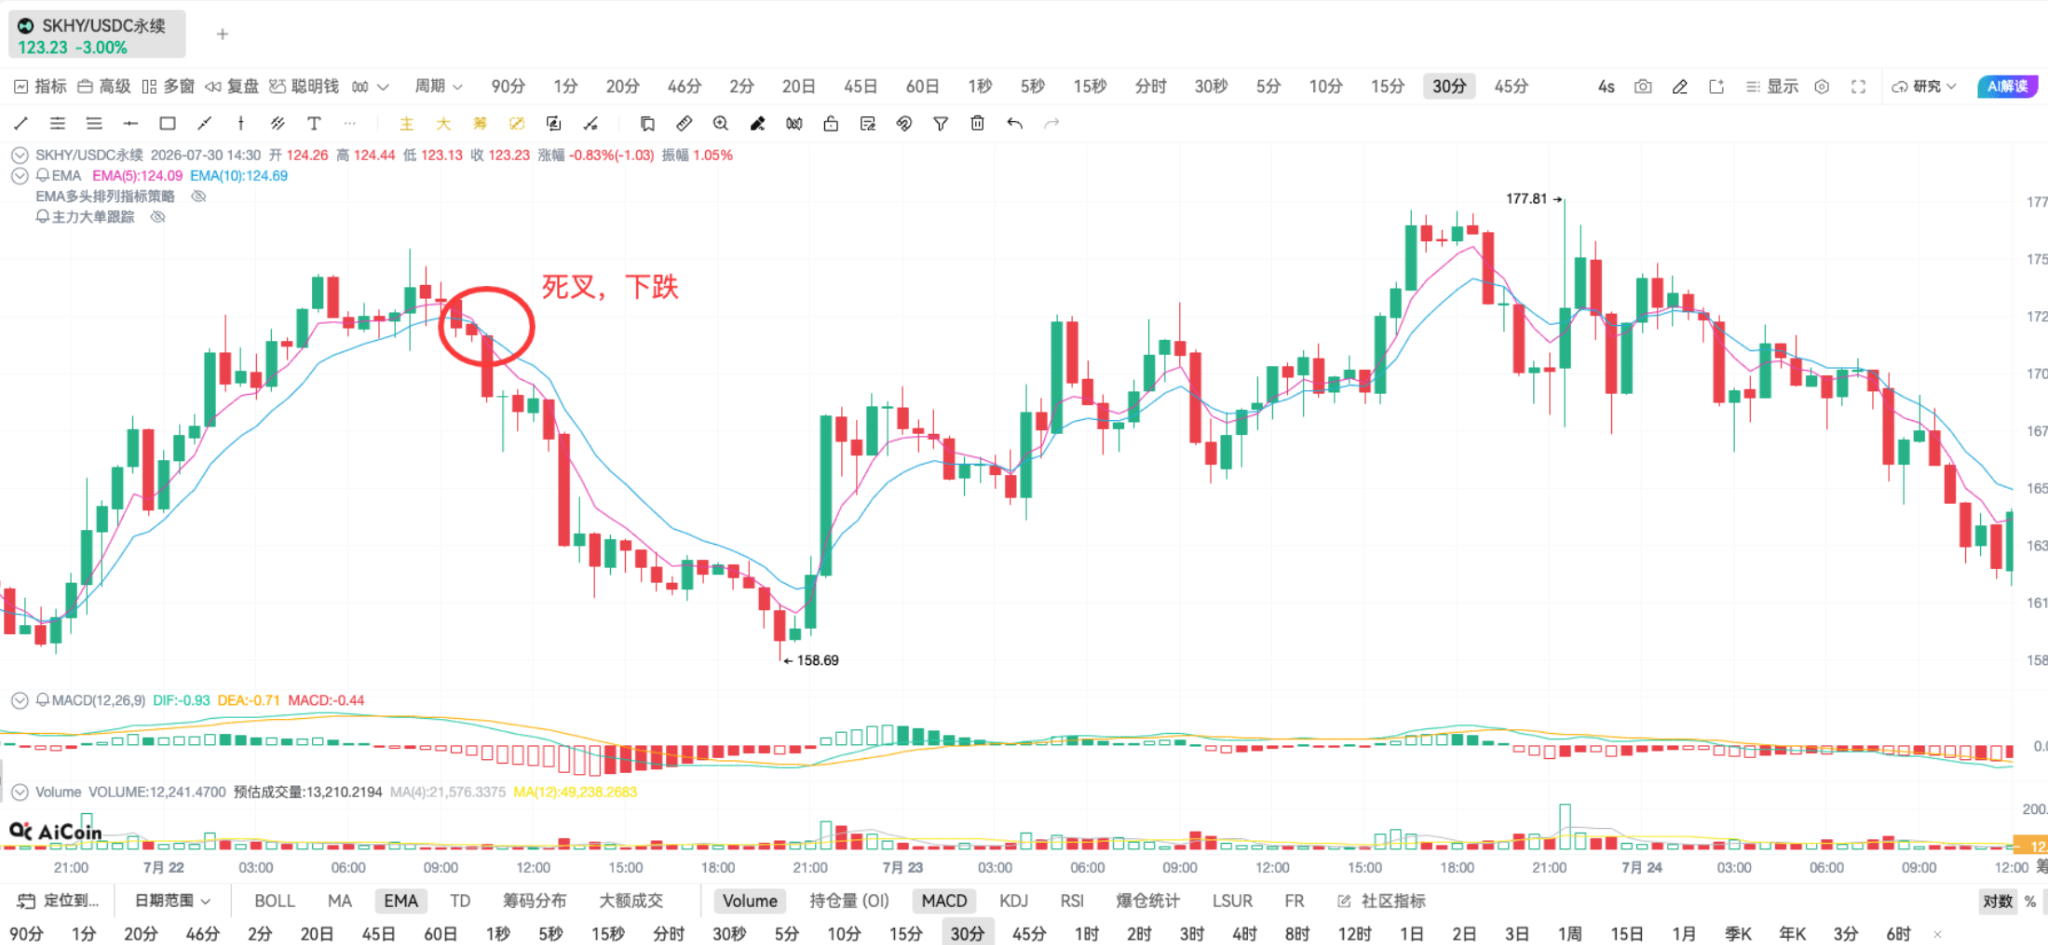
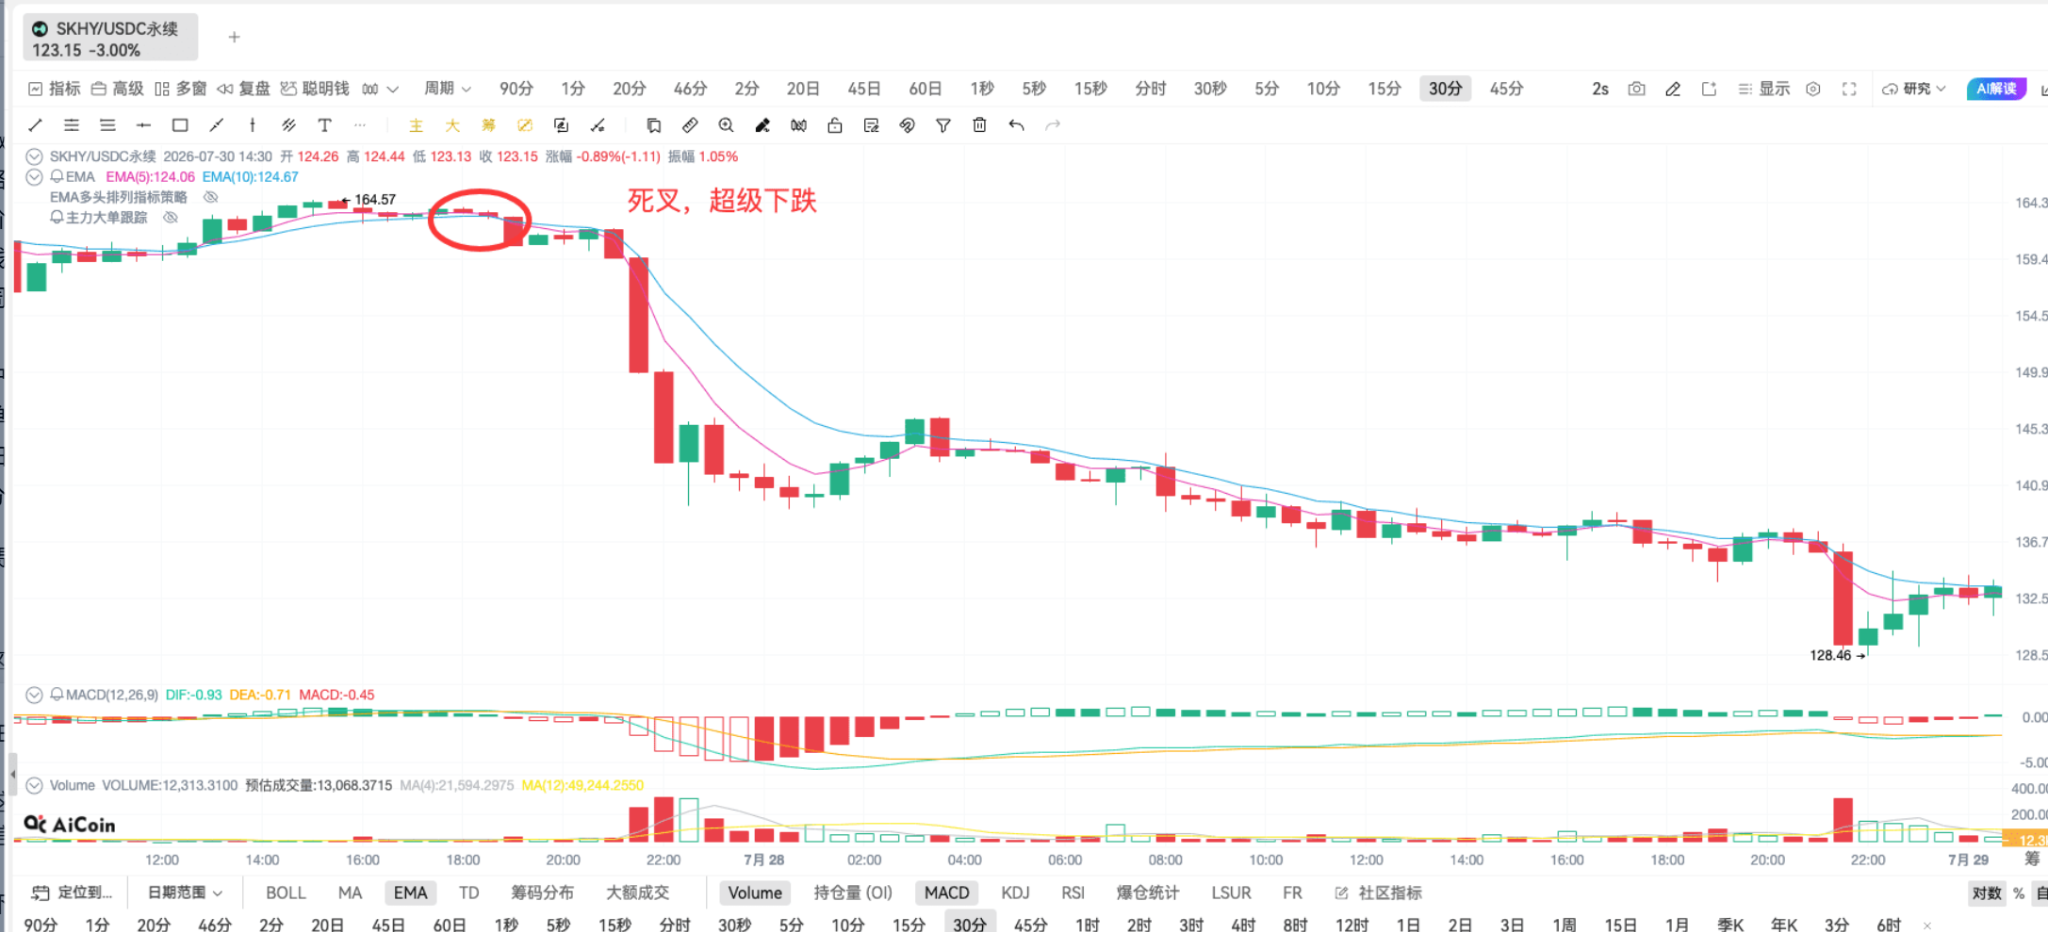
The standard bullish resonance structure can refer to this arrangement:
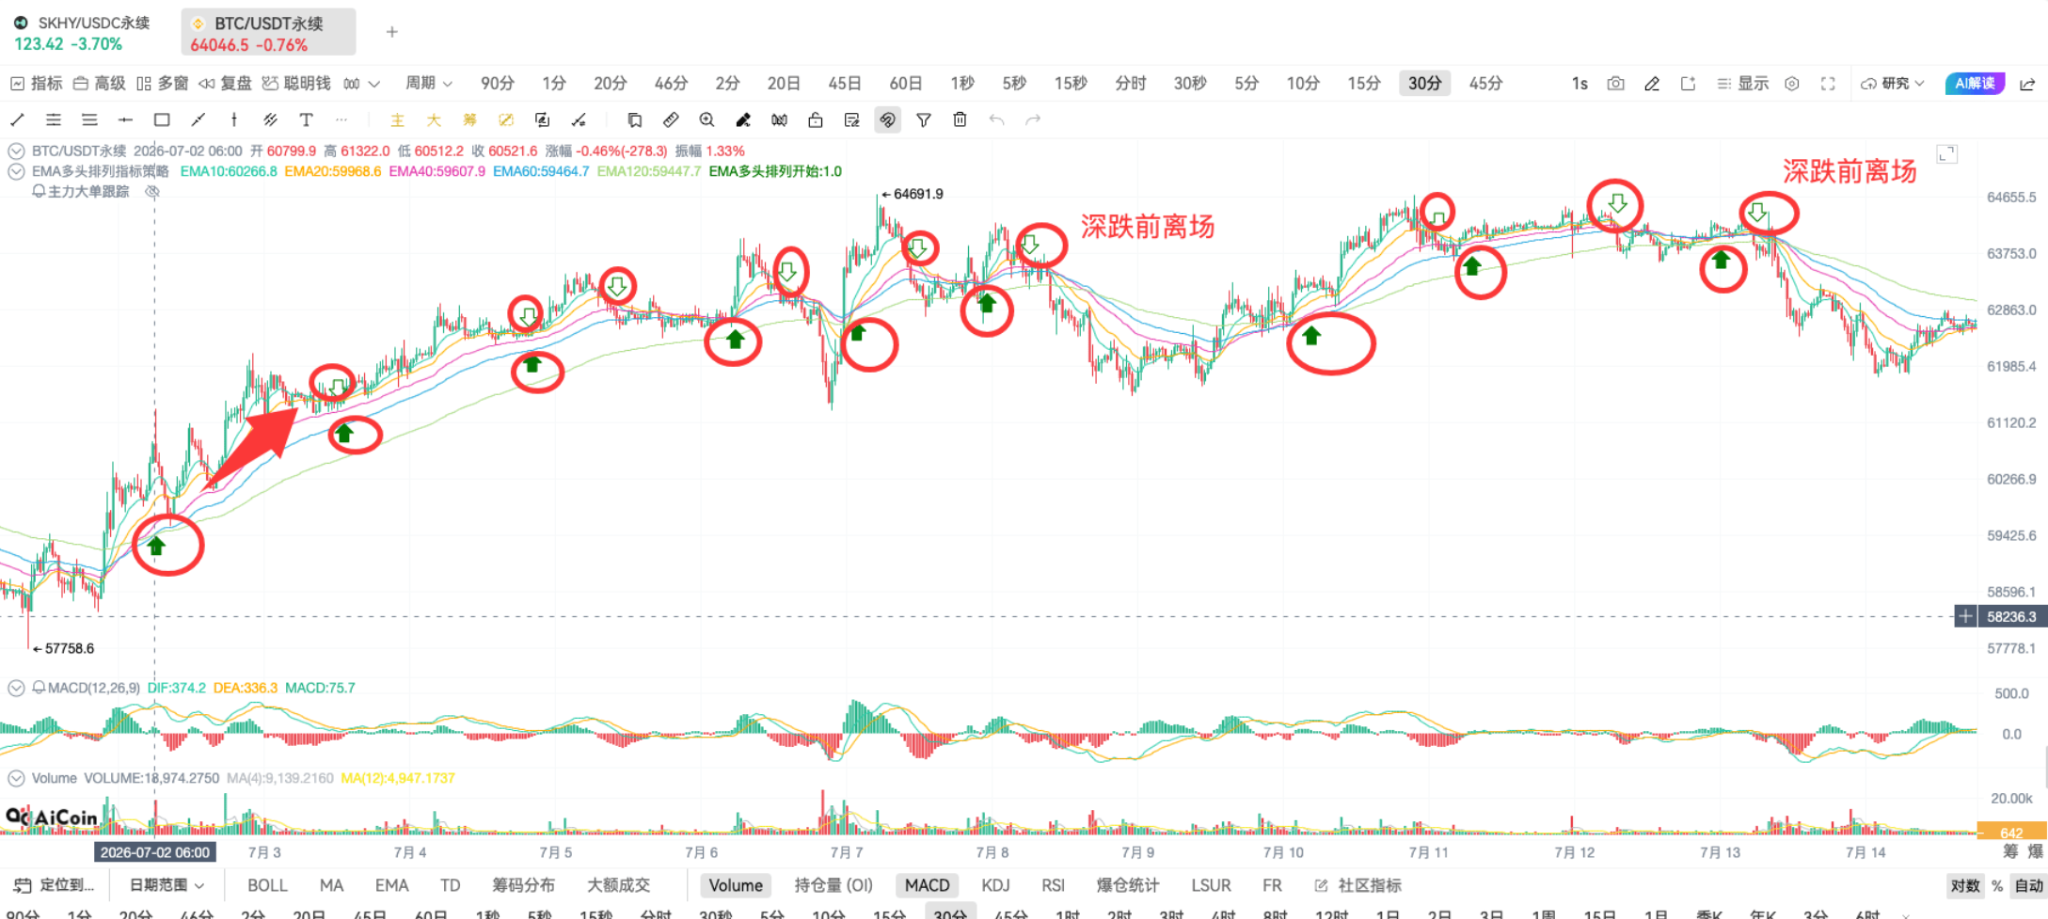
EMA (5) > EMA (20) > EMA (40) > EMA (60) > EMA (120)
Short-term moving averages are steadily above long-term moving averages, indicating that prices are moving in a solid upward channel. Multiple moving averages constantly diverging outward signify a strong upward trend, and adequate bullish momentum.
Many friends usually allocate various funds such as S&P 500, Nasdaq, CSI 300, Hang Seng Index, and so on; these types of indices are particularly suitable for this strategy.
When a bullish resonance occurs, one can choose the timing to start allocations; when the resonance pattern ends, pause additional investments and patiently wait for the next round of resonance signals to appear, maximizing capital utilization efficiency.
The core idea has been explained; now let’s visually verify the effects on the market!
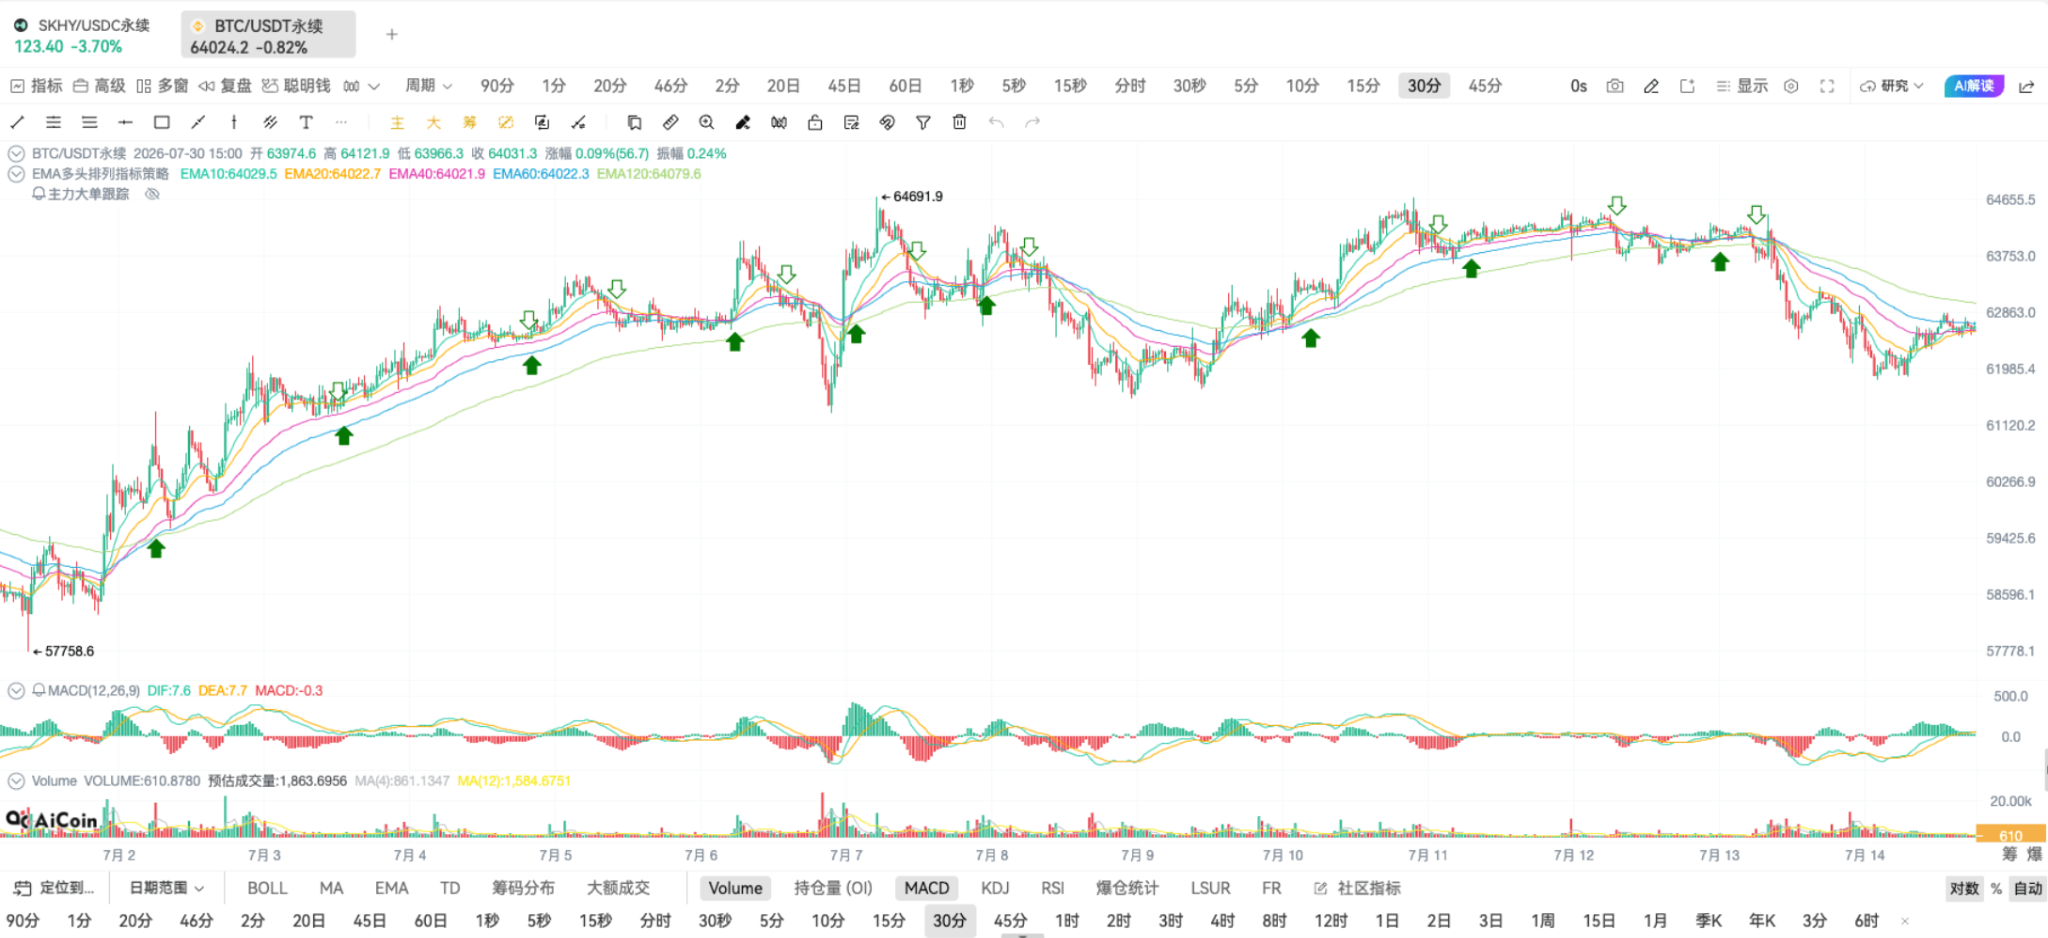
Taking a segment of the BTC upward trend, we can see the strategy capturing complete upward waves multiple times, accurately seizing quality market ranges.
The same works in the ETH market, relying on this resonance rule to steadily secure a large segment of the upward trend.
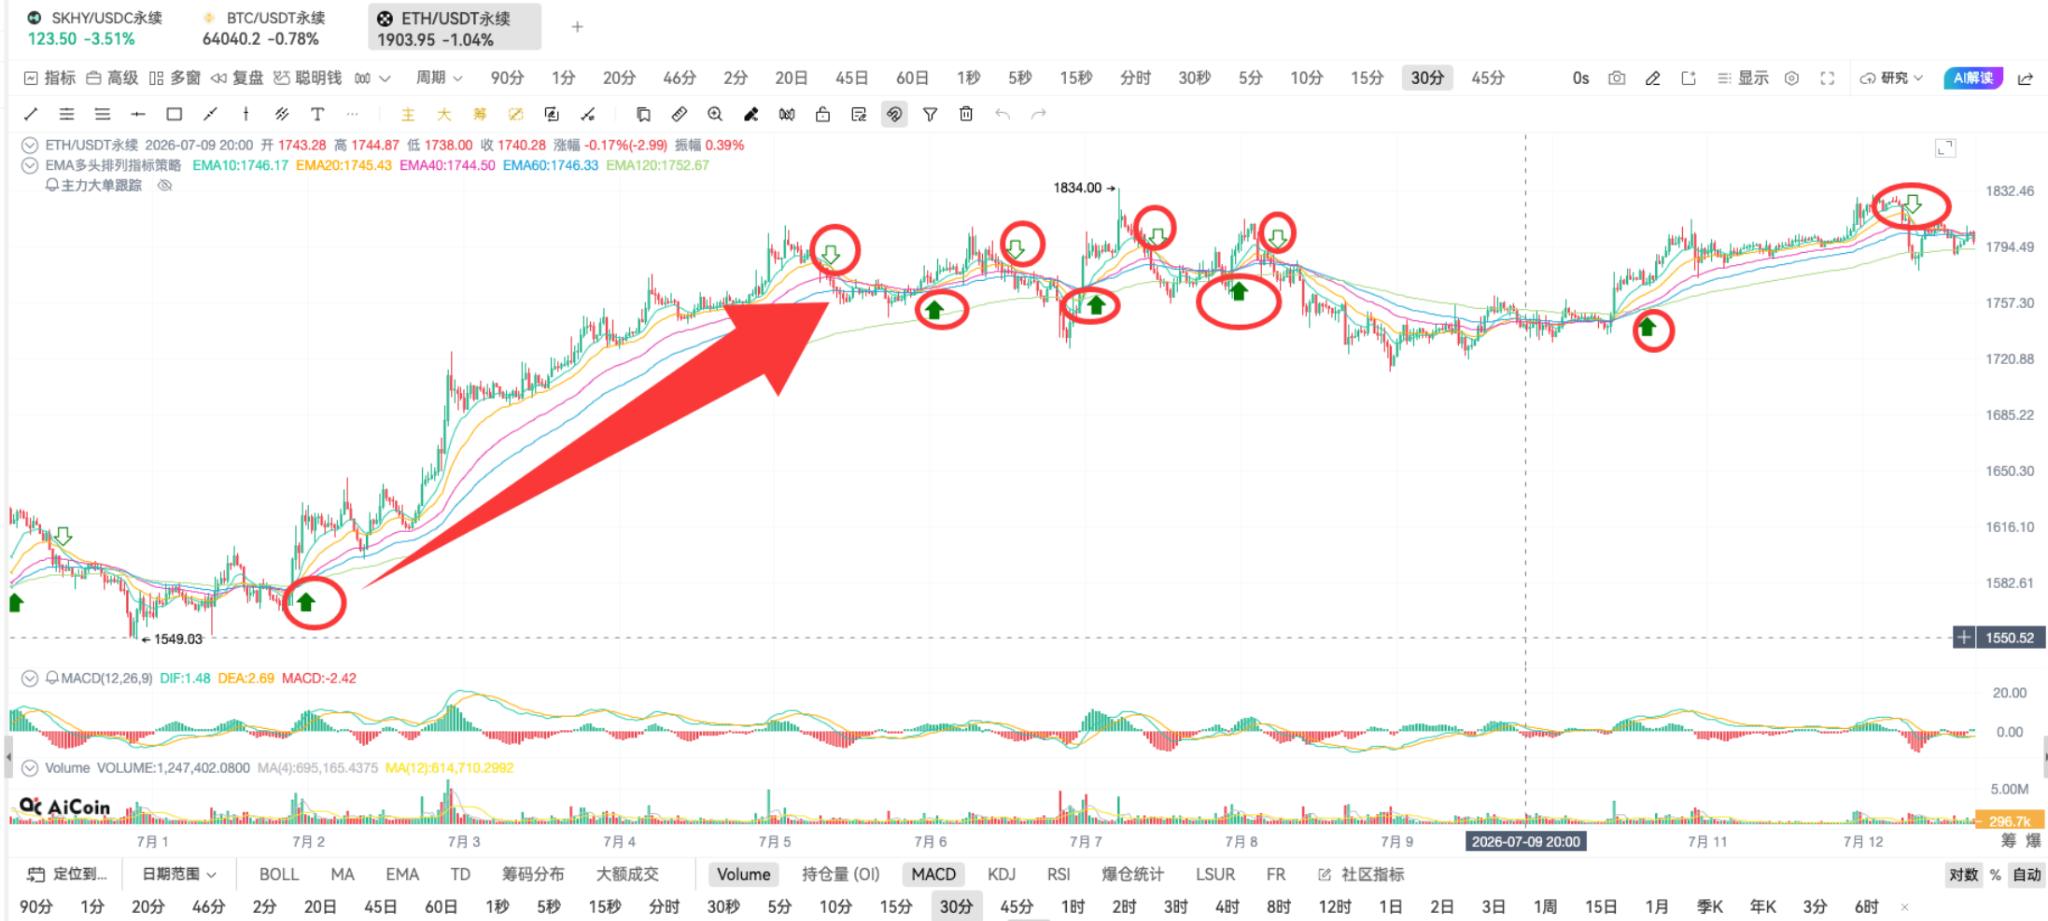
Having discussed applicable scenarios, let's talk about the strategy's shortcomings for better understanding.
In trading conditions characterized by prolonged horizontal trends and slight fluctuations, frequently triggering signals may continuously incur fees, as can be observed in the ETH trend.
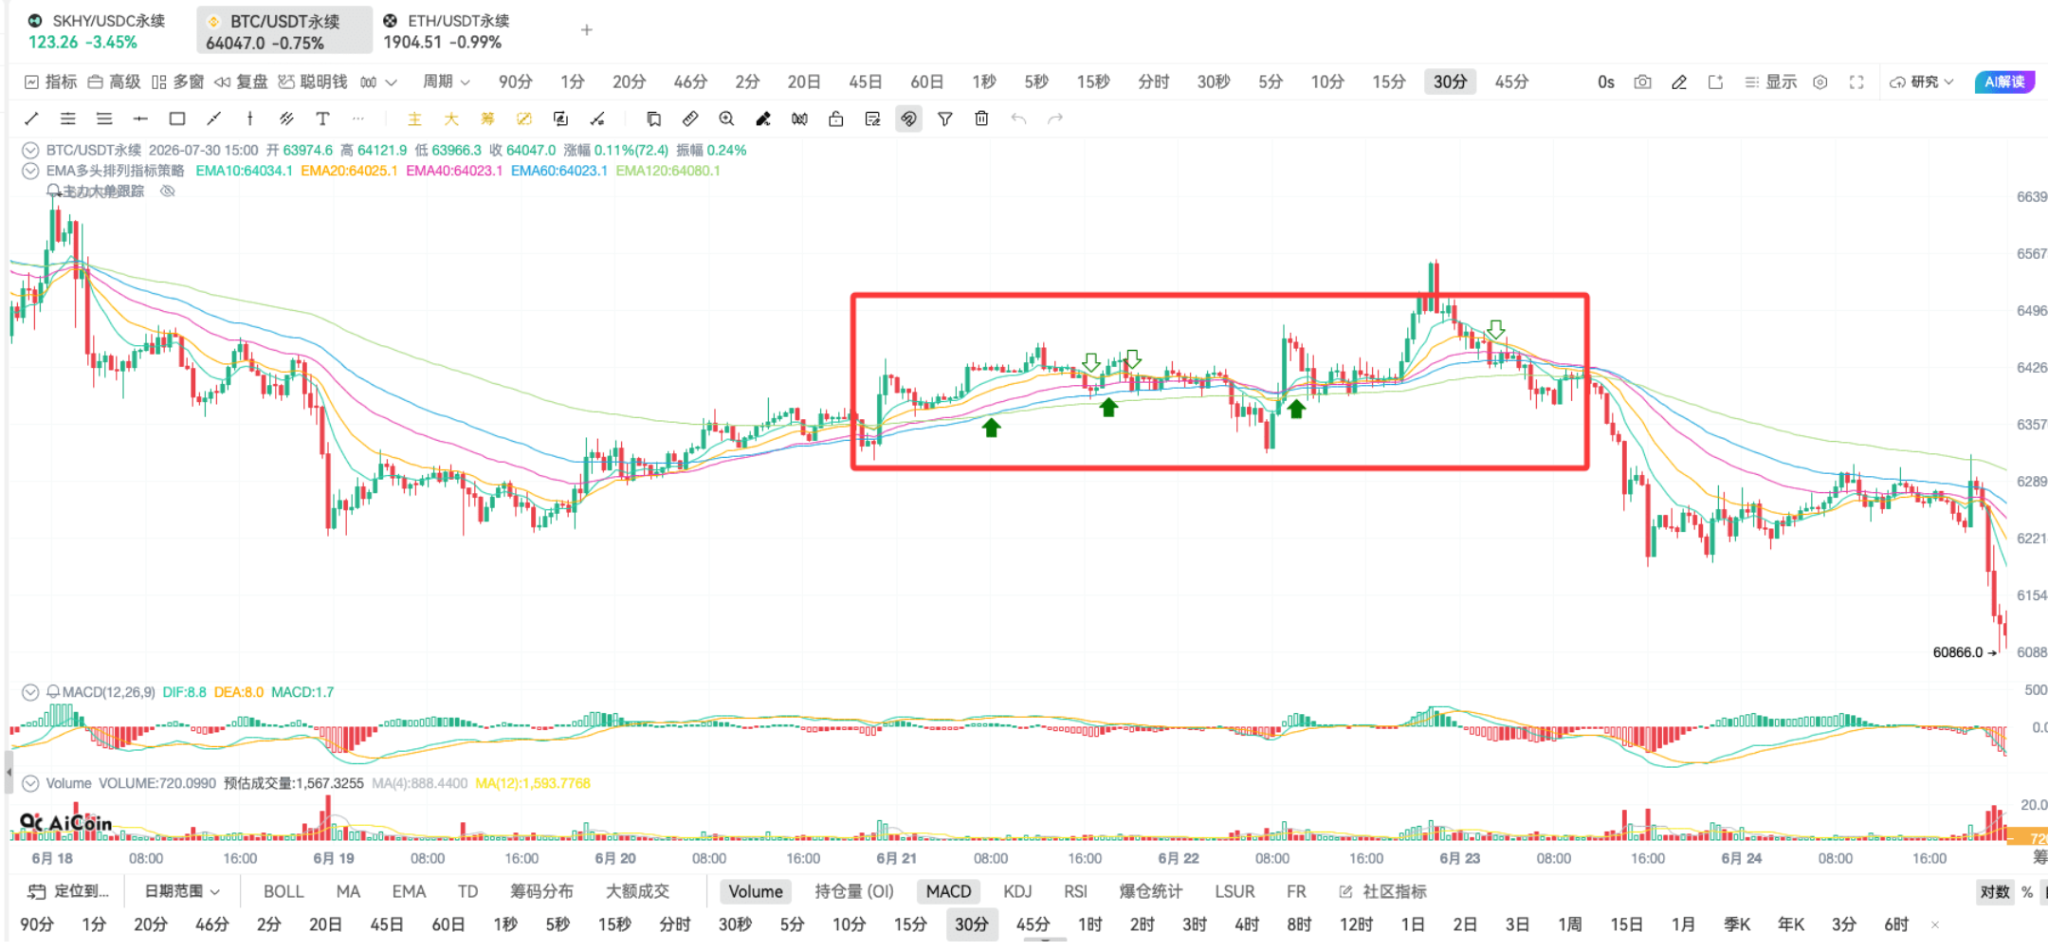
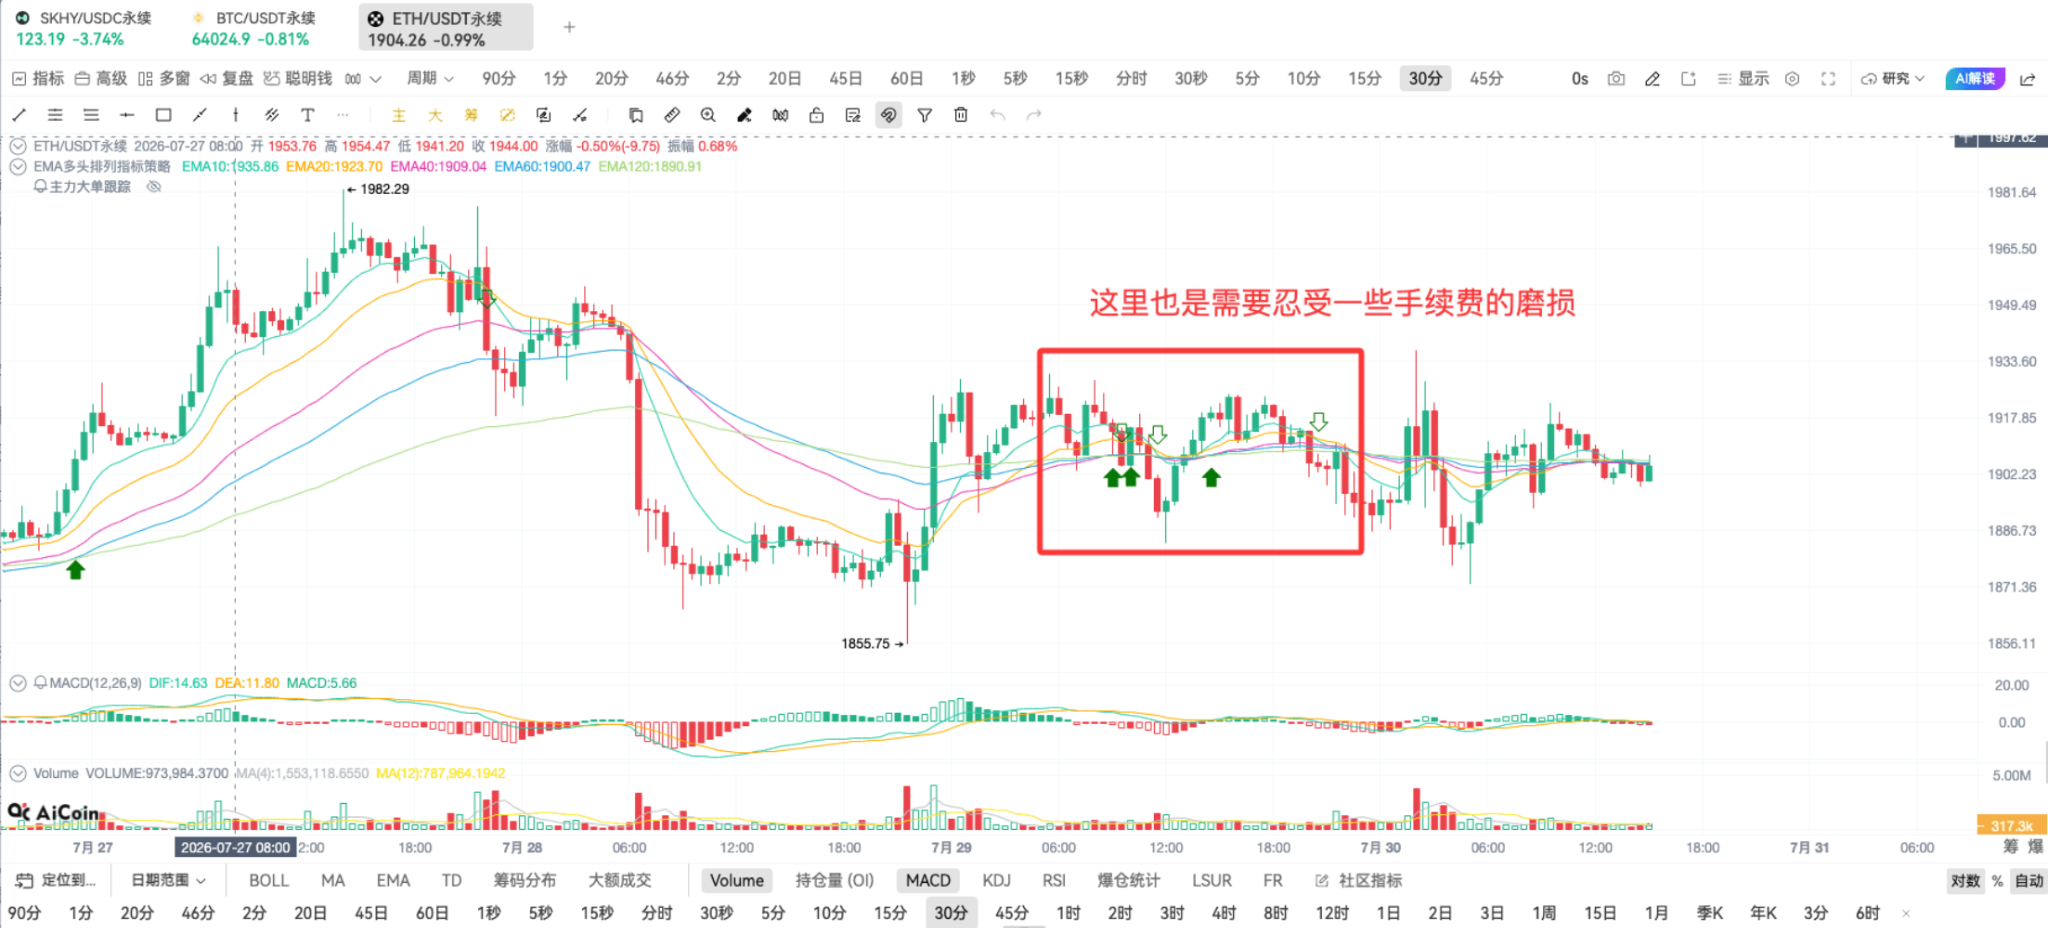
In summary:
This strategy is more suitable for markets with sufficient volatility and clear one-sided upward or downward trends. Currently, tech stocks are the focus of market funds, just fitting the strategy's applicability conditions.
This is also why I say that this resonance thinking can help avoid many pitfalls that retail investors easily fall into.
Additionally, indices and off-market funds are also applicable here.
Wait for bullish resonance to initiate as the starting point for dollar-cost averaging and buying; stop investments after the resonance ends, patiently wait for the next opportunity.
In the previous HYPE rally phase, this strategy also precisely captured each round of quality buying points.
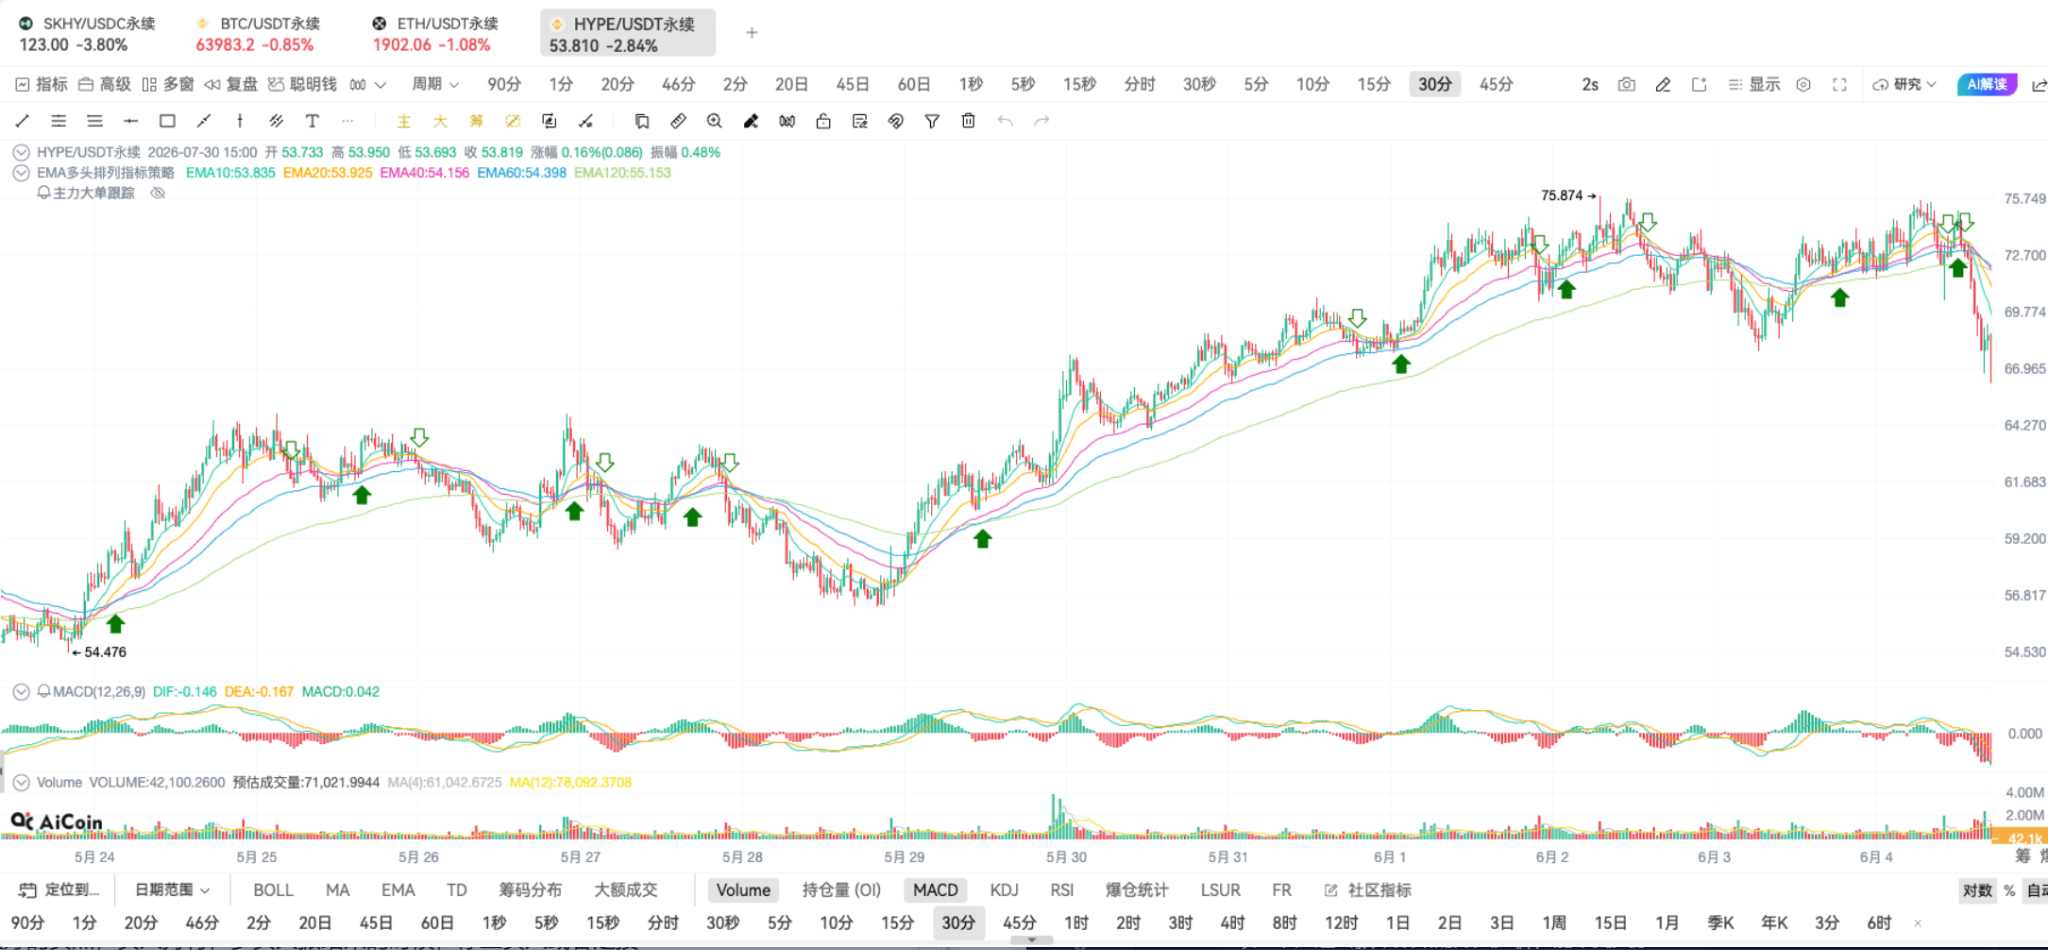
That concludes the complete breakdown of this trend strategy.
// @version=2
// Code Example
ma1 = ema(close, 10)
ma2 = ema(close, 20)
ma3 = ema(close, 40)
ma4 = ema(close, 60)
ma5 = ema(close, 120)
// ma6 = ema(close, 250)
// Calculate EMA bullish arrangement
maLong = ma1 > ma2 && ma2 > ma3 && ma3 > ma4 && ma4 > ma5
// && ma5 > ma6
// Start bullish arrangement
longStart = maLong && (not maLong[1])
// End bullish arrangement
longEnd = (not maLong) && maLong[1]
// Define warning conditions and add warning window calls
alertcondition(longStart, title='EMA Bullish Arrangement Start', direction="buy")
alertcondition(longEnd, title='EMA Bullish Arrangement End', direction="sell")
// Chart plot moving averages
plot(ma1, title="EMA10")
plot(ma2, title="EMA20")
plot(ma3, title="EMA40")
plot(ma4, title="EMA60")
plot(ma5, title="EMA120")
// plot(ma6, title="EMA250")
plotShape(longStart, title="EMA Bullish Arrangement Start", shape='arrowUp', color='green', refSeries=ma3, placement='bottom', fill=true)
plotShape(longEnd, title="EMA Bullish Arrangement End", shape='arrowDown', color='green', refSeries=ma3, placement='top', fill=false)
// Long entry and exit logic
exitLong(longEnd, price='market', amount=1)
enterLong(longStart, price='market', amount=1)
If you encounter issues during code import or parameter setup, you can communicate with customer service for debugging.
Has everyone understood the core logic clearly?
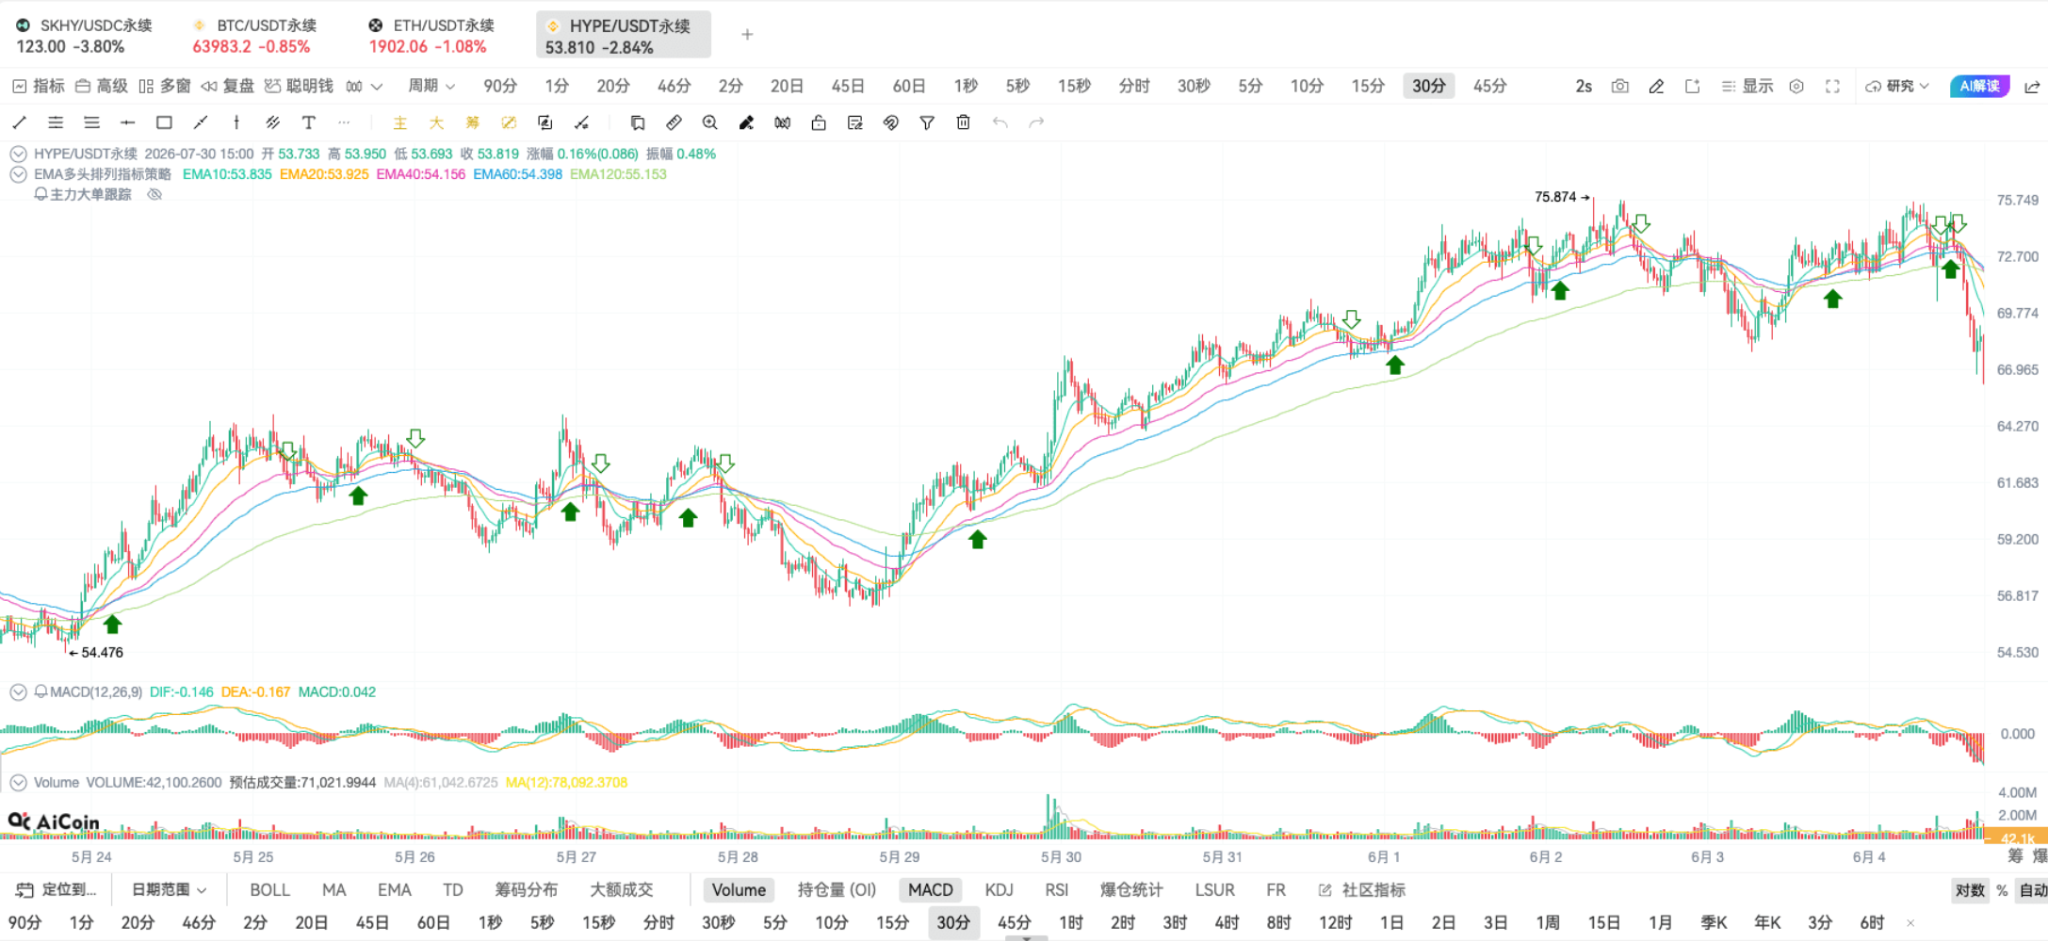
It is recommended to apply this analysis method in trading indices, funds, ETFs, and tech stocks.
Currently, it's temporarily not suitable to directly use it for BTC and ETH.
Later, when the market environment matches the strategy requirements, I will live stream a complete demonstration of practical operations.
This strategy has high practical value; once fully understood, it can better capture market opportunities.
There are live broadcasts every day, and I welcome everyone to continuously follow AiCoin! Make an appointment in advance👇
https://www.aicoin.com/zh-Hans/live/list?tab=upcoming
Join our community to discuss together and become stronger!
Official Telegram community: https://t.me/aicoincn
AiCoin Chinese Twitter: https://x.com/AiCoinzh
Aster rebate: https://www.asterdex.com/zh-CN/referral/9C50e2
Hype rebate: https://app.hyperliquid.xyz/join/AICOIN88
Binance rebate: https://jump.do/zh-Hans/xlink-proxy?id=3 Invitation code: aicoin668
Coinbase rebate: https://jump.do/xlink?checkProxy=true&proxyId=25 Invitation code: Y8L23JL
免责声明:本文章仅代表作者个人观点,不代表本平台的立场和观点。本文章仅供信息分享,不构成对任何人的任何投资建议。用户与作者之间的任何争议,与本平台无关。如网页中刊载的文章或图片涉及侵权,请提供相关的权利证明和身份证明发送邮件到support@aicoin.com,本平台相关工作人员将会进行核查。