Usually, everyone only focuses on the rise and fall numbers when looking at candlestick charts. In fact, candlesticks contain a complete set of clues for the bull-bear game. Today, we will break down three sets of high-frequency advanced patterns for practical use, accurately capturing entry points and exit peaks. Let me say in advance that candlestick patterns should only be used as auxiliary judgments; they should not be relied upon solely. To increase the win rate, they must be verified together with trading volume, capital flow, and news.
First Type: Arc Bottom, a solid bottom formed slowly
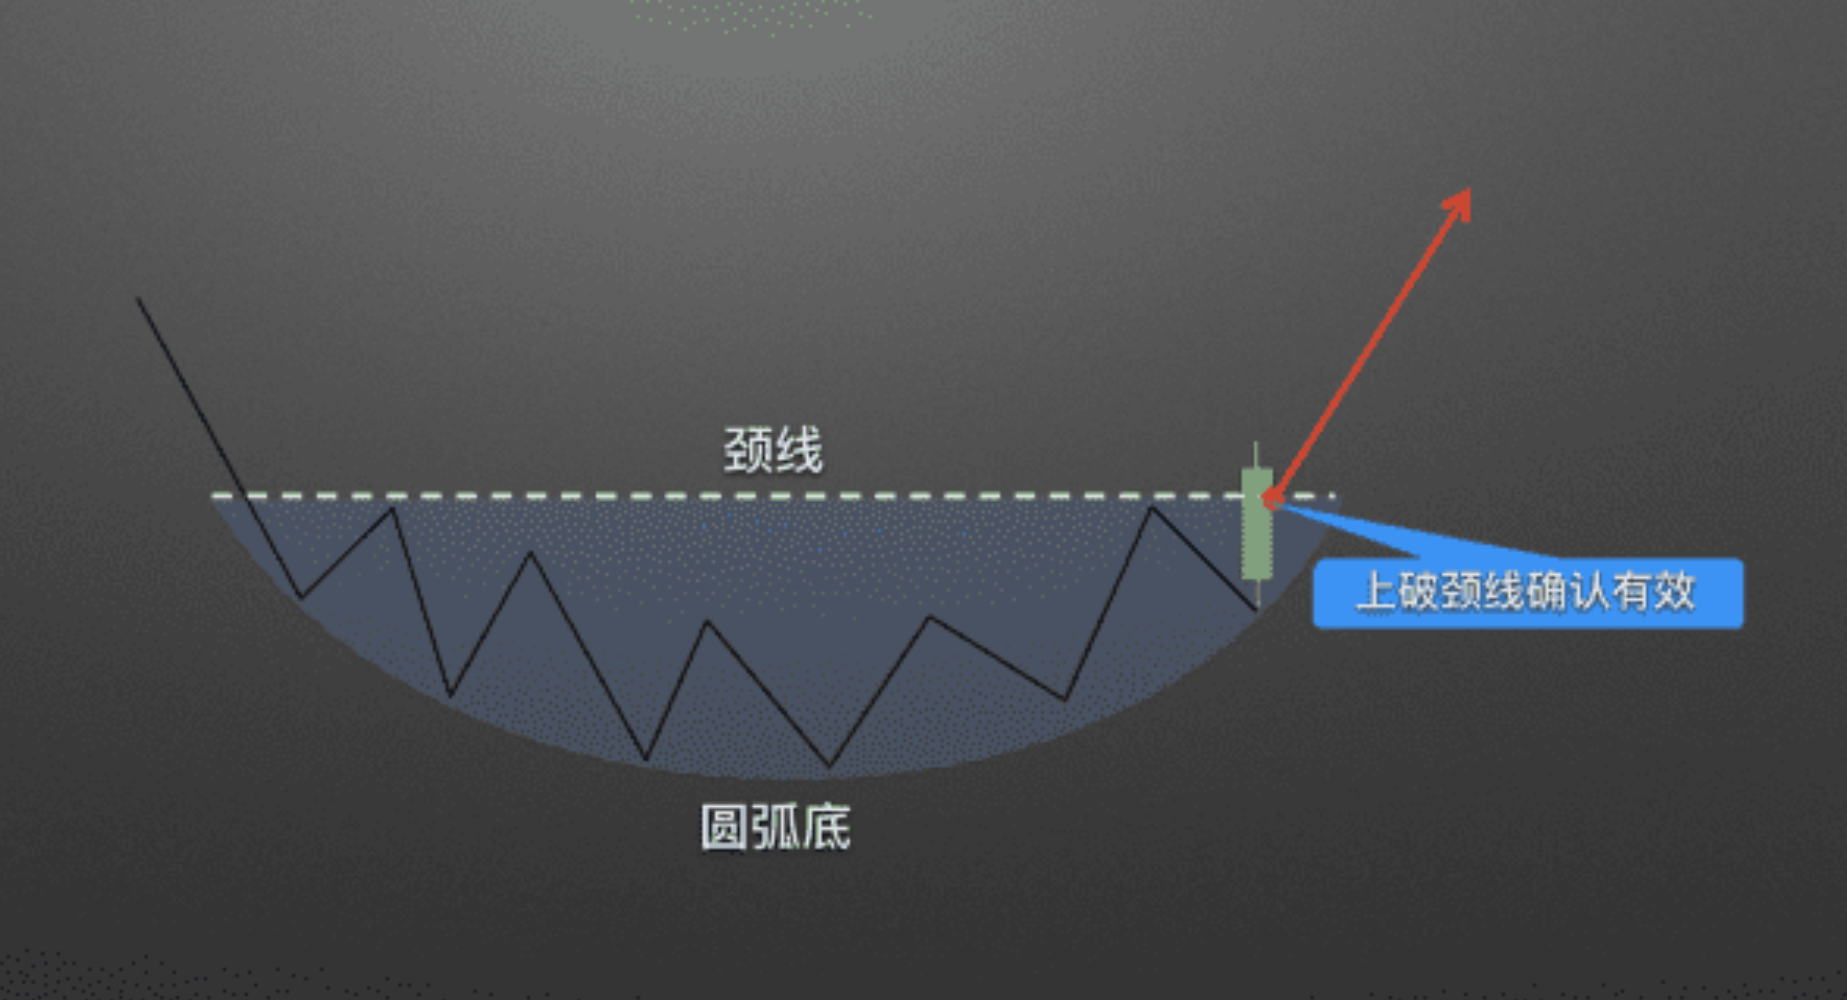
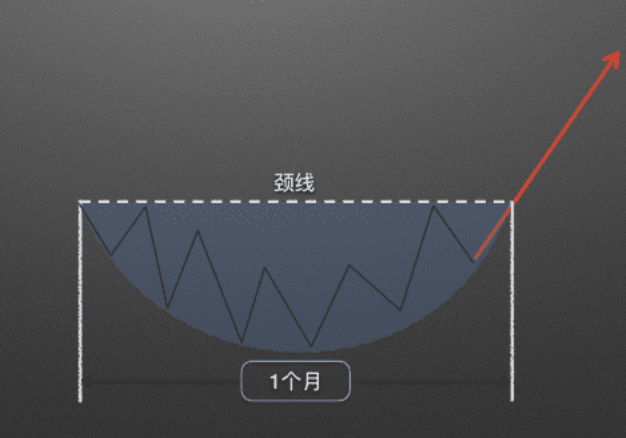
The arc bottom can be easily distinguished; the pace of the decline gradually slows down, with lows forming a rounded arc. In simple terms, it is a standard U-shaped trend. The logic behind it is straightforward: the selling pressure of bears is gradually exhausted, while bulls are quietly accumulating positions in batches, signifying a highly reliable reversal signal.
The first step in identification is to draw the neck line. Connect all the rebound highs within the arc range to form a horizontal line. This line represents the dividing line between bulls and bears. If the price is consistently below the neck line, the bears are dominant; a stable closing price above the neck line and an accompanying increase in volume constitutes an effective breakout, and the arc bottom pattern is officially formed.
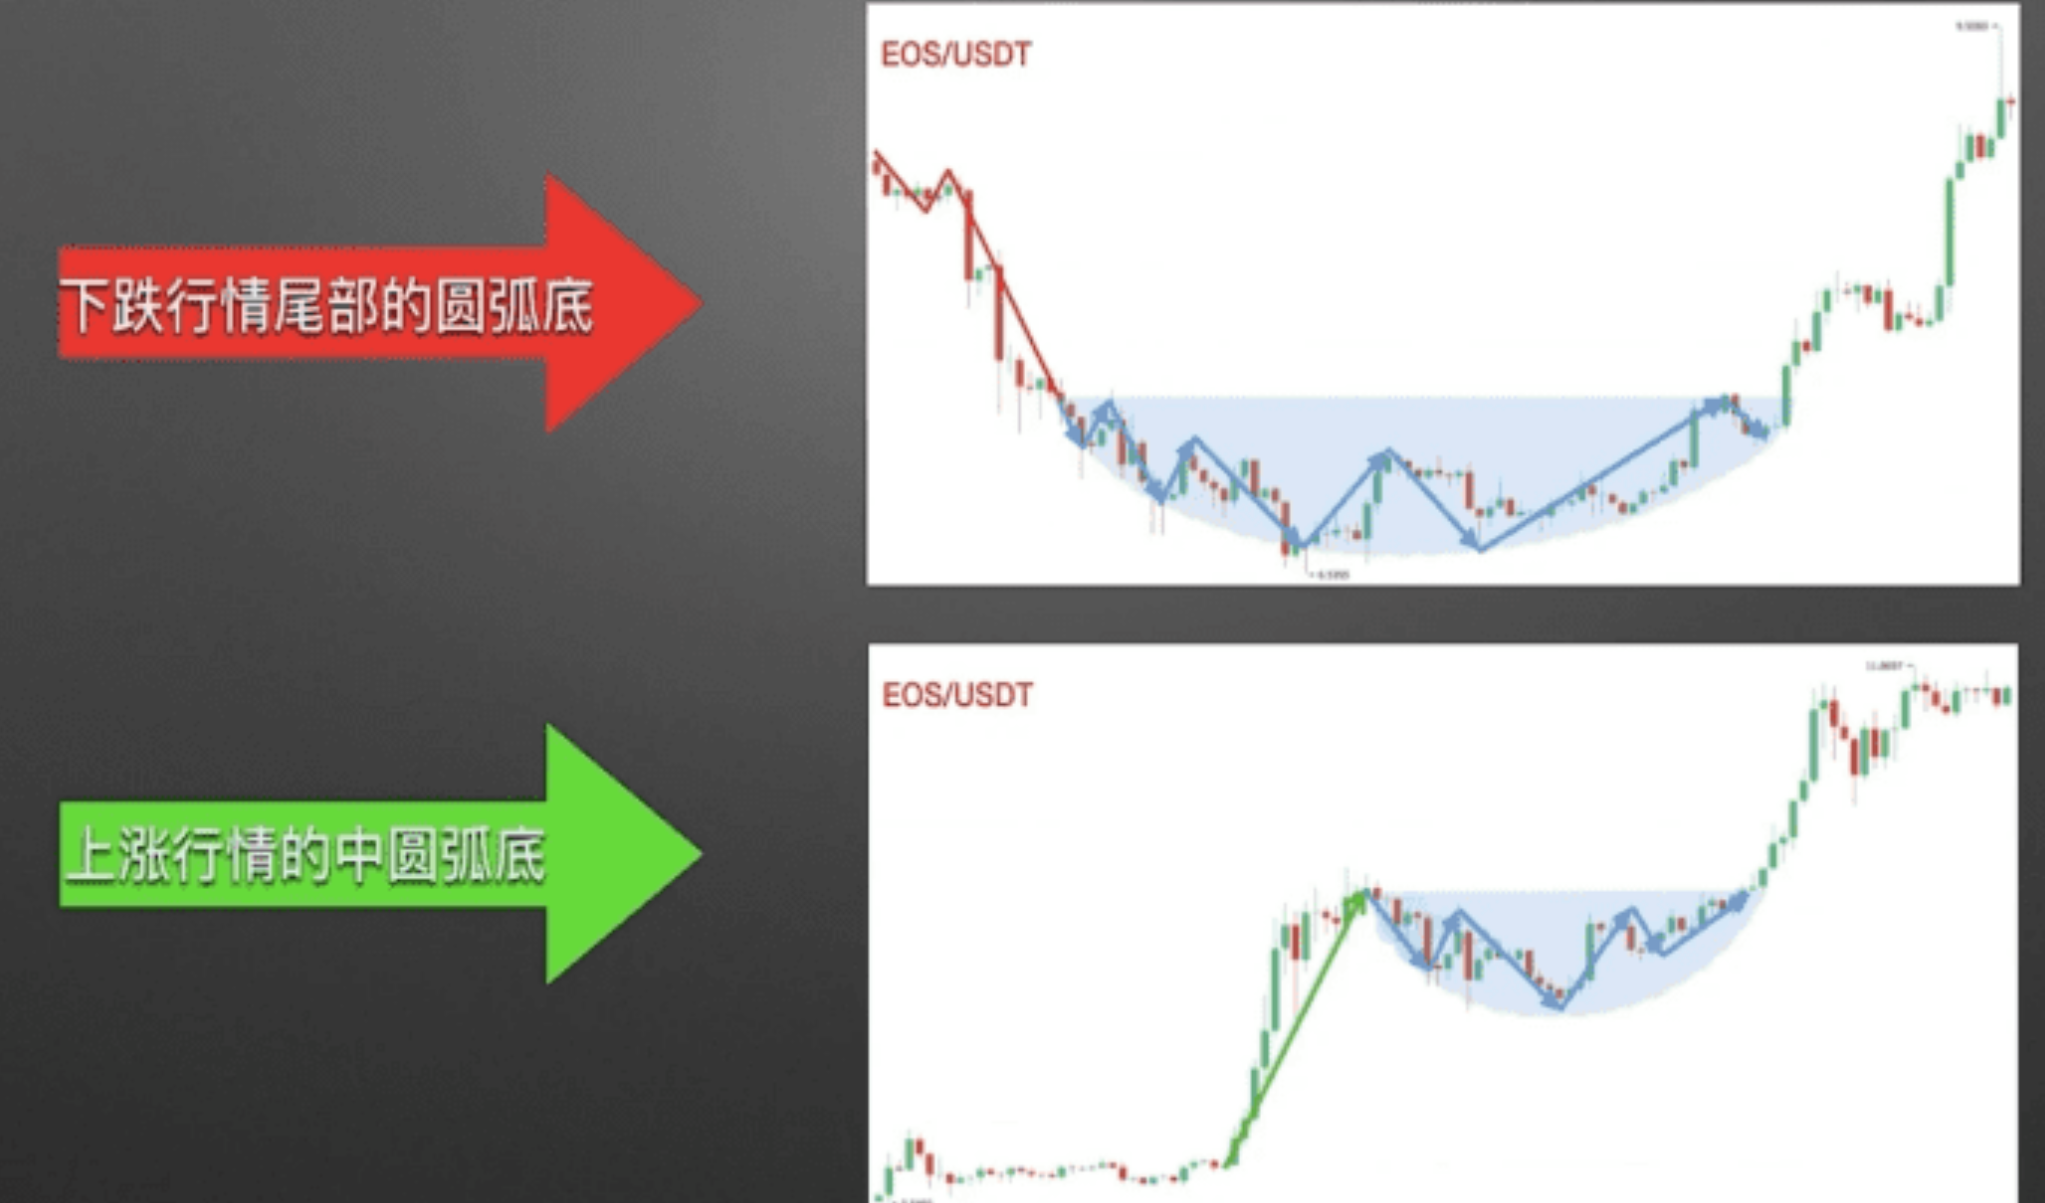
Arc bottoms can be divided into two types of trends:
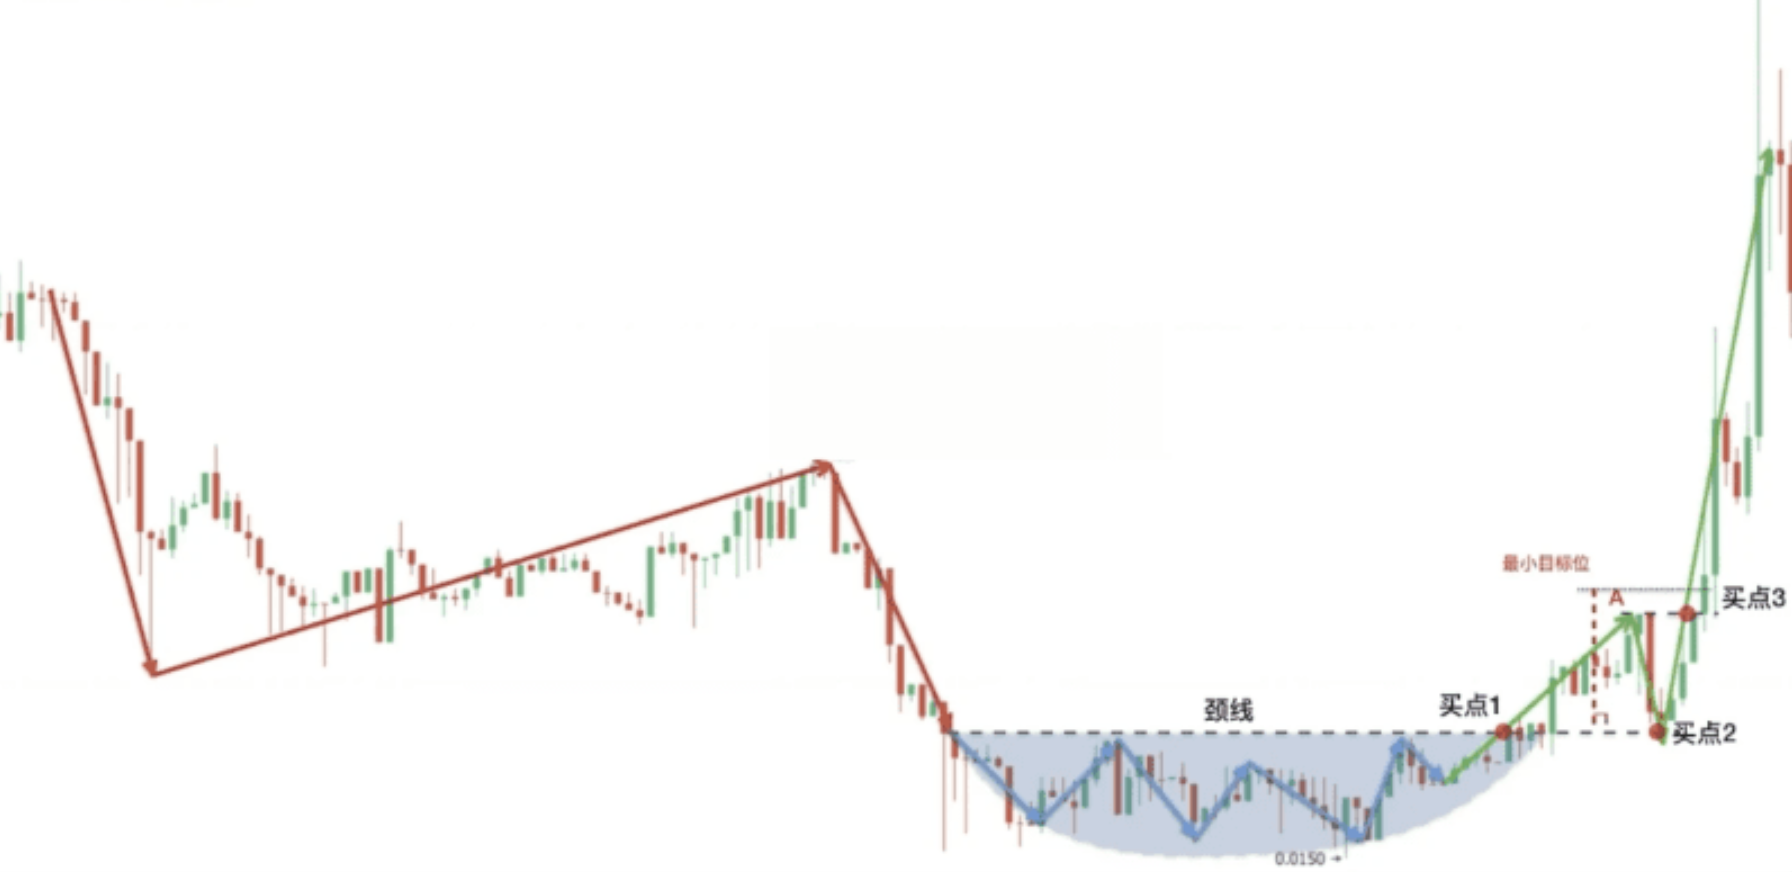
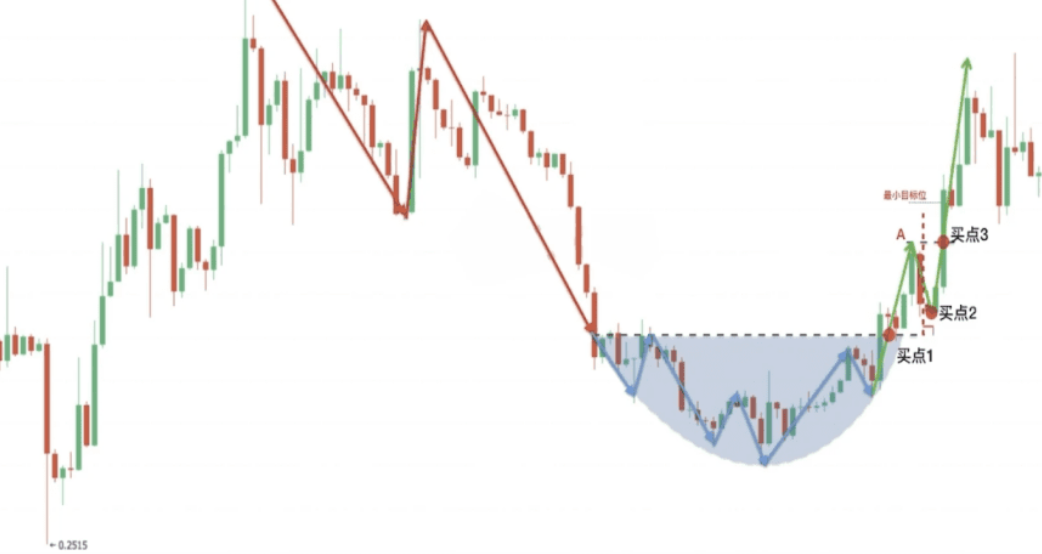
1. Arc bottom at the end of a decline: After a substantial drop, an arc forms, indicating a bottom reversal; after breaking out, it will initiate a complete upward wave;
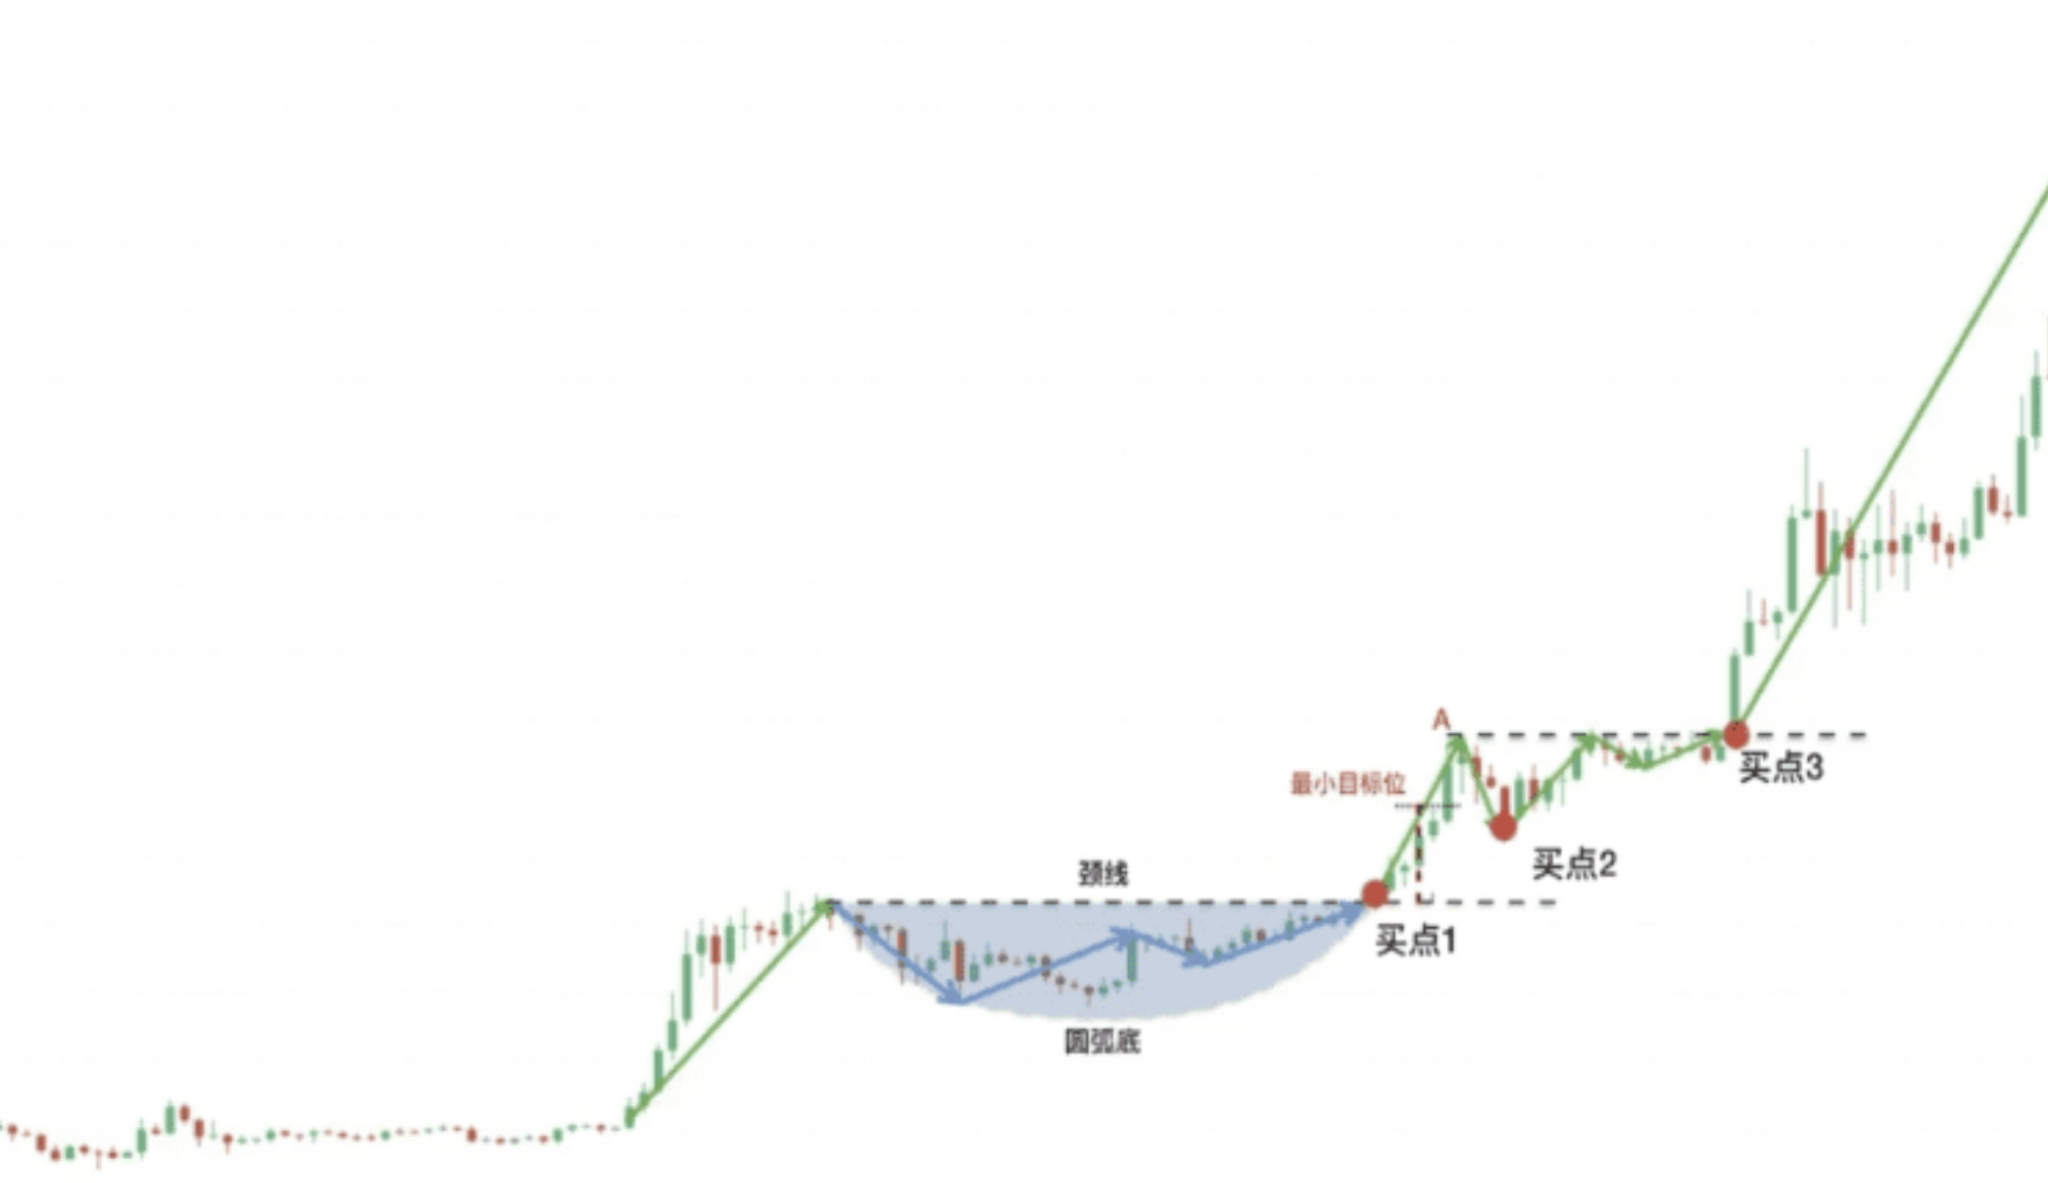
2. Arc bottom during an upward trend: A brief consolidation forms a bottom during an upward move, and after the consolidation ends and breaks the neck line, the original upward trend will accelerate.
There are three entry points corresponding to different risk tolerances:
1. Aggressive entry point: Enter when the volume surges and directly stands above the neck line, betting on the fastest upward trend;
2. Neutral entry point: After breaking out, a small pullback touches the neck line support, stops the decline, and then moves upwards, confirming the support a second time;
3. Conservative entry point: After the pullback ends, re-breaking the previous high, laying out positions again. This signal is the most reliable, but the entry price will be higher.
Small rule: The longer the arc bottom oscillates and grinds, the greater the subsequent upward space; the longer the arc radius, the stronger the rally's explosiveness.
Here are two practical market reference cases: The mid-process consolidation arc bottom, with all three buy spots realized, shows sufficient upward amplitude; the falling reversal arc bottom, after completing the pattern, has gains far exceeding expectations.
Also remember the invalidation signal: When the price temporarily stands above the neck line, subsequent falls directly break the support, indicating that this breakout is a trap for bulls, and the arc bottom has failed to form, and you should not continue to hold. Once such a trend appears, you must promptly cut losses and exit to avoid a new round of decline.
Second Type: Head and Shoulders Top, an acknowledged reliable pattern for exit
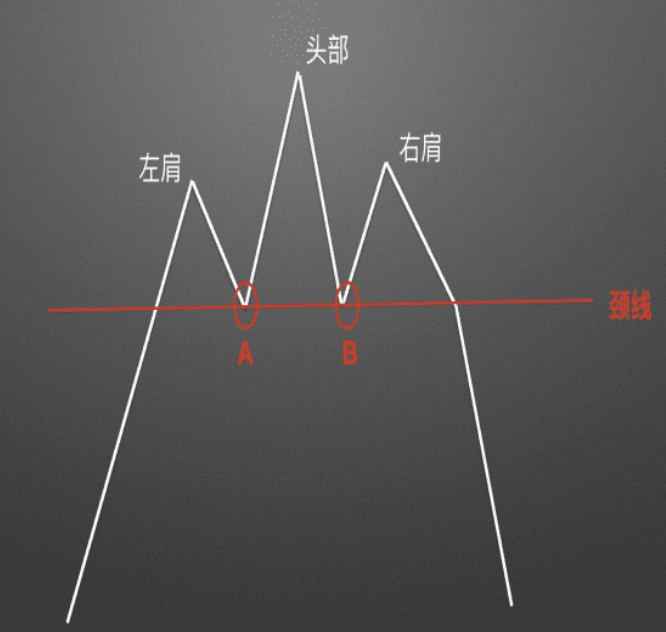
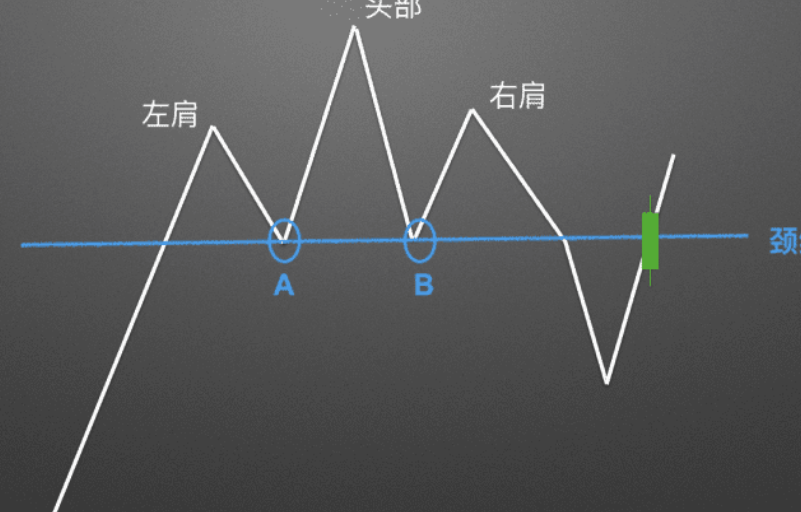
Many friends jokingly refer to it as the McDonald's M shape. The structure is easy to remember: a middle peak head at the highest point, and two lower shoulder points on the sides, with the line connecting the low points of the left shoulder's pullback and the head's pullback forming the neck line. The neck line does not have to be horizontal; a slanted line with varying heights is also effective.
The neck line distinguishes the strength of the market: above the line, bulls still hold an advantage; below the line, bears completely control the market. If a large bearish candle breaks the neck line, the head and shoulders top confirmation is firmly established.
Corresponding to three exit sell points:
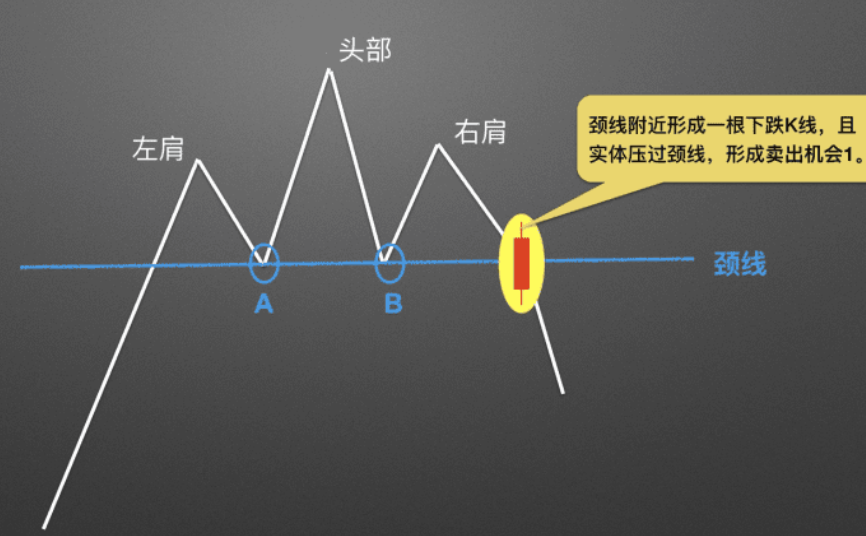
1. Aggressive sell point: A solid bearish candle directly breaks through the neck line, immediately reducing positions;
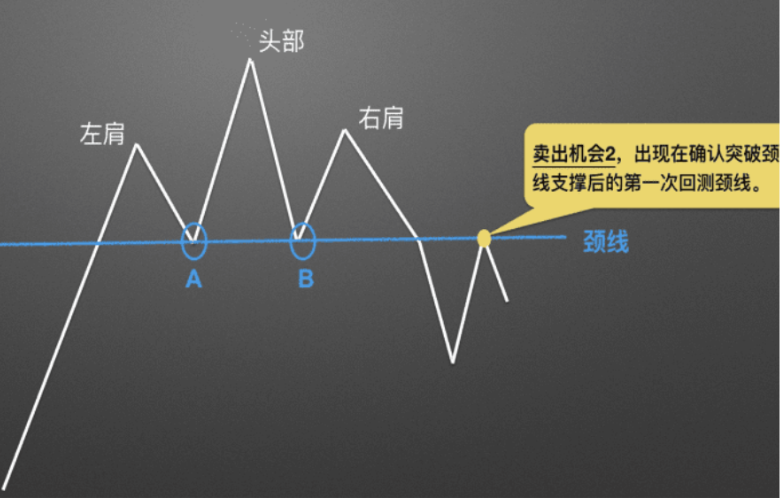
2. Conservative sell point: After breaking down, a slight bounce touches the neck line, unable to rise further, giving a second exit opportunity;
3. Cautious sell point: If the bounce is weak and new lows are made, confirming a downtrend, exit entirely.
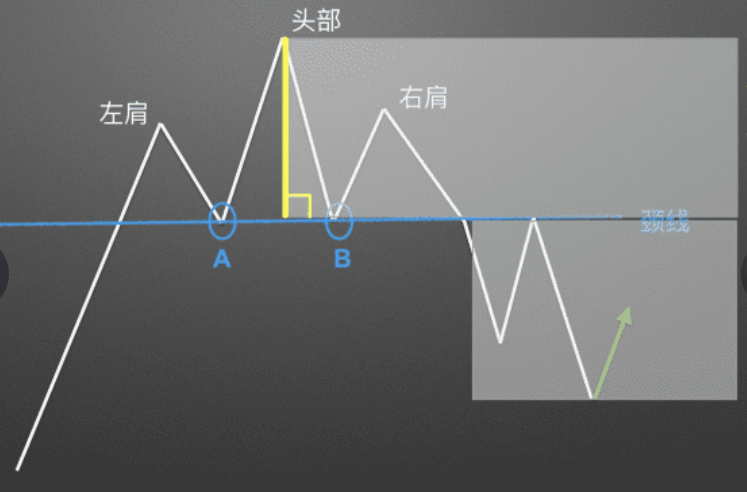
Form rules: The longer the head and shoulders top's oscillation period and the greater the vertical gap between the head and neck line, the larger the subsequent downward space.
Two market case examples: A standard structured head and shoulders top, with clear tiers for the left shoulder, head, and right shoulder; all three sell points realized; a slanted neck line version, with strong bearish power, breaking down quickly without giving any rebound exit opportunities.
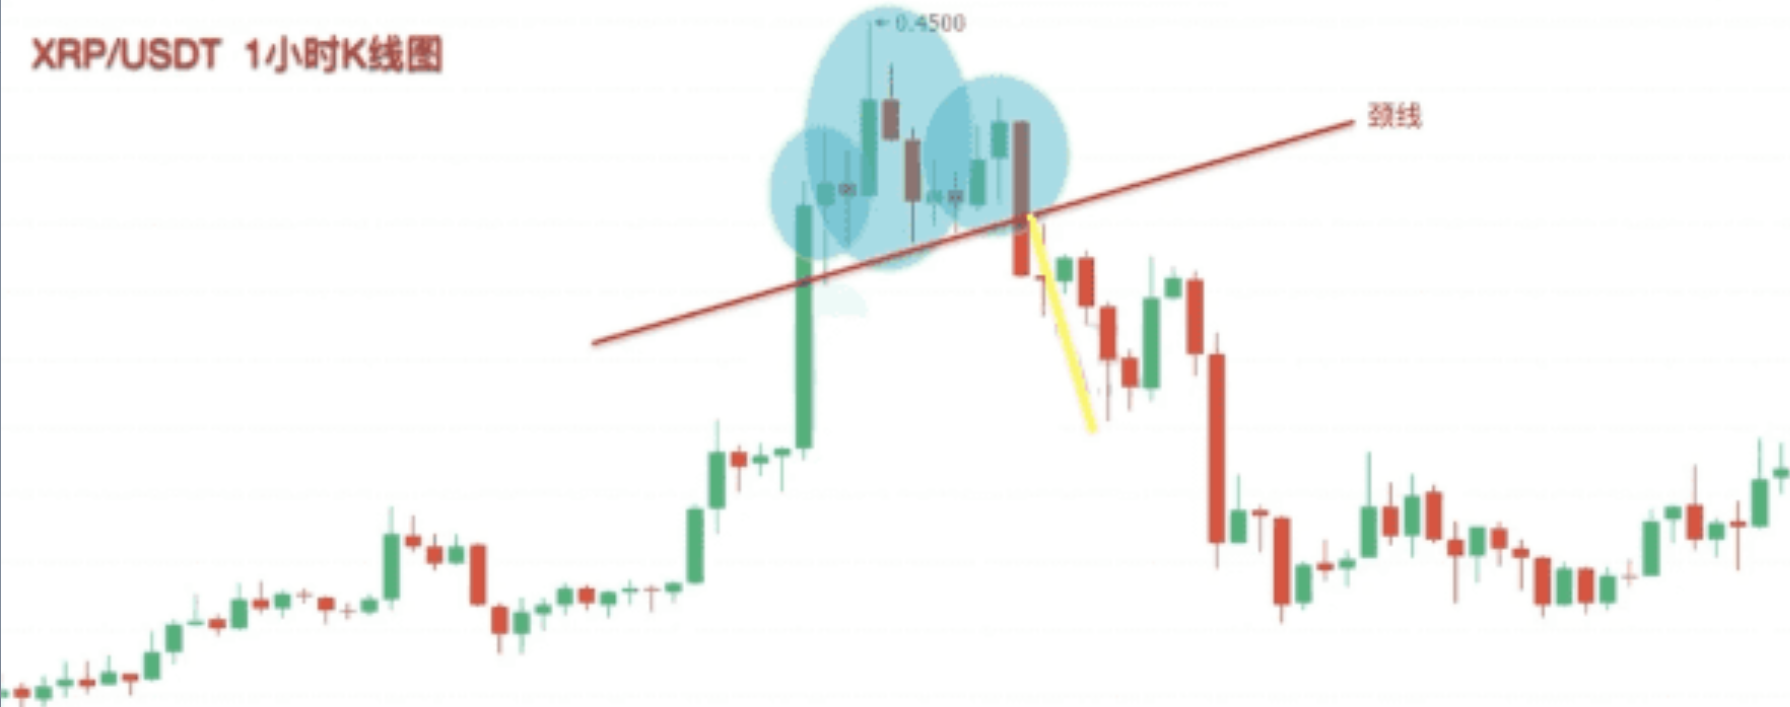
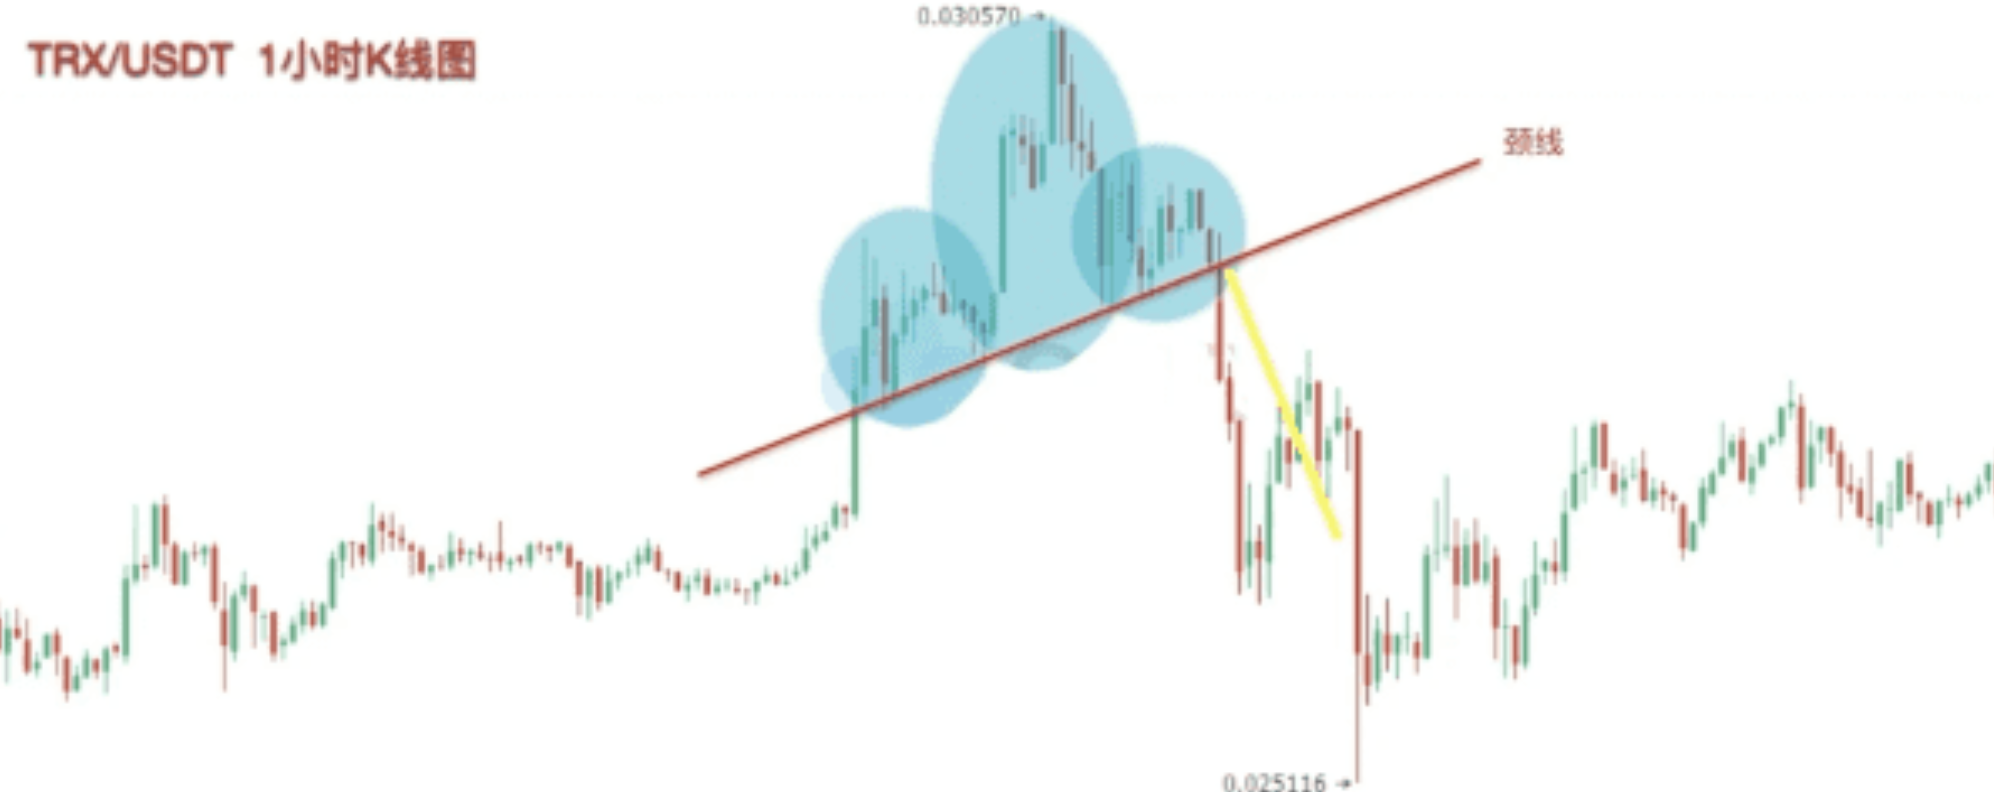
Invalidation judgment: After breaking the neck line, a large bullish candle breaking through the neck line pressure signifies that the bearish pattern has been broken, and the head and shoulders top pattern is invalid, so there is no need to keep watching.
Third Type: M Double Top (Double Top), a high point double top exit signal
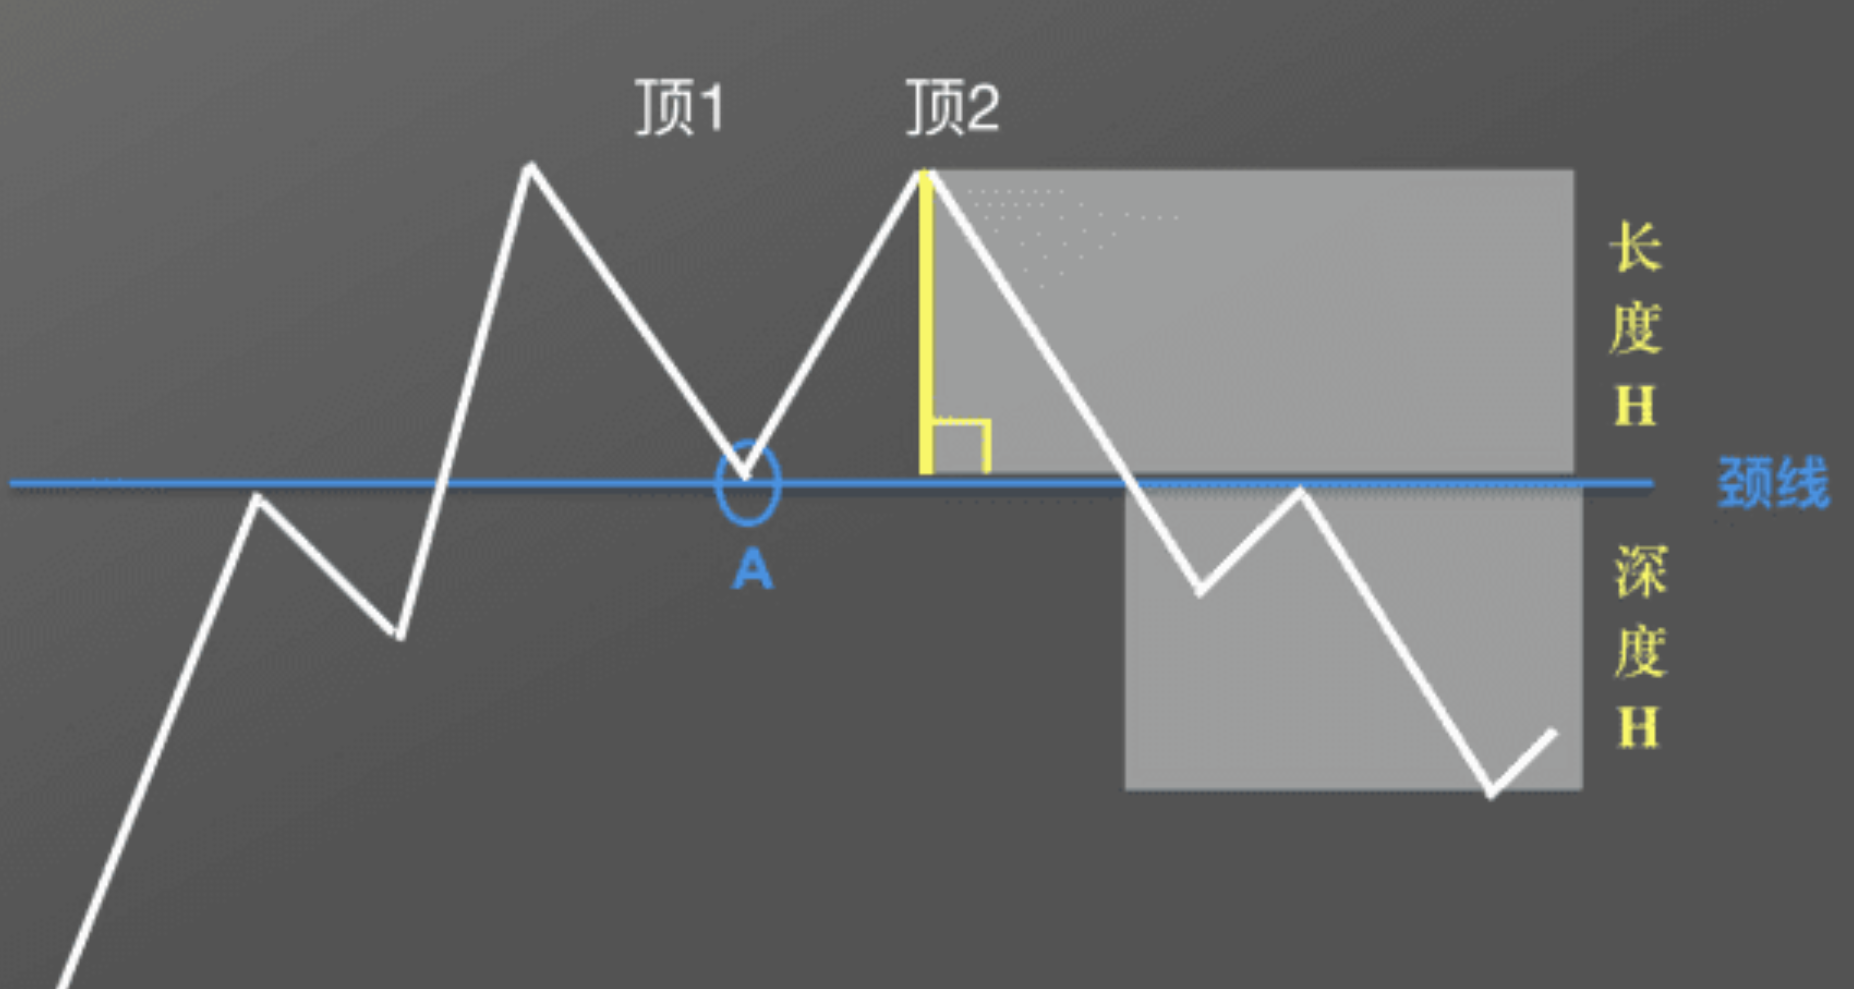
The double top consists of two close high points, and the pullback low point between the two highs forms a horizontal neck line.
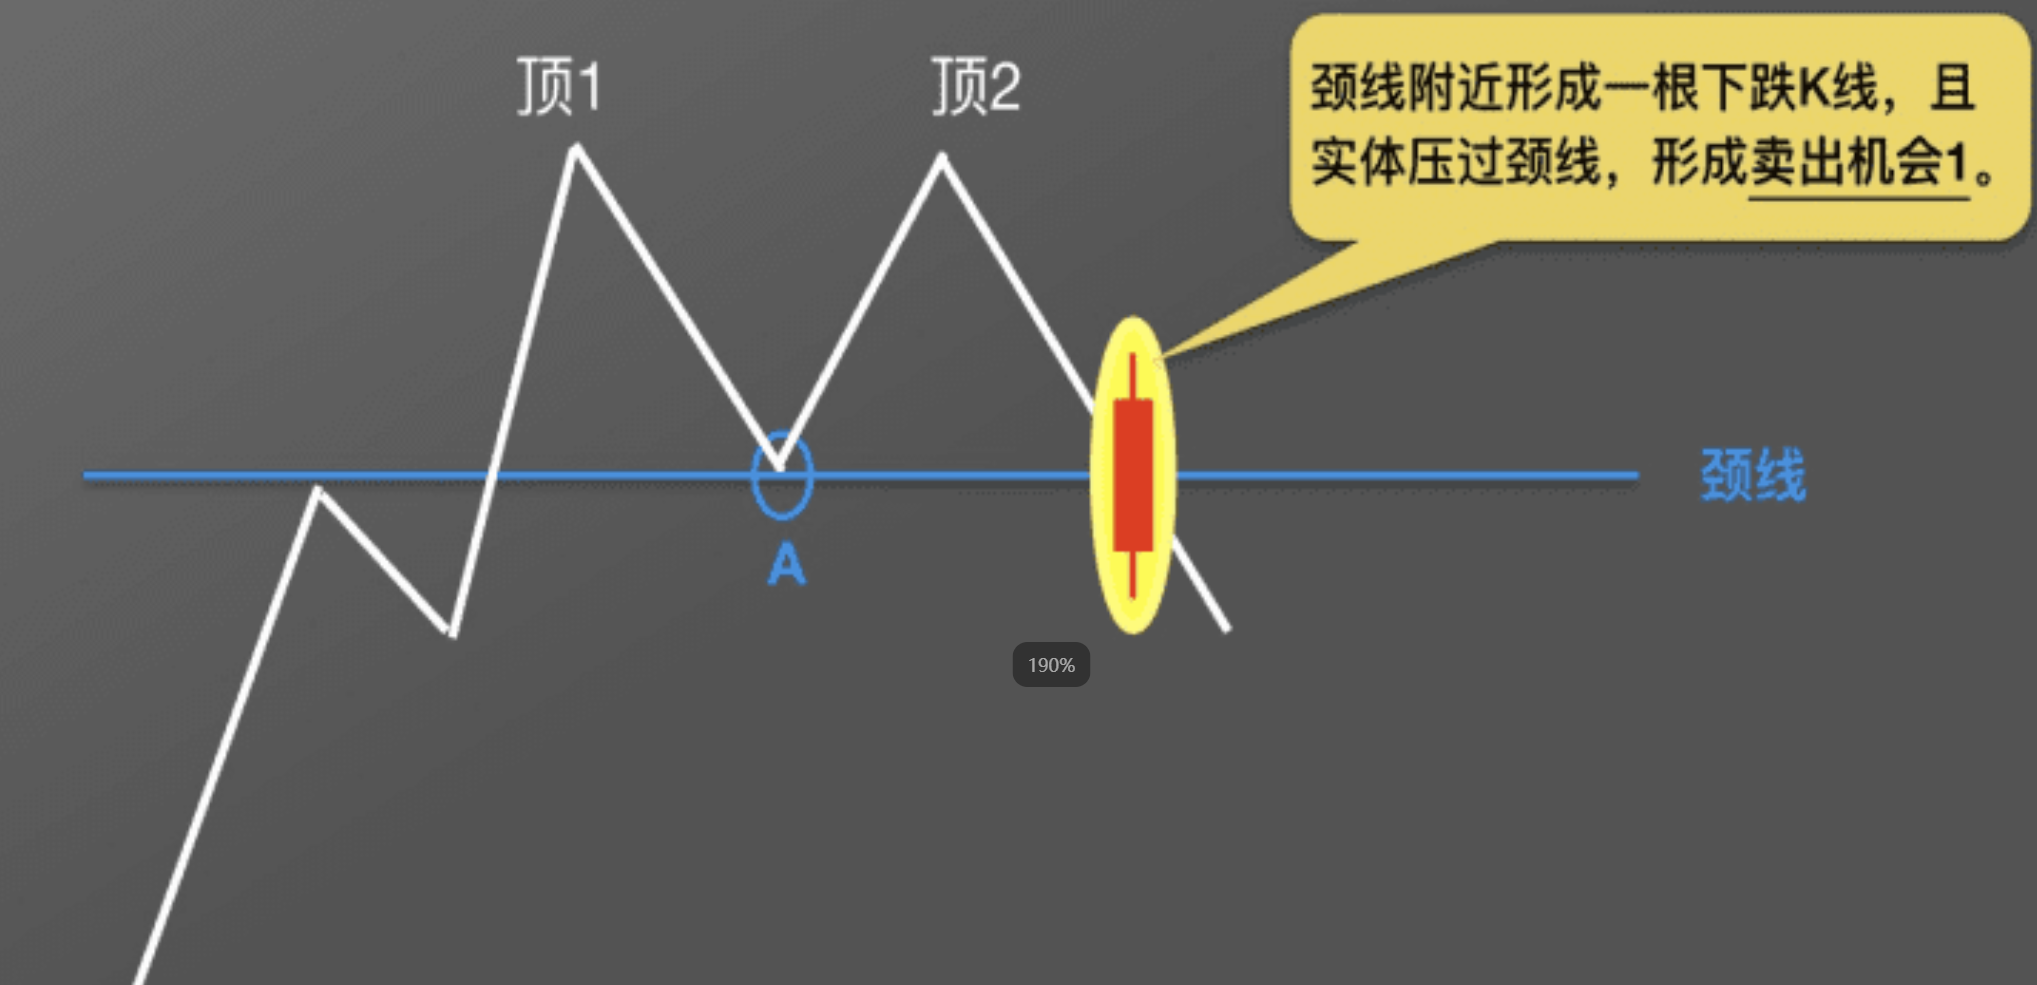
Boundary of market strength: If the price remains above the neck line, the bull trend has not ended; once the neck line is broken with increased volume, the upward trend is officially over, and a bearish trend begins.
The three selling logics are similar to the head and shoulders idea:
1. First sell point: A large bearish candle breaches the neck line, immediately reducing positions;
2. Second sell point: After breaking down, a pullback touches the neck line, meets resistance, and reduces positions again;
3. Third sell point: If the rebound fails and a new low is made, it confirms the downtrend and exits completely.
Simple rule: The greater the vertical height between the two peaks and the neck line, the larger the subsequent downward space will be.
Finally, let me remind you once more that candlestick patterns are merely auxiliary judgment tools; do not rely on them blindly. Combine them with trading volume, on-chain capital, and overall market environment for a comprehensive judgment; the error rate in operations will be much higher. Various indicators and candlestick combinations are used for cross-verification, and one should not rely on a single pattern to open a position directly.
Currently, there is a live broadcast every day, and feel free to continuously follow AiCoin friends! Reserve your spot in advance👇
https://www.aicoin.com/zh-Hans/live/list?tab=upcoming
Join our community, let’s discuss together and become stronger!
Official Telegram Community: https://t.me/aicoincn
AiCoin Chinese Twitter: https://x.com/AiCoinzh
Aster commission: https://www.asterdex.com/zh-CN/referral/9C50e2
Hype commission: https://app.hyperliquid.xyz/join/AICOIN88
Binance commission: https://jump.do/zh-Hans/xlink-proxy?id=3 Invitation code: aicoin668
Coinbase commission: https://jump.do/xlink?checkProxy=true&proxyId=25 Invitation code: Y8L23JL
免责声明:本文章仅代表作者个人观点,不代表本平台的立场和观点。本文章仅供信息分享,不构成对任何人的任何投资建议。用户与作者之间的任何争议,与本平台无关。如网页中刊载的文章或图片涉及侵权,请提供相关的权利证明和身份证明发送邮件到support@aicoin.com,本平台相关工作人员将会进行核查。