Cryptocurrency Circle Academician: The dual-cycle indicator of Ethereum (ETH) on July 26 hides a direction, is the market about to break? Latest market analysis reference
Ethereum's current price is 1873. Trading cannot be rushed, especially in this volatile market; patience is more important than anything. Don't get flustered just because others are making money; stick to your own plan and protect your own capital, which is more important than anything else. The Ethereum market has not finished its course, there are plenty of opportunities, survive first to wait for your own big market
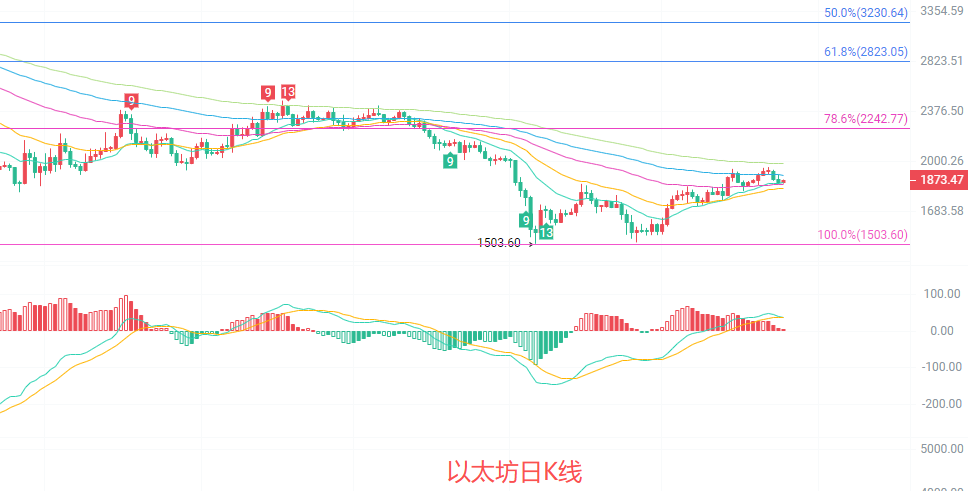
The daily K-line is above EMA15 and EMA30, with short-term moving averages in a bullish arrangement, but EMA60, 90, and 120 are still diverging downwards, overall the trend is in the recovery phase after a decline. The MACD indicator shows that DIF crosses above DEA, with the red bars slightly expanding, indicating a weak short-term bullish momentum release. The Bollinger Bands are currently narrowing, with prices hovering around the middle track 1842, the upper track 1959 forming short-term pressure, and the lower track 1724 providing support. The Fibonacci 78.6% position at 2242 remains a strong resistance, the current price has not yet broken through the key resistance level, overall it is in a weak rebound pattern
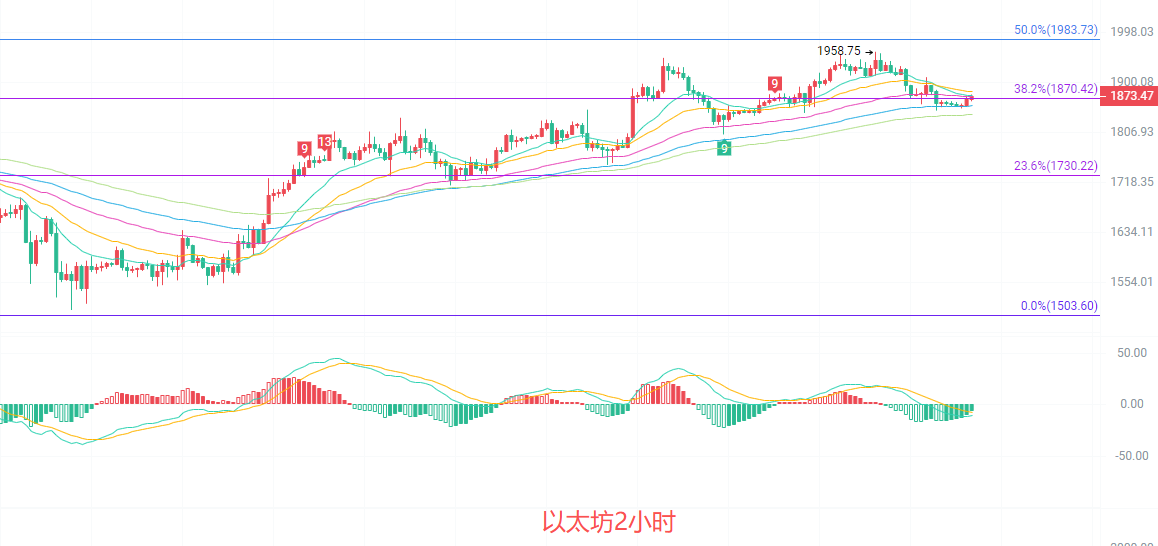
The four-hour K-line is below EMA15, with short-term moving averages converging, and fierce competition between bulls and bears. The MACD indicator shows DIF is below DEA, with green bars slightly shortening, indicating a decrease in bearish momentum. The Bollinger Bands are currently narrowing, with prices running near the middle track, the upper track 1943 posing short-term pressure, and the lower track 1832 providing support. The Fibonacci 38.2% position at 1870 coincides with the current price, forming a short-term dividing line between bulls and bears. Prices have tested this position multiple times without effectively breaking through, indicating significant selling pressure above, and in the short term, it is in a volatile bearish consolidation state
Short-term reference:
If it does not break below 1850 to 1800, look to go up, stop loss at 1760, target from 1930 to 1970
If it does not break above 1980 to 2020, look to go down, stop loss at 2050, target from 1930 to 1890
Specific operations should be based on real-time data from the market; for more information, you can inquire with the author. Article publication may be delayed, advice is for reference only, and risks are borne by individuals

Warm reminder: The above content is solely created by the author in the public account; advertisements at the end of the article and in the comments section are unrelated to the author. Please distinguish carefully, thank you for reading
免责声明:本文章仅代表作者个人观点,不代表本平台的立场和观点。本文章仅供信息分享,不构成对任何人的任何投资建议。用户与作者之间的任何争议,与本平台无关。如网页中刊载的文章或图片涉及侵权,请提供相关的权利证明和身份证明发送邮件到support@aicoin.com,本平台相关工作人员将会进行核查。


