Academician of the Cryptocurrency Circle: The battle between bullish and bearish positions on Bitcoin (BTC) has entered a decisive stage at 77! Latest market analysis and operational advice interpretation
Currently, Bitcoin is fluctuating repeatedly in the 63800 range, and the competition between long and short positions is particularly fierce, making it easy to fall into the trap of frequent trading. There is no absolute one-sided market; chasing highs and cutting losses will only lead to continual losses. Everyone must remember the strategy and strictly enter at the marked points, and stop-loss cannot be neglected. In a fluctuating market, one should not pursue exorbitant profits; being able to steadily capture wave profits is enough.
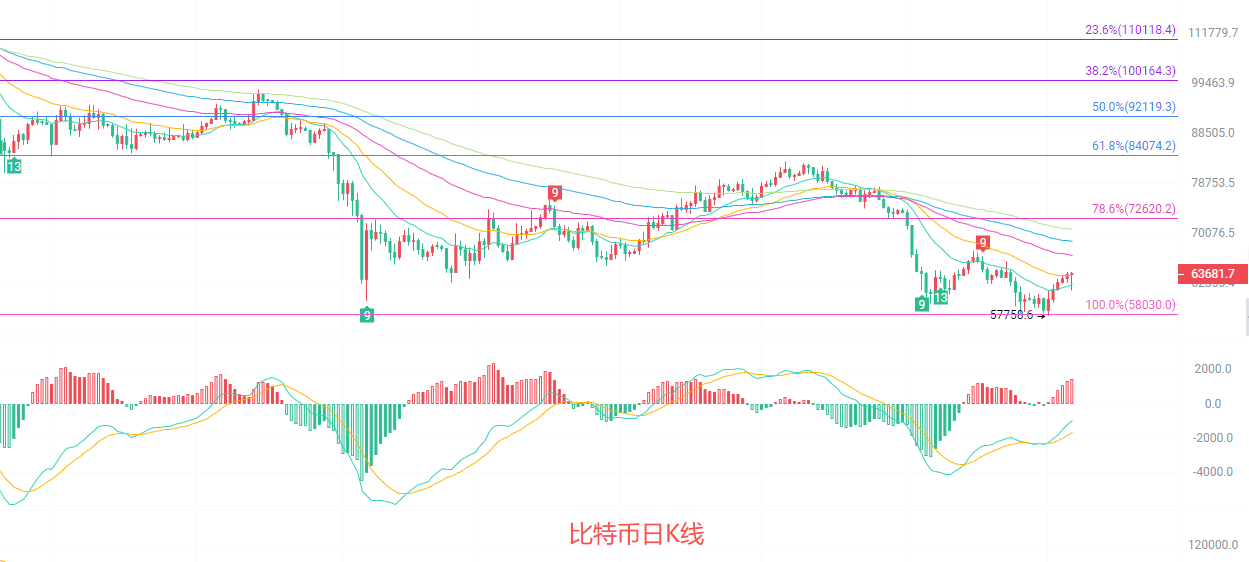
The daily candlestick is currently in a key rebound repair stage. The current price is above the EMA15, but still under pressure from the EMA30, and has not yet broken through the strong resistance zone of the EMA60; the medium-term downtrend has not been completely reversed. The MACD indicator shows that the DIF has crossed above the DEA, with red bars continuing to expand, indicating a recovery of bullish momentum in the short term; a strong support has formed near the middle track of the Bollinger Bands at 61953, while the upper track at 65596 is the first resistance point in the short term. From the Fibonacci retracement perspective, the price is currently in the rebound range of 100% to 78.6%, with a moderate rebound rhythm and no strong breakout signal yet.
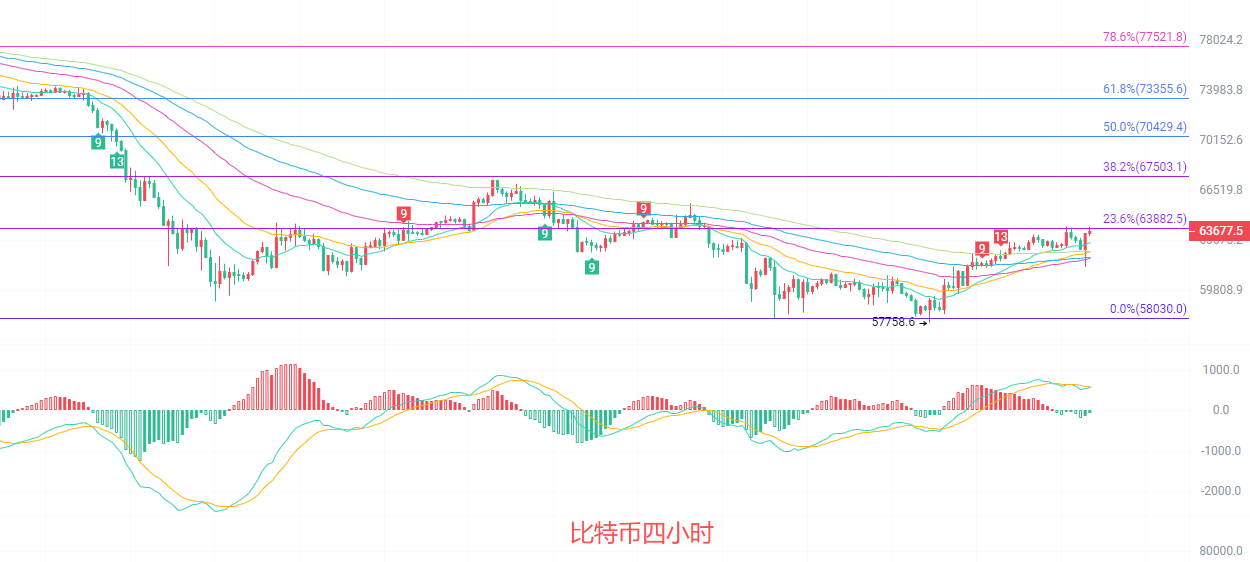
The four-hour candlestick is in a clear upward channel, with the price steadily above the EMA15/30/60 moving averages in an upward arrangement, indicating a bullish trend in the short term. The MACD indicator shows that the DIF and DEA are maintained above the zero axis; although the red bars have shortened, they remain above the zero axis, with bullish momentum slightly diminishing but not reversing; the Bollinger Bands are opening upwards, and the current price is close to the upper track at 63804, indicating a slight pullback demand in the short term. From the Fibonacci perspective, the price has broken through the key resistance at 23.6%, and the next target is focused on 38.2%, with support below near the EMA30 at around 62300, overall in a consolidation phase during the upward process.
Short-term reference:
If the price does not break below 63000 to 62500, move upwards with a stop-loss at 62000, targeting 64500 to 65500.
If the price does not break above 64500 to 65000, move downwards with a stop-loss at 65500, targeting 63500 to 62500.
Specific operations should be based on real-time market data; for more detailed information, you can consult the author. The publication of the article may be delayed, and is suggested for reference only, with risks borne by yourself.

Warm reminder: The above content is solely created by the author's public account; the advertisements at the end of the article and in the comment section are unrelated to the author. Please discern cautiously, thank you for reading.
免责声明:本文章仅代表作者个人观点,不代表本平台的立场和观点。本文章仅供信息分享,不构成对任何人的任何投资建议。用户与作者之间的任何争议,与本平台无关。如网页中刊载的文章或图片涉及侵权,请提供相关的权利证明和身份证明发送邮件到support@aicoin.com,本平台相关工作人员将会进行核查。