Cryptocurrency Circle Academician: 7.7 Ethereum (ETH) Analysis of Cycle Pattern and Ultimate Market Direction? Latest Market Analysis Reference
The current price of Ethereum is 1790. To be honest, I have been watching this rebound throughout, and I want to remind everyone: don't get carried away by a few bullish candles. The daily downtrend of Ethereum has not completely reversed yet; this rebound feels more like a repair during a downtrend, not the start of a big bull market. Many people shout to jump in as soon as the price rises and panic to cut losses when it falls, ultimately getting hurt in both directions.
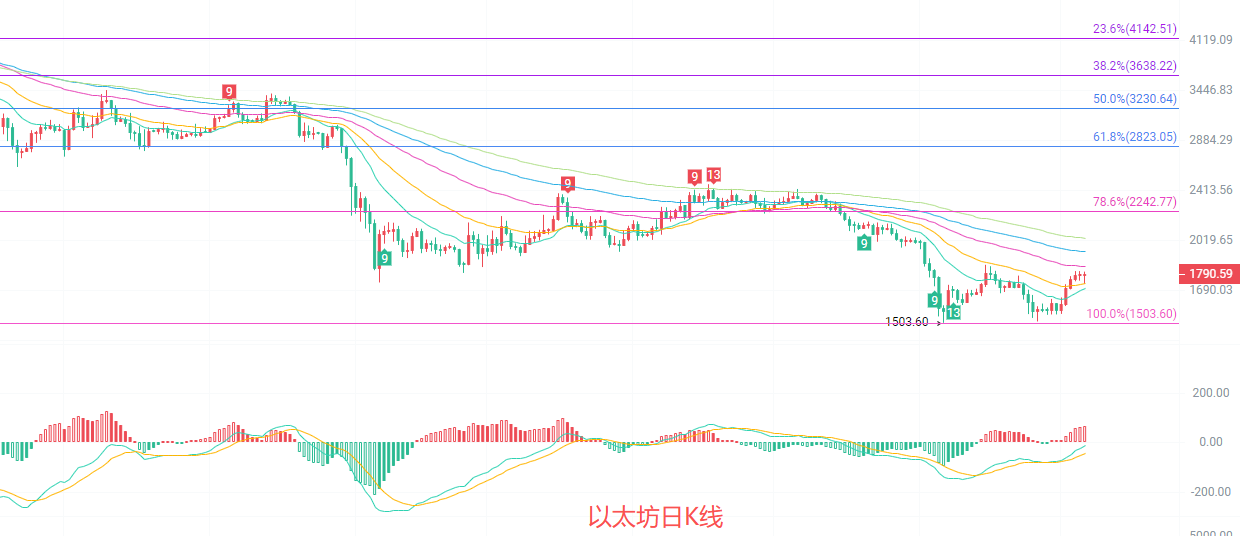
The daily candlestick is above the EMA15 and EMA30 short-term moving averages, currently testing the EMA60 resistance. In the MACD indicator, the DIF has crossed above the DEA forming a golden cross, and the red bars continue to widen, indicating a recovery in upward momentum. The Bollinger Bands show that the price is struggling near the middle band, with the upper band at 1833 forming strong short-term resistance and the lower band at 1518 providing strong support. Overall, the daily chart is still in the rebound stage of a downtrend and has not yet formed a clear reversal signal.
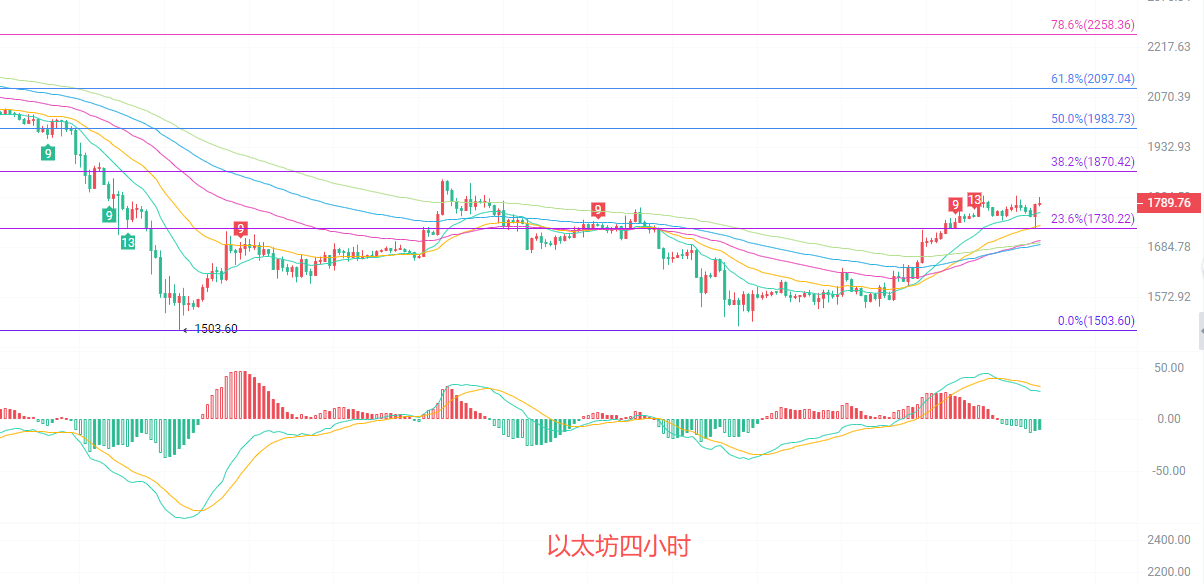
The four-hour candlestick is near the upper Bollinger Band at 1801, with a continued short-term upward trend. The EMA15 and EMA30 moving averages are aligned upwards, and the price has found support when retracing to the moving averages, indicating sufficient short-term upward momentum. Although the MACD red bars show signs of shortening, the DIF remains above the DEA, and no obvious turning signal has appeared. The Fibonacci 38.2% resistance at 1870 and the 23.6% support at 1730 are key areas for the upcoming price action; the current price is at the upper end of the oscillation, and one should be cautious of the risk of pullback after a rise.
Short-term reference:
Support from 1750 to 1700 for upward movement, stop-loss at 1660, target 1820 to 1870.
Resistance from 1850 to 1880 for downward movement, stop-loss at 1910, target 1800 to 1750.
Specific operations should be based on real-time market data. For more detailed information, you can consult the author. There may be a delay in the article release; it is suggested for reference only and risks are borne by the reader.

Kind Reminder: The above content is solely created by the author of the official account; the ads at the end of the article and in the comments section are not related to the author. Please be cautious in distinguishing them. Thank you for reading.
免责声明:本文章仅代表作者个人观点,不代表本平台的立场和观点。本文章仅供信息分享,不构成对任何人的任何投资建议。用户与作者之间的任何争议,与本平台无关。如网页中刊载的文章或图片涉及侵权,请提供相关的权利证明和身份证明发送邮件到support@aicoin.com,本平台相关工作人员将会进行核查。