Coin Circle Liying: 7.2 Bitcoin (BTC) and Ethereum (ETH) Latest Market Analysis
The current price of Bitcoin is 60000, calm before the storm waiting for the wind to come. The technical indicator EMA moving average, EMA7 has already formed a golden cross and the price stands above the short-term lifeline, which is the first signal of a short-term strengthening. The MACD indicator's bullish momentum is still insufficient, more like a technical correction after an overselling. Currently, the Bollinger Bands are narrowing very tightly, with both the upper and lower bands moving closer to the middle band, compressing the price within a narrow channel of 58000-60000. This narrowing pattern often indicates an imminent occurrence of a large one-sided market. As long as a large bullish candlestick breaks through the upper band resistance at 60100, it can confirm the reversal signal; otherwise, touching the upper band may easily trigger a new round of selling pressure.
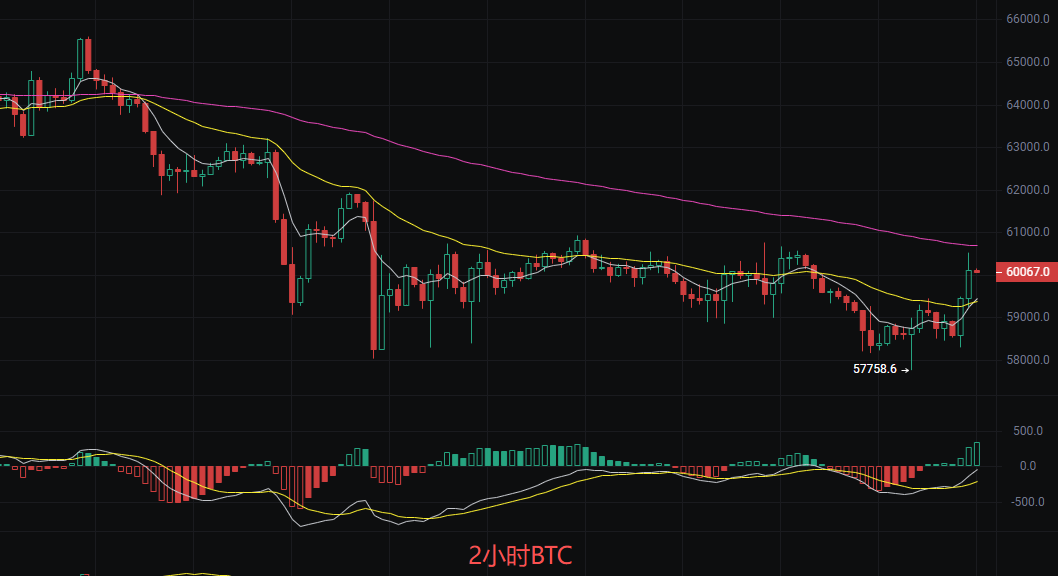
Short-term strategy reference:
Buy at 59200-58700, stop loss at 58200, target 60300 aiming at 61200
Sell at 60800-61300, stop loss at 61800, target 60200 aiming at 59000
Ethereum
Before the article was published, the current price of Ethereum is 1617, during the previous drop, the trading volume shrank significantly, indicating that the selling pressure was not so strong anymore; in the past few days, small bullish candlesticks have been slowly climbing, suggesting that bulls are quietly accumulating. However, don't rush to chase high, as the upper range of 1650-1700 is a dense trap area, and a breakthrough will still depend on the volume. At this position, it is in an awkward period where there is pressure above and support below, with the moving average system showing a repair state after a bearish arrangement. The MACD indicator shows that bullish momentum is increasing, but it has not yet reached a strong zone. After touching the upper band at 1607, the Bollinger Band slightly retreated, the middle band at 1582 has become a short-term support, and the lower band at 1557 is a strong support level. Overall, the indicators resonate showing a short-term bullish bias, but the mid-term trend has not completely reversed.
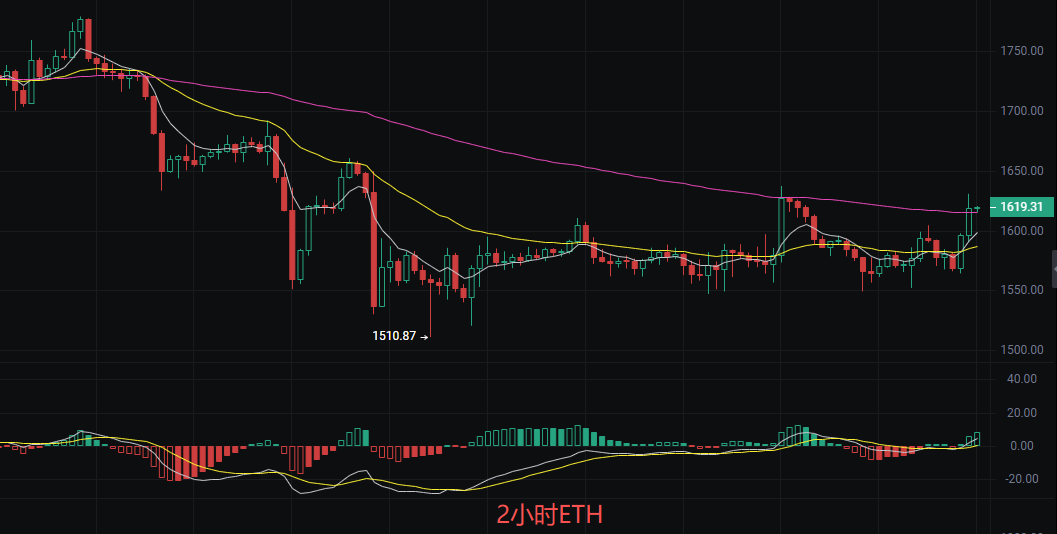
Short-term point reference:
Buy at 1540, defense at 1500, stop loss at 1450, target 1600 aiming at 1650
Sell at 1650, defense at 1700, stop loss at 1750, target 1600 aiming at 1550
The above content is exclusively original from Liying, please indicate the source when reprinting! Article publication reviews may have latency, market conditions change rapidly, and the above suggestions are for reference only at your own risk.

Warm Reminder: The above content is solely created by the author, the advertisements at the end of the article and in the comment section are unrelated to the author, please discern carefully, thank you for reading.
免责声明:本文章仅代表作者个人观点,不代表本平台的立场和观点。本文章仅供信息分享,不构成对任何人的任何投资建议。用户与作者之间的任何争议,与本平台无关。如网页中刊载的文章或图片涉及侵权,请提供相关的权利证明和身份证明发送邮件到support@aicoin.com,本平台相关工作人员将会进行核查。