Crypto Circle Academician: On May 24, the daily Bollinger Bands for Ethereum opened downward, and the lower support has been repeatedly breached? Latest market analysis and operational advice
The current price of Ethereum is 2075. Yesterday, it was mentioned that there would be a deep dive, and as a result, after sending out the message yesterday, the dive occurred. Now, the second-largest cryptocurrency is in a weak oscillation, and any rebound is an opportunity to go down, which is not suitable for bottom fishing. Some people are afraid to buy the dip, worried about a drop, and fearful of going short, worried about a rise, lacking a personal system, with no 100% execution power, always anxious before trading and regretting after trading! This state truly feels unsuitable for the crypto circle. To get back to the point,
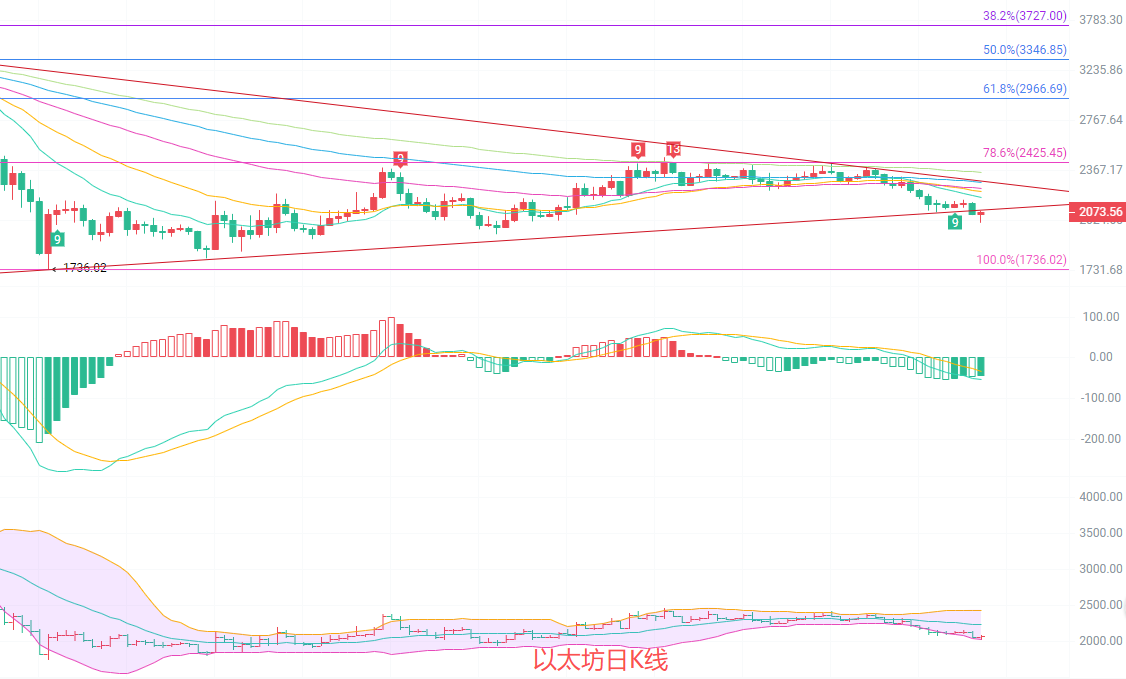
The daily candlestick chart is in a continuation phase of the downward trend. The price of 2074 is below all moving averages, with EMA15/30/60 forming layered pressure, confirming the current weak pattern with moving averages aligned downward. In the MACD indicator, both the DIF and DEA lines continue to move downward. Although the MACD green bars have decreased in volume, they remain below the zero axis, indicating that the downward momentum has not completely released. The Bollinger Bands are opening downward, and the price is running along the lower band. The short-term upper pressure level is near the middle band at 2233. Only an effective breakthrough here would provide a chance to reverse the daily downward trend.
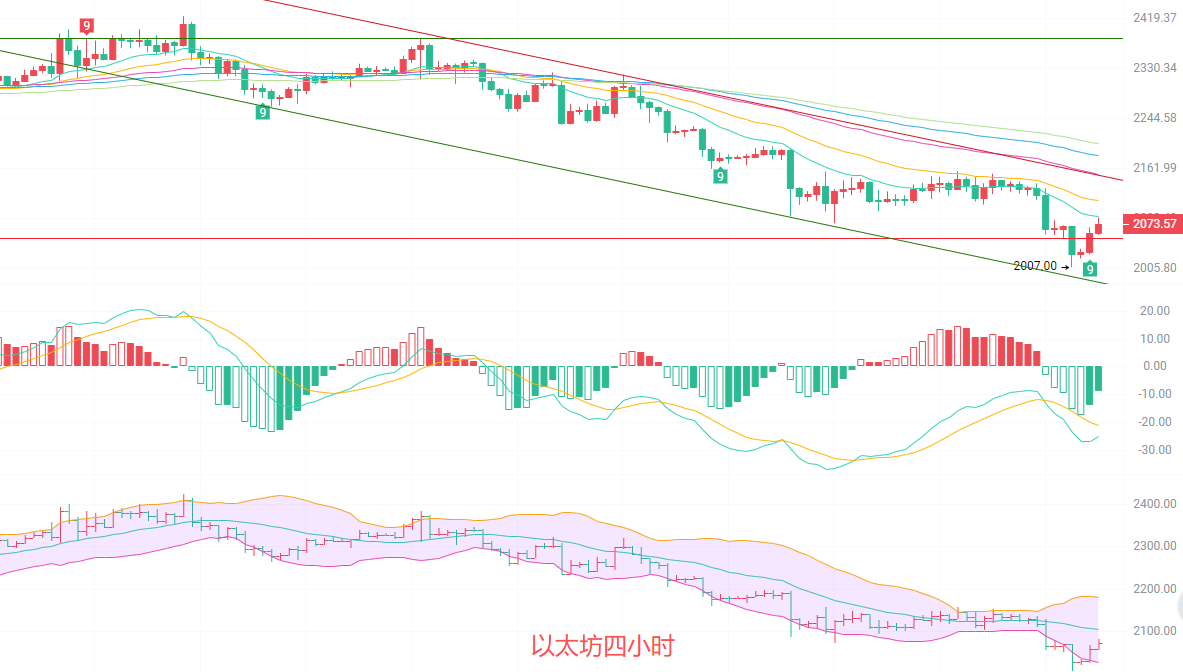
The four-hour candlestick chart is showing a weak consolidation trend after a decline, with the price oscillating near the lower Bollinger Band. The short-term moving averages EMA15/30 are consistently moving downward, exerting pressure on the price. In the MACD indicator, there are signs of a golden cross between DIF and DEA, but they are still operating below the zero axis, and the green bars are continually shortening, indicating a weakening of the downward momentum, but not yet forming a clear upward reversal signal. The upper and lower Bollinger Bands are continuously narrowing, compressing the short-term volatility range. The upper pressure is near 2105, while the lower support is around 2028. After breaking through the range, it is highly likely that the existing trend will continue.
Short-term reference:
Going up from 2100 to 2120, stop loss at 2150, target looking at 2050 to 2000
Going down from 2010 to 2020, stop loss at 1980, target looking at 2070 to 2100
If the price breaks below the 2000 support, then abandon the upward strategy and continue to follow the downward trend. The current trend is biased downward, and going up is only suitable for short-term speculation, with strict stop-loss required to avoid deep entrapment.
Specific operations should primarily rely on real-time market data. For more information, please consult the author. The article may have delayed publication; it is suggested to be for reference only, and risks are borne by the reader.

Friendly reminder: The above content is solely created by the author on Weibo. The advertisements at the end of the article and in the comments section are unrelated to the author. Please discern carefully. Thank you for reading.
免责声明:本文章仅代表作者个人观点,不代表本平台的立场和观点。本文章仅供信息分享,不构成对任何人的任何投资建议。用户与作者之间的任何争议,与本平台无关。如网页中刊载的文章或图片涉及侵权,请提供相关的权利证明和身份证明发送邮件到support@aicoin.com,本平台相关工作人员将会进行核查。