Cryptocurrency Academician: The downward trend of Bitcoin since May 24 has formed! Is any rebound an opportunity to exit? Latest market analysis and operational suggestions
The current price of Bitcoin is 75,800. What can we say these days? I have reminded many times to be cautious going south and to avoid going north. It really confirms that saying: newbies die from chasing highs, veterans die from bottom-fishing, and experts die from leverage. It's true; the same pattern. After a sharp drop, wait for a stop before observing a trend reversal, after that wait for a pullback, and then wait for confirmation before entering the market. Before this, any pullback is an opportunity to go south; otherwise, all rebounds are traps.
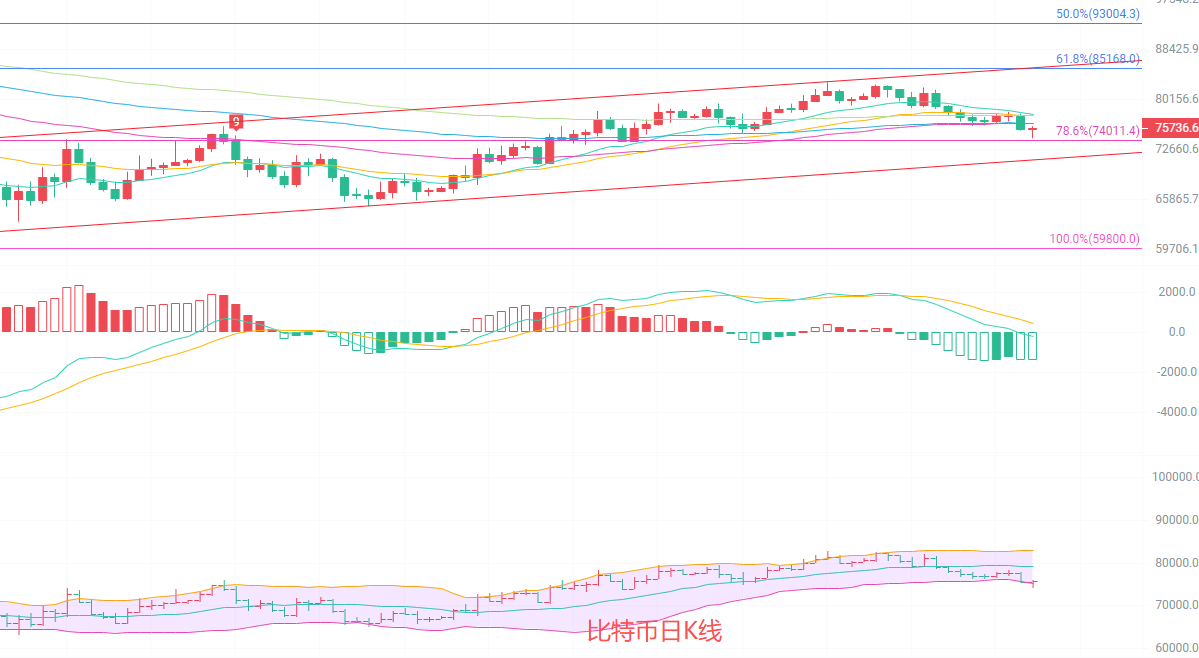
On the daily K-line, the EMA30 and EMA60 above form dual pressure, and the overall state remains in a weak recovery phase after the previous decline. The MACD indicator shows that the DIF continues to operate below the DEA; although the green bars show signs of volume reduction, there is no clear golden crossover signal formed, and the downward trend has not reversed. The Bollinger Bands are currently in a narrowing state, with the price tightly adhering to the lower track; strong support is around 75,184. If this level breaks down, it is highly likely to retest the previous low support area. There are no clear reversal signals in the short term, and the dominant trend is still a weak fluctuation.
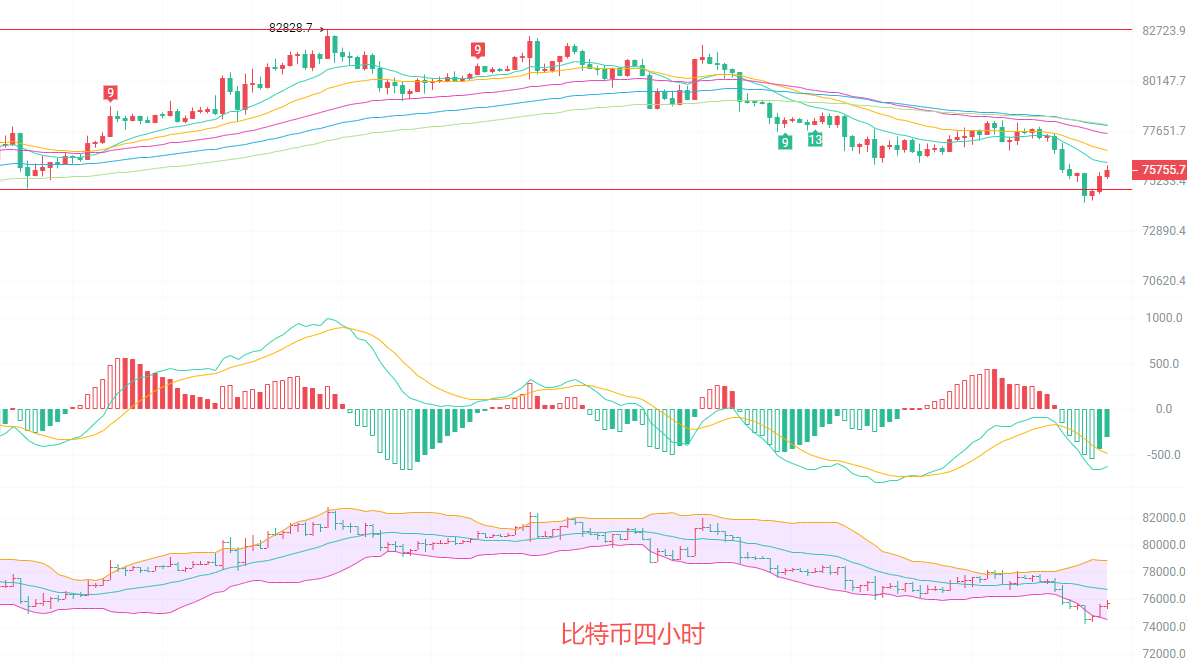
The four-hour K-line is currently in a clear downward trend. EMA15 and EMA30 are arranged southward, with the price being repeatedly suppressed by EMA15 during multiple rebounds, failing to break through effectively. The MACD indicator continues to weaken below the zero line, with green bars continuously releasing, indicating sufficient short-term downward momentum. The Bollinger Bands are opening downwards, and the price continues to move towards the lower track after breaking down through the middle track; the current price is near the lower track of the Bollinger Bands. A minor rebound may occur in the short term, but the rebound height is limited, with strong resistance around 76,800.
Short-term strategy reference: follow the major trend, with small stops and quick in-and-out trades.
Go south from 76,800 to 77,100, with a stop loss at 77,500, targeting 75,500 to 74,500.
Go north from 74,600 to 74,100, with a stop loss at 73,800, targeting 76,000 to 76,500.
Only trade what you understand; if you don't understand it, stay in cash. Don't operate blindly, don't bet against the market, and first regain your mindset and discipline.
Specific operations should be based on real-time market data. For more information, please consult the author. The publication of the article may have a delay and is for reference only; risks are to be borne by yourself.

Warm reminder: The above content is solely created by the author on Weibo. The advertisements at the end of the article and in the comments section have nothing to do with the author; please discern carefully. Thank you for reading.
免责声明:本文章仅代表作者个人观点,不代表本平台的立场和观点。本文章仅供信息分享,不构成对任何人的任何投资建议。用户与作者之间的任何争议,与本平台无关。如网页中刊载的文章或图片涉及侵权,请提供相关的权利证明和身份证明发送邮件到support@aicoin.com,本平台相关工作人员将会进行核查。