Academician of the Cryptocurrency Circle: On May 23, resonance signals appeared in the four-hour line, is the bitcoin fluctuation about to break? Latest market analysis and operation suggestions
The current price of bitcoin is 76850, the big coin has been slowly boiling the frog for months, gradually consuming the panic mood from the beginning of the year, and the main forces have also digested the chips acquired in these months. The short-term market is like a money-giving scenario for most retail investors. In a fluctuating market, opportunities seem plentiful, but they are all traps; chasing highs and killing lows is just working for exchanges and major players. Based on the current expectations, there is a high probability of another wave of bottom probing, and before that, clearing positions to layout is advisable.
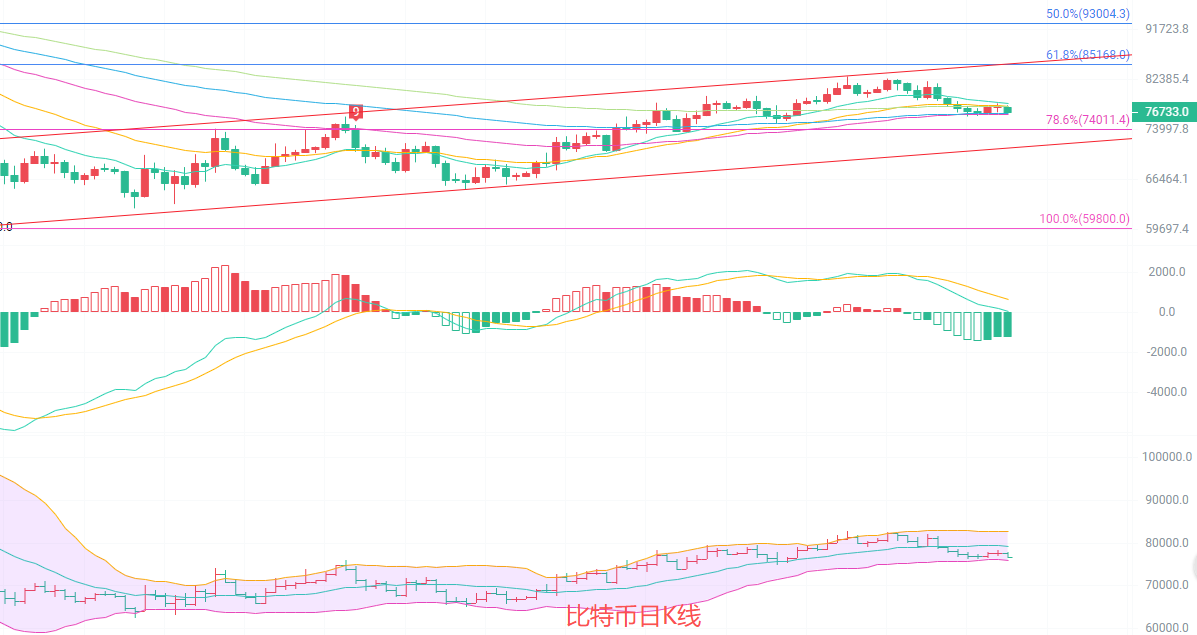
The daily candlestick price has just retested near the EMA15 and EMA30 moving averages, and the moving average system is still arranged upward, but the upward momentum in the short term has significantly weakened. The MACD indicator shows that DIF and DEA continue to decline after forming a dead cross above the zero axis, with increasing green bars, and the upward strength is receding. The Bollinger Bands are opening flat, and the price is running near the middle track, with an upper and lower track range of about 75911-79317. Daily fluctuations are continuously compressed, and both bulls and bears are repeatedly contending in this range, indicating a critical node for direction selection in the short term.
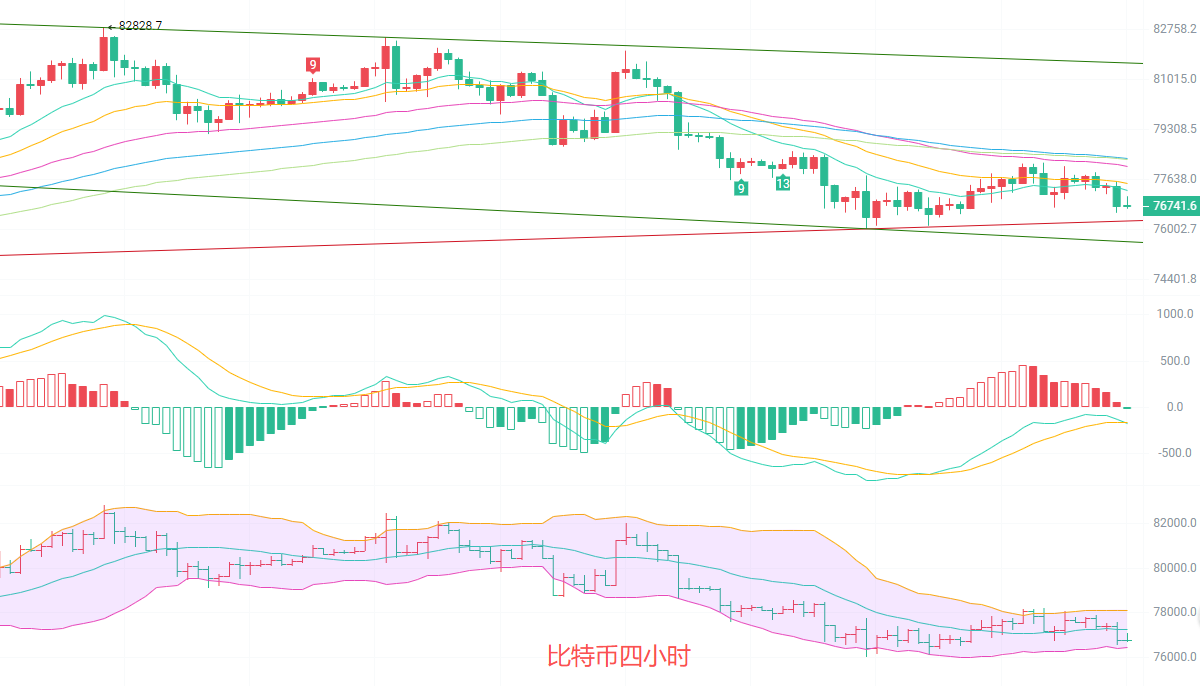
The four-hour chart has already broken through the EMA15, EMA30 and other short-term moving averages, with the moving averages turning downward to form pressure, indicating a weak short-term trend. The MACD indicator shows that DIF has crossed below DEA to form a dead cross, with green bars continuously released, and the downward momentum dominating in the shorter cycle. The middle track of the Bollinger Bands is tilting downward, with the price running below the middle track; the upper track resistance is about 78114, and the lower track support is about 76437. The price has shown a slight rebound near the support level, but the trading volume is insufficient. The rebound leans more towards a technical correction and has not yet formed a clear reversal signal, with the downward trend still leading the small cycle rhythm.
Short-term strategy reference: follow the trend of the larger cycle, with small stop losses for quick entry and exit
The lower range of 76500 to 76000 is upward, with a stop loss at 75500, aiming for 77500 to 78000
The upper range of 77500 to 78000 is downward, with a stop loss at 78500, aiming for 77000 to 76500
Only trade in markets you understand. If you don't understand, stay in cash, don't trade blindly, and don't gamble against the market; first get your mindset and discipline back.
Specific operations should be based on real-time data from the market. For more information, you can consult the author. The article may have delays in publication, suggestions are for reference only, and risk is borne individually.

Friendly reminder: The above content is solely created by the author on Weibo. The ads at the end of the article and in the comments section have no relation to the author. Please be cautious in distinguishing, and thank you for reading.
免责声明:本文章仅代表作者个人观点,不代表本平台的立场和观点。本文章仅供信息分享,不构成对任何人的任何投资建议。用户与作者之间的任何争议,与本平台无关。如网页中刊载的文章或图片涉及侵权,请提供相关的权利证明和身份证明发送邮件到support@aicoin.com,本平台相关工作人员将会进行核查。


