This week, the cryptocurrency market continues its high-level volatile pattern, with increasing divergence between bulls and bears, and the direction of choice is imminent. After stabilizing and rebounding at endpoint 32 (38.88 USD), whether HYPE can break through 43.17 USD and challenge the previous high of 45.76 USD will be crucial for the continuation of the daily wave V structure; while BTC, after completing the D wave rebound, is facing a direct test of the core watershed at 79,500–80,600 USD: breaking through will change the situation, while being under pressure will lead to a pullback. Once the direction is clear, the market may present a significant one-sided trend.
The current market fosters opportunities while harboring risks, and it is crucial to avoid chasing highs and cutting losses. Only by relying on clear structural judgments and strict discipline execution can one capture certain opportunities in a volatile pattern, ensuring steady growth.
This week's core trading viewpoints summary:
- In-depth analysis of HYPE's hourly trend structure (detailed explanation in the first part)
- HYPE's market prediction and short-term trading strategy for this week (detailed explanation in the second part)
- BTC's multi-cycle trend structure analysis (detailed explanation in the third part)
- BTC's market prediction and middle-to-short term trading strategy for this week (detailed explanation in the fourth part)
Last week's trading strategy and core viewpoint market validation:
- Short-term trading results for HYPE: HYPE completed a short-term long position operation last week (1x leverage), achieving a profit of approximately 3.25% (detailed explanation in Table 1)
- Validation of BTC's mid-term trading results: Last week, Bitcoin's medium-line strategy executed a clearance operation as planned. After the price stabilized above the bullish-bearish band, we fully closed the medium-line short position established at around 89,000 USD (1x leverage) near 75,500 USD, resulting in a final profit of about 15.17%.
- Validation of BTC's market trend prediction: In last week's article, we pointed out that the market would maintain a wide-range volatile pattern between 73,500 and 79,000 USD. The current market trend confirms our previous viewpoint.
1. HYPE: In-depth analysis of hourly trend structure
HYPE_4-hour K-line chart
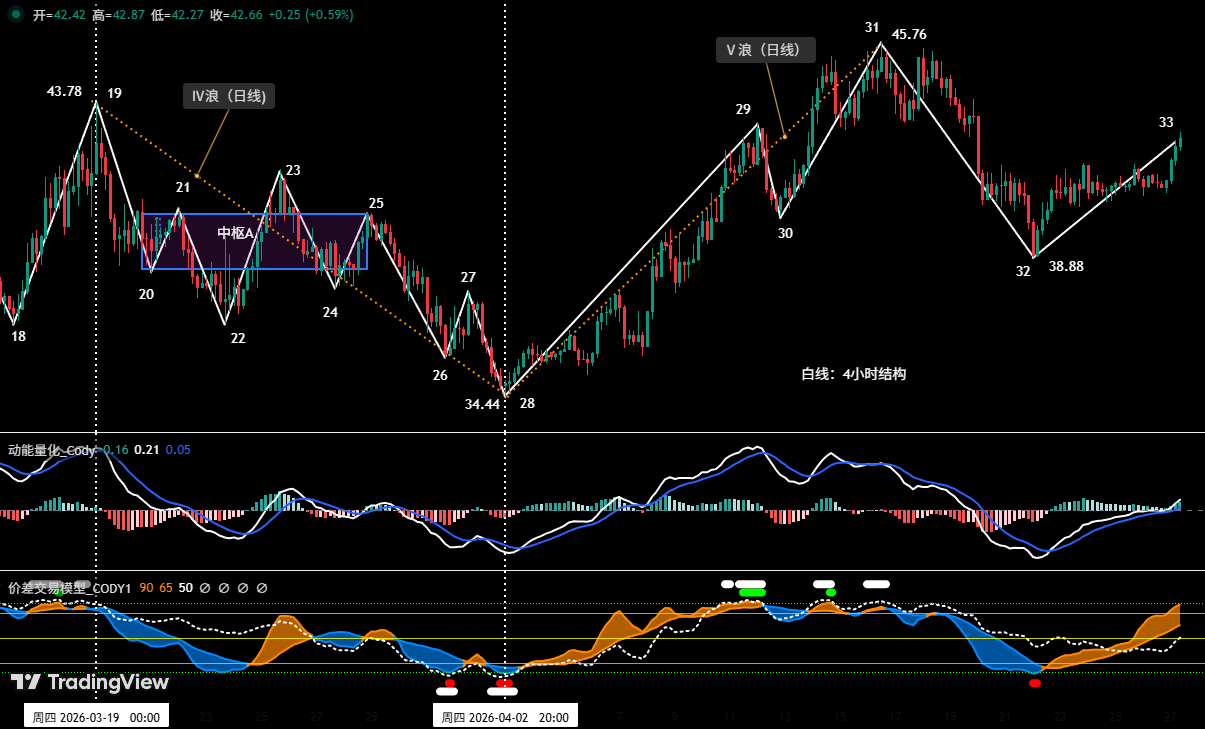
Figure 1
1. As shown in (Figure 1), the daily wave V upward trend that started from the low of 34.44 USD on April 2 can be further subdivided into a five-segment upward structure in the 4-hour cycle, namely 28-29, 29-30, 30-31, 31-32, and 32-33. Currently, the market is operating in the upward segment 32-33.
2. The 4-hour chart shows a key change in price movement last week: endpoint 32 (38.88 USD) rapidly broke below endpoint 30 (40.17 USD). Subsequently, the market received strong buy support near the 38.5 USD area and the price rebounded back above 40.17 USD. The focus now is on the sustainability of the rebound:
- If the price can continue to rise and successively break through 43.10 USD and the previous high of 45.76 USD, then the daily wave V upward trend starting from the low on April 2 will continue.
- If the current rebound is weak and fails to effectively break through and create a new high, it may form a classic trend reversal structure of "pullback failing to create a new high, rebounding without surpassing a previous low." If this pattern is confirmed, it signifies that the upward trend that started on January 21 may very likely be coming to an end, potentially leading the market into a daily adjustment cycle.
2. HYPE: Market prediction and short-term trading strategy for this week
1. HYPE's market trend prediction for this week:
This week’s core viewpoint for HYPE: Focus on the rebound momentum and height started from endpoint 32 (38.88 USD).
If the rebound is strong and the price effectively breaks through and stabilizes above the previous high of 45.76 USD (endpoint 31), it indicates abundant market buying power, allowing the daily wave V upward structure to continue, with a new upward space expected to open, and the next resistance located around 50 USD.
If the rebound is weak and the price fails to surpass the previous high of 45.76 USD, one must be cautious of the market forming a technical pattern of "rebound not making new highs." This may imply that the upward trend momentum starting from the low of January 21 is exhausted, and 45.76 USD may become the end of the current upward move while the market possibly shifts to a daily adjustment or volatility pattern.
2. HYPE's short-term trading strategy for this week:
- Based on the overall upward trend forecast for the market, short-term operations should follow the trading principle of "trading in the same direction, buying on dips."
- Using 30-minute/60-minute operating periods and 30% position allocation, capture entry opportunities for long positions based on our self-constructed quantitative model signals.
- Opening strategy: If HYPE's price can effectively break through 43.17 USD and successfully stabilize, in conjunction with buy signals triggered by the two main models, consider entering long positions, controlling the position below 30% while strictly adhering to stop-loss discipline.
3. Bitcoin: Multi-cycle trend structure analysis
1. BTC daily level trend structure analysis: (based on the market dynamics after the low on February 6, 2026)
Bitcoin _ Daily K-line chart:
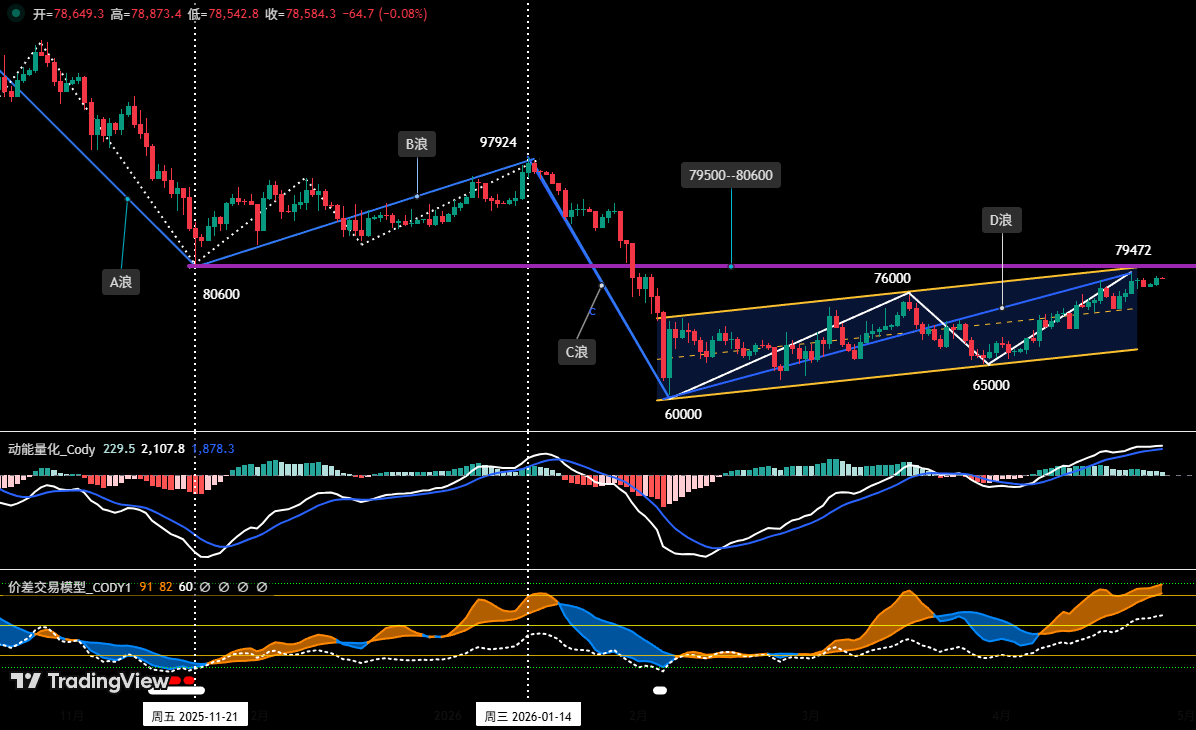
Figure 2
From the daily trend structure, the adjustment that began at the high of 126,200 USD in October 2025 to the low of 60,000 USD on February 6 has presented a clear A-B-C three-wave structure. Among them, 80,600 USD is not only a critical low point on November 21, 2025, but also the starting point for the subsequent B wave rebound, making its technical significance substantial. Therefore, the current price is facing pressure in the range of 79,500 to 80,600 USD, which has formed the market's core "watershed."
D wave (rebound wave): Based on the daily trend structure analysis, the rebound starting from Bitcoin's low of 60,000 USD on February 6 can be temporarily defined as the D wave (rebound wave). This rebound has been running for about 80 trading days, and on April 22, it reached a new rebound high of 79,472 USD.
As shown in (Figure 2), this round of D wave rebound has been running along a clear rising channel: its lower track is formed by connecting the two lows of February 6 and March 29, while the upper track is created by drawing a parallel line to the lower track through the high point of March 17. Currently, the price is near the upper track of the channel.
In summary: The current price is facing dual pressure from the upper track of the channel and the resistance area of 79,500 to 80,600 USD, and a direct breakout is expected to be challenging. Special attention is needed to see whether the 79,500 to 80,600 USD area can be effectively broken through, as this will determine whether the rebound starting from the low of February 6 is a technical repair or a trend reversal, further judging whether 60,000 USD is confirmed as the final low point of this round of daily adjustments.
2. BTC hourly level trend structure in-depth analysis: (using 4-hour as the analysis period)
Bitcoin _4-hour K-line chart
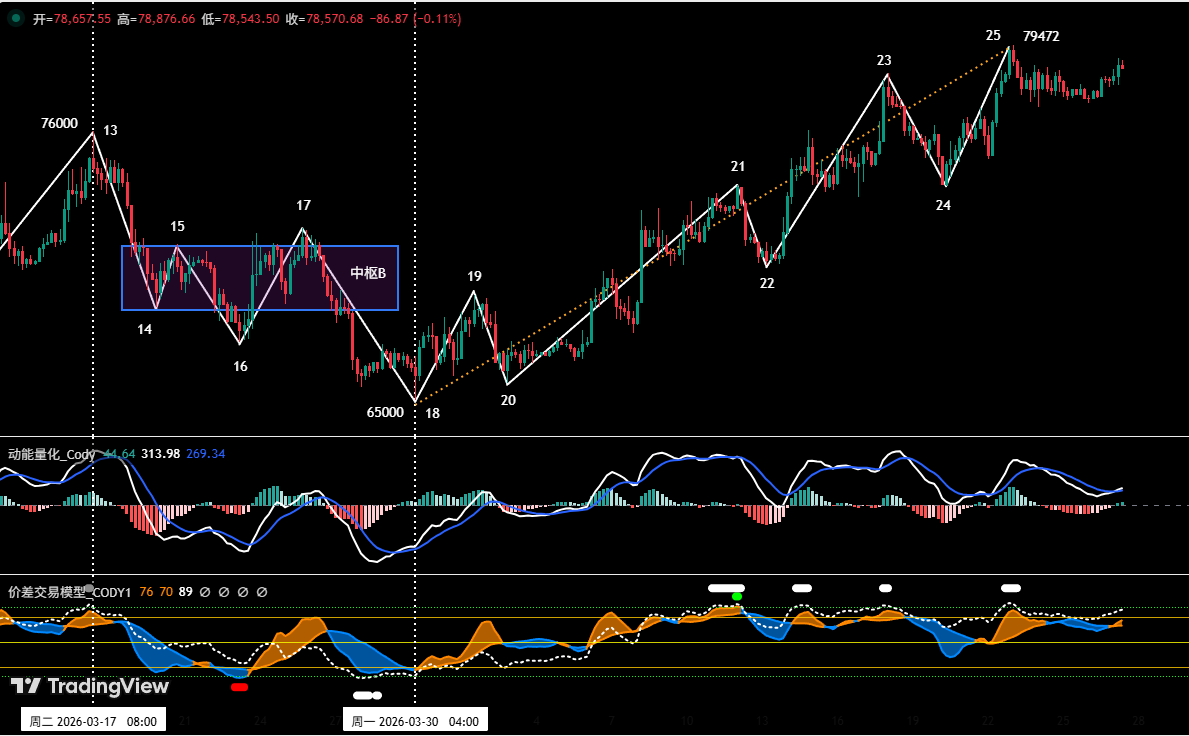
Figure 3
Based on the market evolution after the low of 65,000 USD on March 30. As shown in (Figure 3), BTC started a fluctuating upward trend from the low of 65,000 USD on March 30, forming a total of seven segments in the upward structure from endpoint 18 to endpoint 25: 18-19, 19-20, 20-21, 21-22, 22-23, 23-24, 24-25.
(Figure 3) displays: First, the trend structure from endpoint 18 to endpoint 25 is relatively complete (having run for 7 segments); Second, based on our self-built spread trading model, endpoint 25 has triggered a top warning signal (white dots in the figure); third, based on the momentum quantification model, comparing the upward momentum of segments 22-23 and 24-25, the model has issued a signal for momentum divergence.
In summary: From the hourly trend structure, based on the above three points, BTC is likely to encounter resistance and begin adjustments in this area.
4. Bitcoin: Market prediction and trading strategy for this week
1. BTC's market trend prediction for this week:
This week's core viewpoint: Focus on the test results of the key resistance area of 79,500–80,600 USD.
- If the price breaks upward, wait for it to effectively stabilize before seeking to enter;
- If it is pressured back here, primary support looks toward around 76,000 USD, and if this position is effectively broken, the market may enter a daily level adjustment.
2. Core resistance levels:
• First resistance area: 79,500–81,000 USD range (near the low point of November 2025)
• Second resistance area: 83,500–84,500 USD range (previously dense trading area for bulls and bears)
3. Core support levels:
• First support level: around 76,000 USD (previous rebound high)
• Second support level: around 73,500 USD (previous important support level)
• Third support level: 69,500–70,500 USD range (previous important support level)
4. Trading strategy for this week (excluding the impact of unexpected news)
① Mid-term strategy:
Bitcoin _ Daily K-line chart: (position monitoring model)
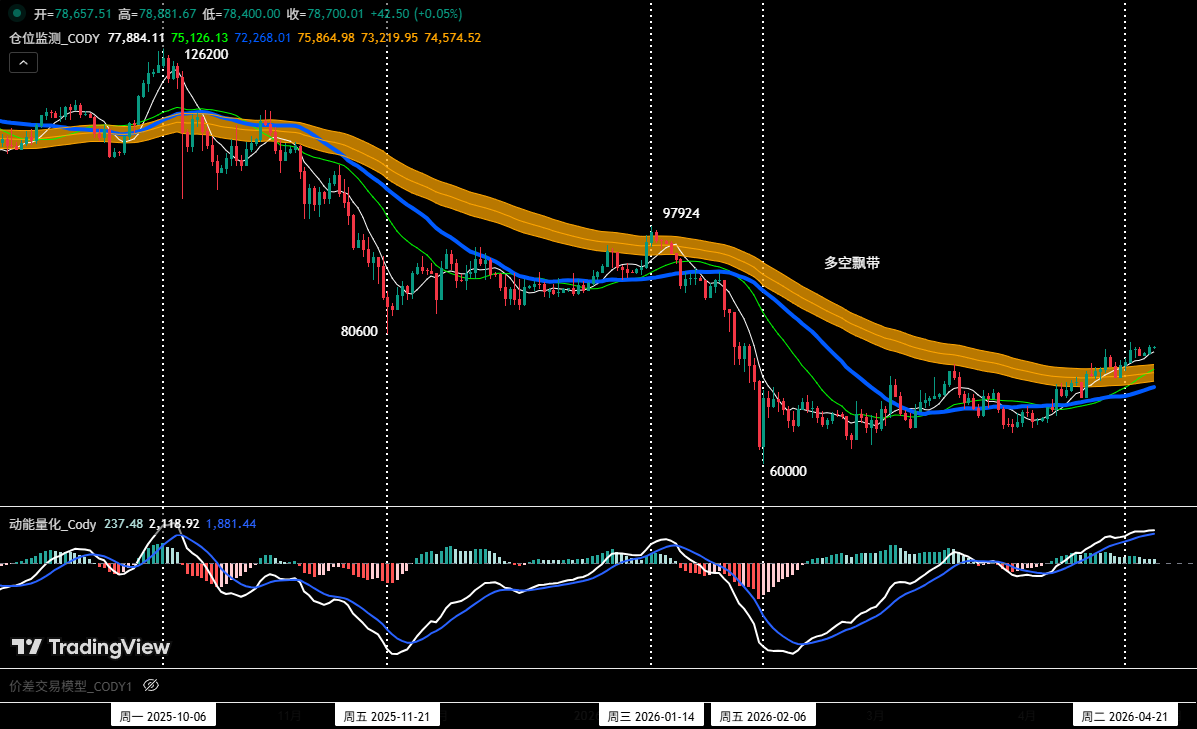
Figure 4
Position monitoring model: As shown in (Figure 4), the current price has stabilized above the bullish-bearish band. Based on the strategy rules, we will pause new mid-term layouts this week and maintain a flat position for observation. It is recommended to patiently wait for the market operation direction to be further clarified before making decisions.
② Short-term strategy: Use a 30% position, setting a stop-loss point, in accordance with support and resistance levels, seek to take "spread" opportunities (using 30 minutes/60 minutes as the operation cycle).
③ Based on the current market being in a high-level volatile pattern, with weakening upward momentum, short-term operations will continue to follow the principle of "shorting in the same direction." To dynamically respond to the market's complex evolution, we will strictly follow the signals generated by our self-built trading models and prepare A/B two specific operation plans in advance.
•Plan A: Rebound meets resistance, short on highs.
• Opening: When the price rebounds to the 79,500–80,600 USD range triggering a resistance signal and combining with model top signals, establish a 30% short position.
• Risk control: Initial stop-loss set above 81,000 USD.
• Closing: When the price drops near important support levels and combines with model signals, gradually close positions to take profits.
•Plan B: Shorting with a breakout.
• Opening: When the price continues to adjust, if it effectively breaks below support near 76,000 USD and combines with model top signals, establish a 30% short position in the same direction.
• Risk control: Initial stop-loss set above 77,500 USD.
• Closing: When dropping to support levels and combining with model signals, gradually close positions to take profits.
5. HYPE: Trading Review
1. Short-term trading review: (see Table 1)
We strictly followed the trading plan and completed a short-term (long) operation last week based on trading signals generated by our self-constructed spread trading model and momentum quantification model, resulting in a profit of 3.25%.
2. Summary of HYPE’s short-term trading details: (leverage *1x)
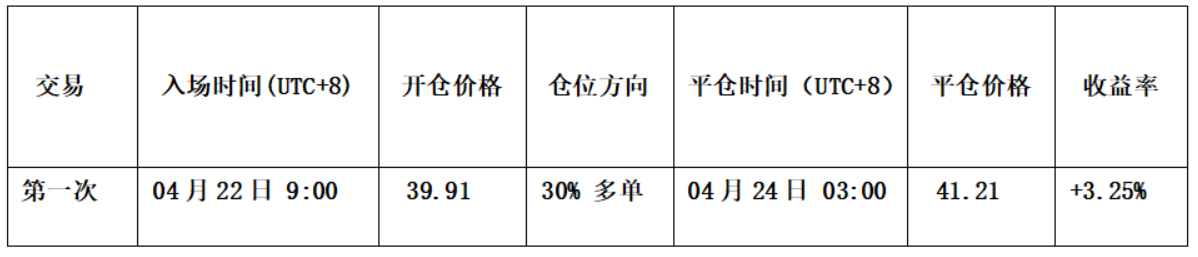
Table 1
3. Short-term trading review: (see Figure 5)
Opening strategy: First, the previous trend has run a complete adjustment structure of 5 segments; second, the spread trading model has preemptively issued a strong bottom warning signal (red dots, white dots in the figure); third, the momentum quantification model has triggered a bottom divergence signal. Therefore, we established a 30% long position at 39.91 USD.
Closing strategy: When the price rose to around 42 USD and encountered resistance, while the momentum quantification model triggered a top divergence signal, we closed all positions near 41.21 USD.
In summary: This trade successfully generated a profit of approximately 3.25%.
HYPE_60-minute K-line chart: (momentum quantification model + spread trading model)
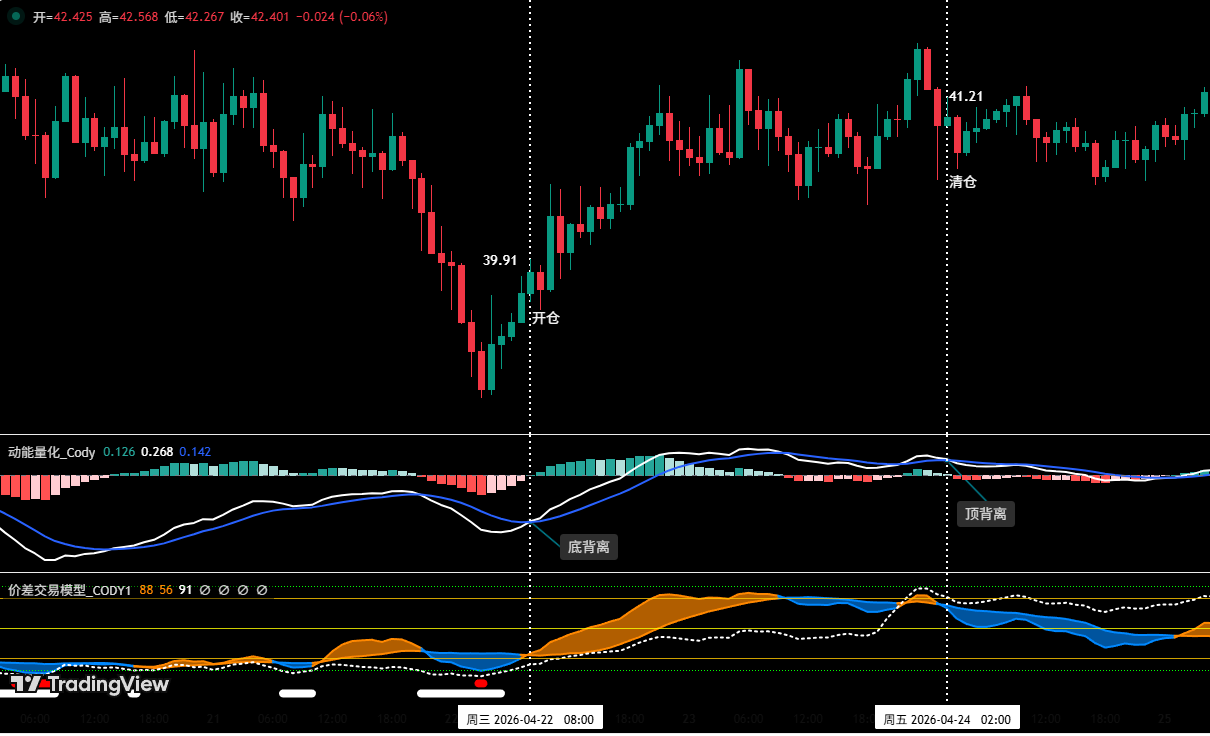
Figure 5 (short-term trading illustration)
6. Special reminder
- When opening positions: immediately set the initial stop-loss level.
- When profit reaches 1%: move the stop-loss to the entry cost price (breakeven point) to ensure capital safety.
- When profit reaches 2%: move the stop-loss to the position of a 1% profit.
- Continue to track: After this, for each additional 1% profit, the stop-loss will move in tandem by 1% to dynamically protect and lock in profits.
The financial market is ever-changing, and all market analysis and trading strategies need to be dynamically adjusted. All viewpoints, analysis models, and operational strategies mentioned in this article are derived from personal technical analysis and are for personal trading logs only, and do not constitute any investment advice or operational basis. The market has risks; please invest cautiously and do not make decisions based on this.
免责声明:本文章仅代表作者个人观点,不代表本平台的立场和观点。本文章仅供信息分享,不构成对任何人的任何投资建议。用户与作者之间的任何争议,与本平台无关。如网页中刊载的文章或图片涉及侵权,请提供相关的权利证明和身份证明发送邮件到support@aicoin.com,本平台相关工作人员将会进行核查。


