Original Author: Glassnode
Original Compilation: AididiaoJP, Foresigh News
Bitcoin returns to $78,000, accompanied by a revival of spot demand and ETF fund inflows. Short positions increase, and funding rates are negative, indicating potential for a short squeeze. However, realized profits are high, and volatility is soft, suggesting a need for caution, with resistance faced at the $80,000 level.
Abstract
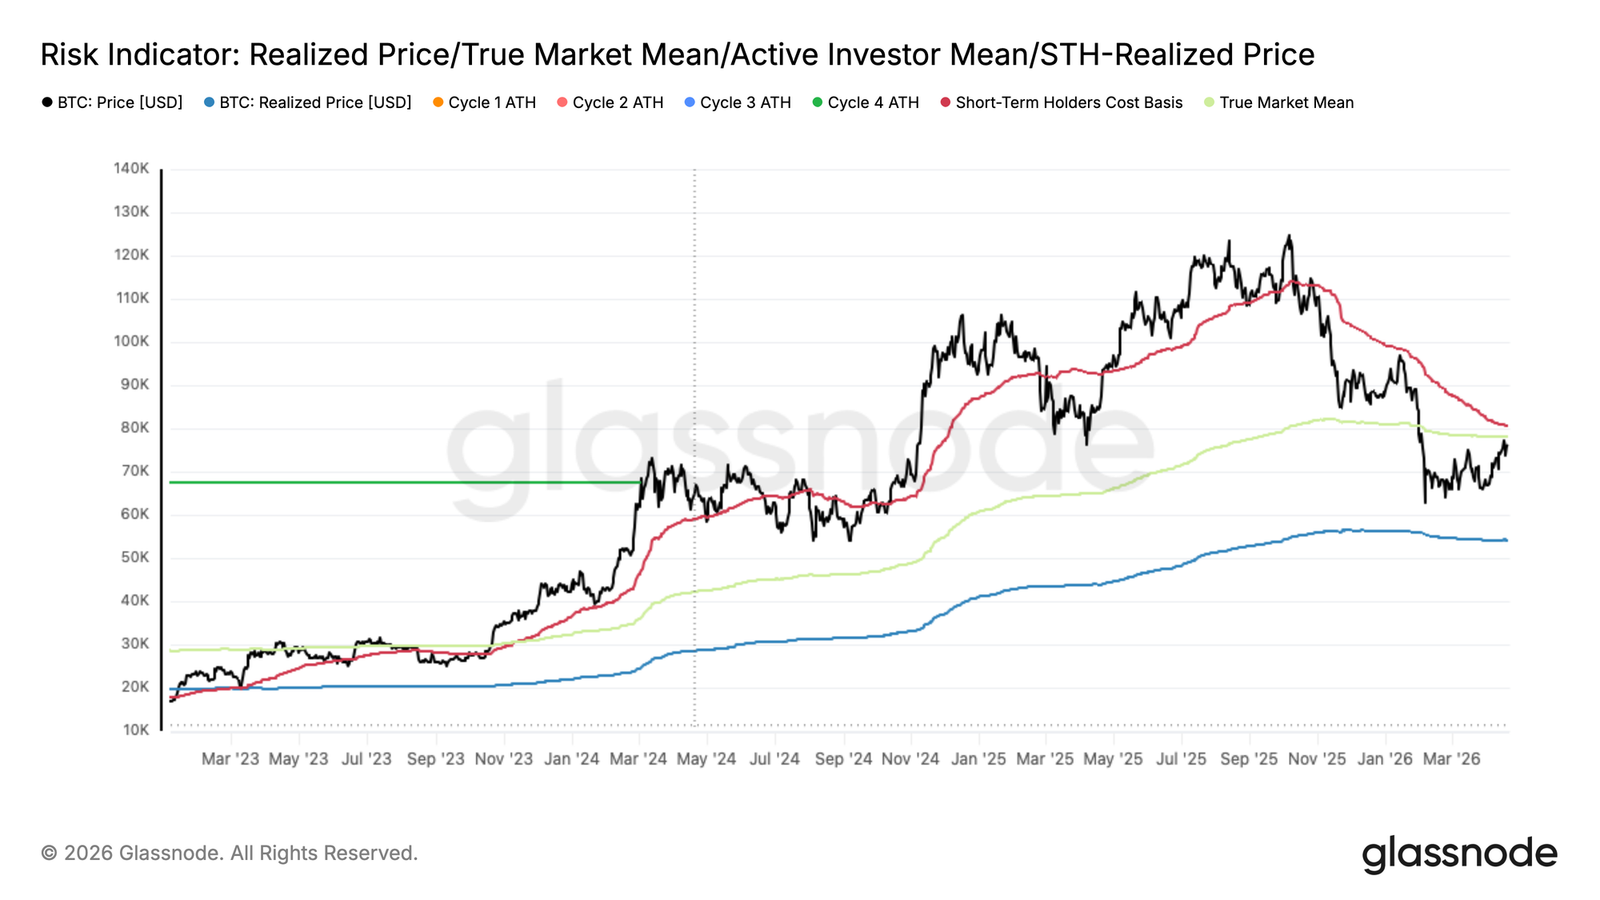
Bitcoin has broken above the True Market Mean of $78,100 for the first time since mid-January, marking a significant mean reversion. The short-term holder cost basis currently stands at $80,100, becoming the immediate resistance ceiling.
A rebound towards $80,000 would see more than 54% of recent buyers enter the profit zone; historically, this threshold often marks a point where selling pressure in a bear market rebound tends to exhaust. This is the second occurrence of a similar structure in the current cycle.
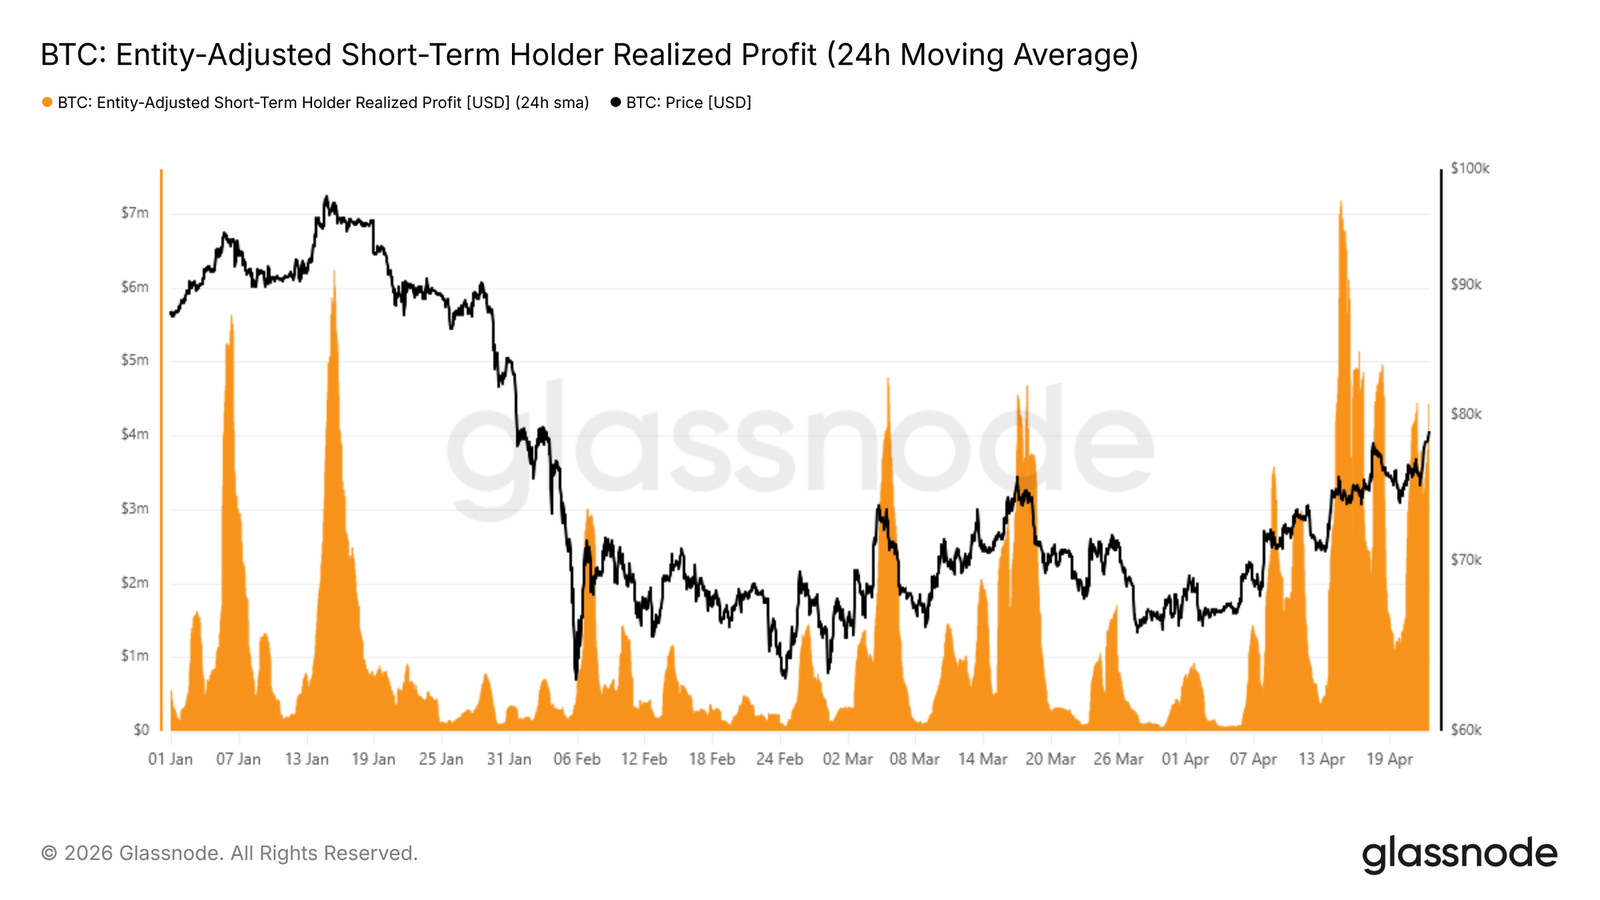
Realized profits for short-term holders have surged to $4.4 million per hour, nearly three times the $15,000 threshold seen at each local top so far this year. Caution is needed in the absence of meaningful demand catalysts.
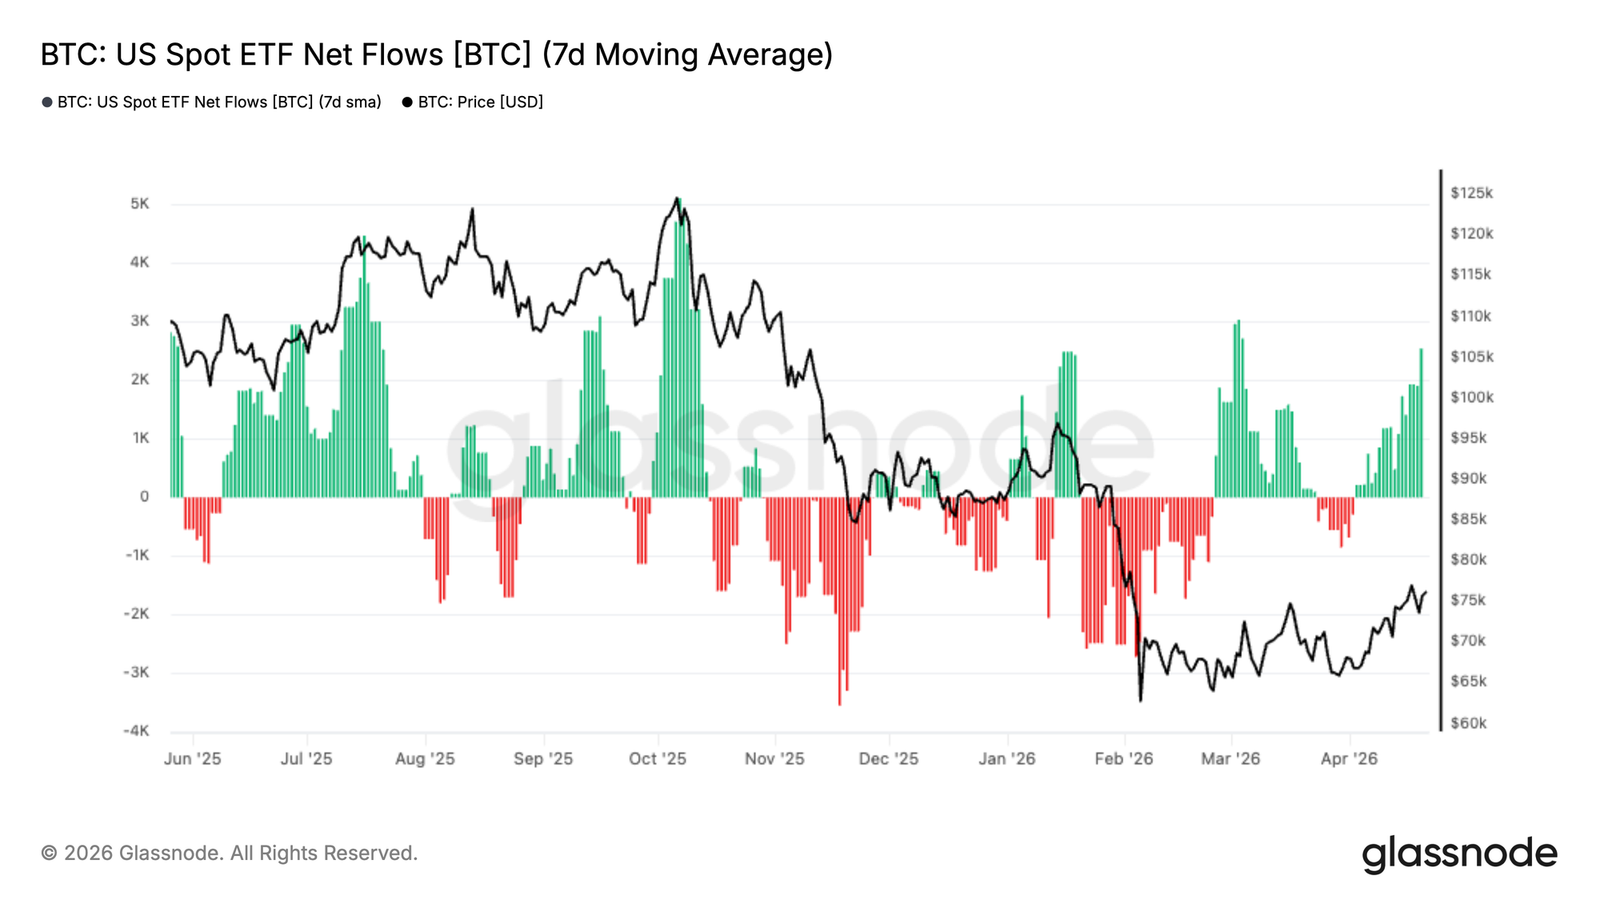
ETF fund flows have turned mildly positive again, with the 7-day moving average returning to inflow territory, indicating that institutional demand is beginning to return after a long period of outflows.
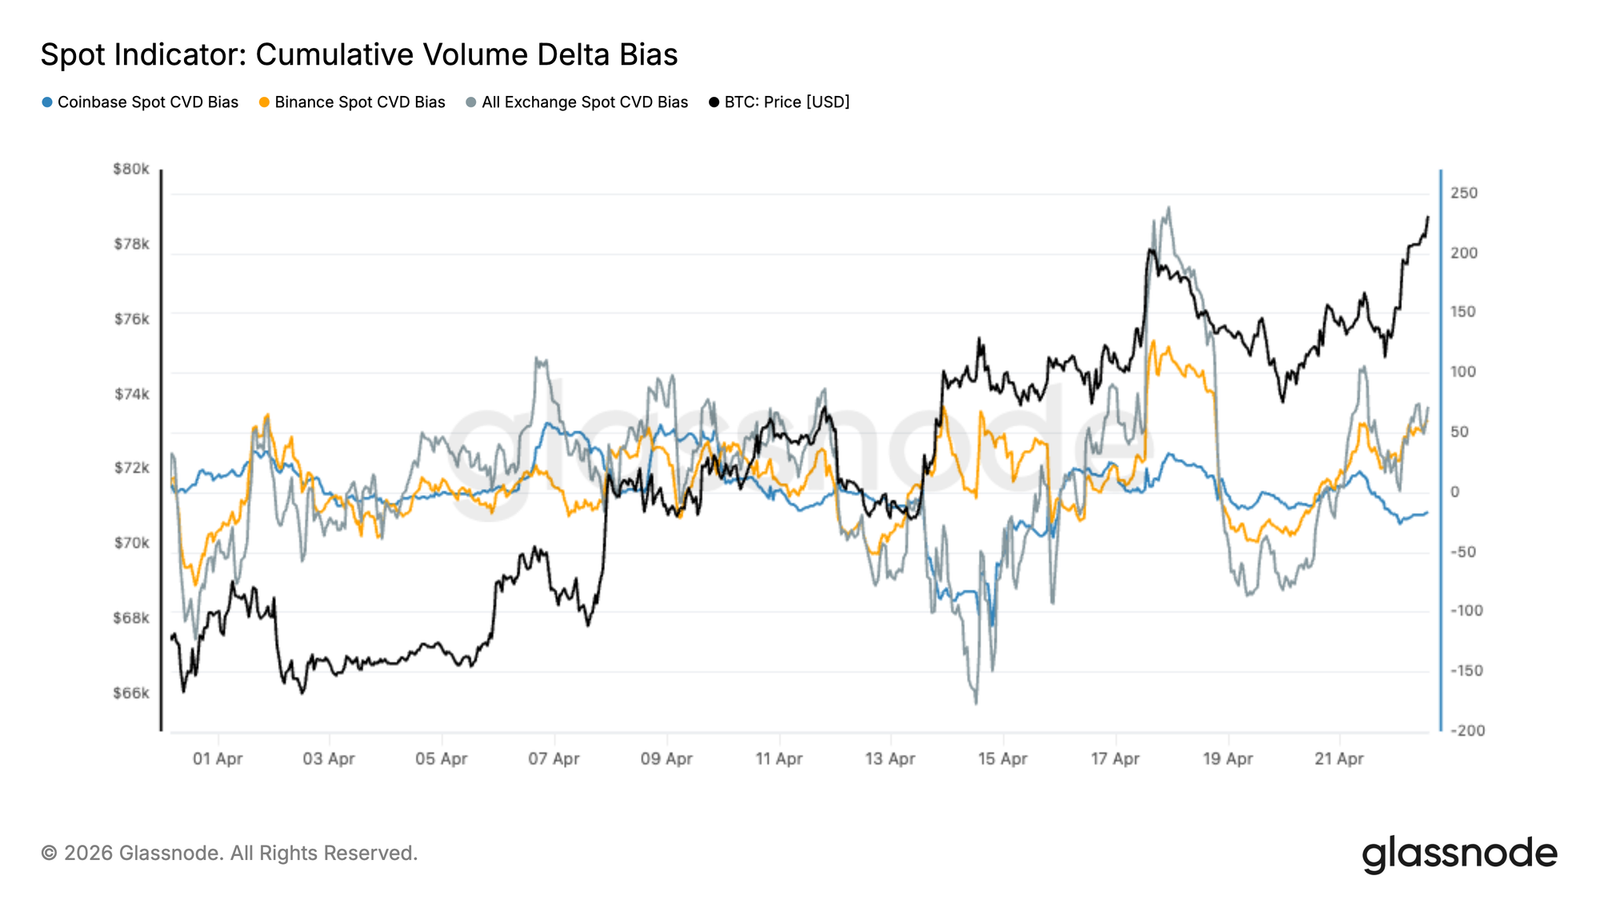
Spot demand is showing early signs of recovery, with cumulative volume delta turning positive, suggesting increased buying aggression, particularly in offshore trading venues.
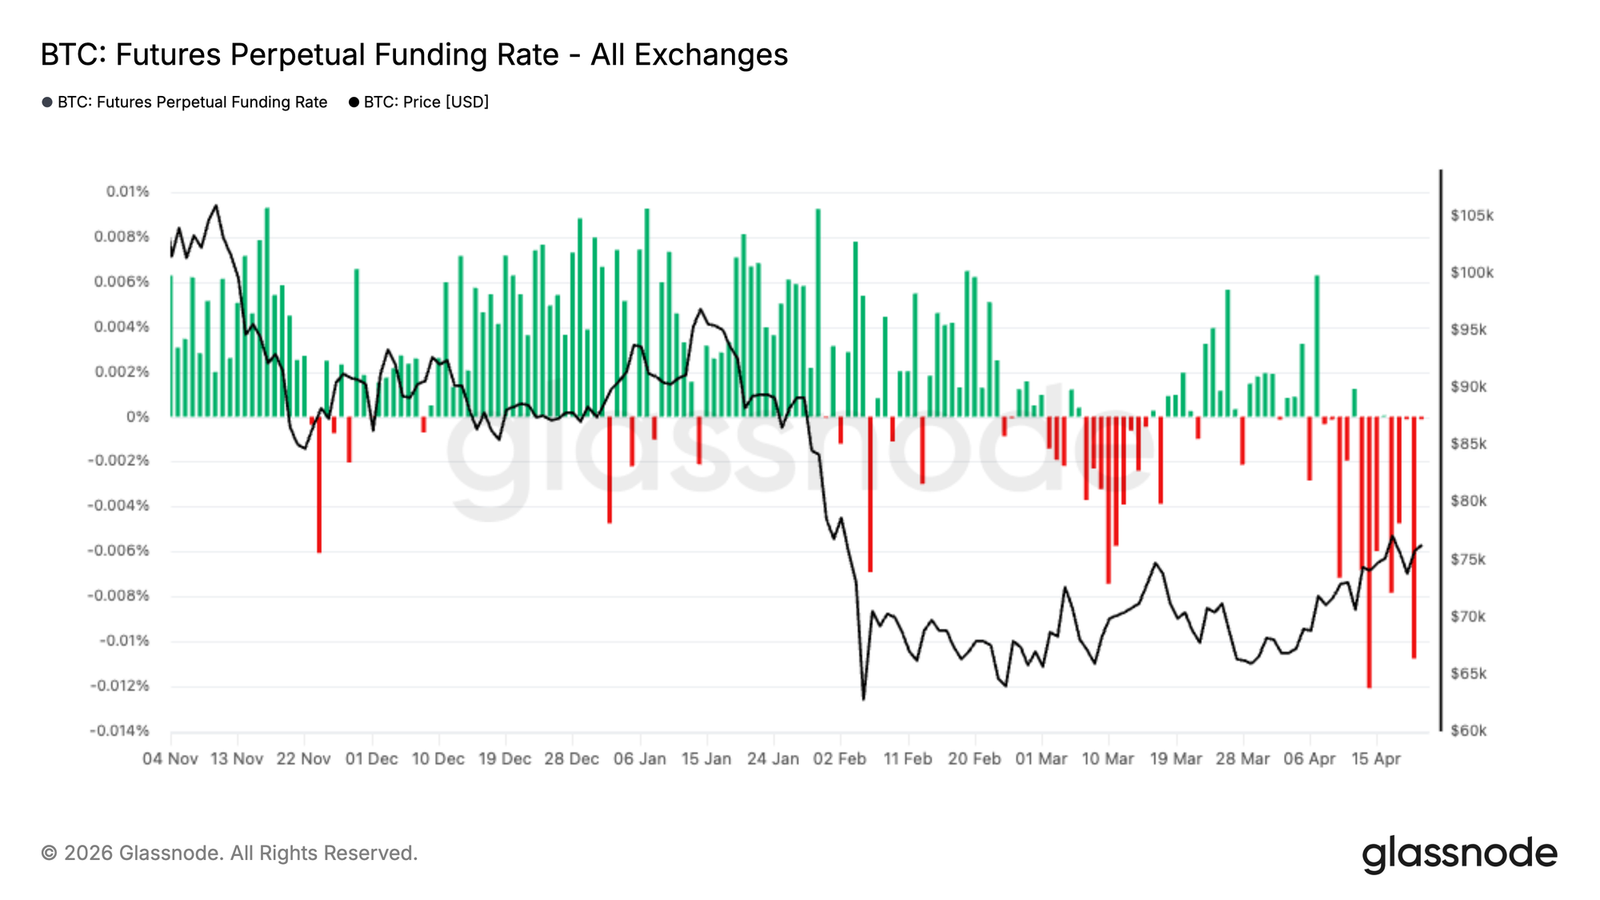
Funding rates for perpetual contracts remain negative, reflecting a market increasingly skewed toward short positions. If spot demand continues to strengthen, this could become fuel for upside movement.
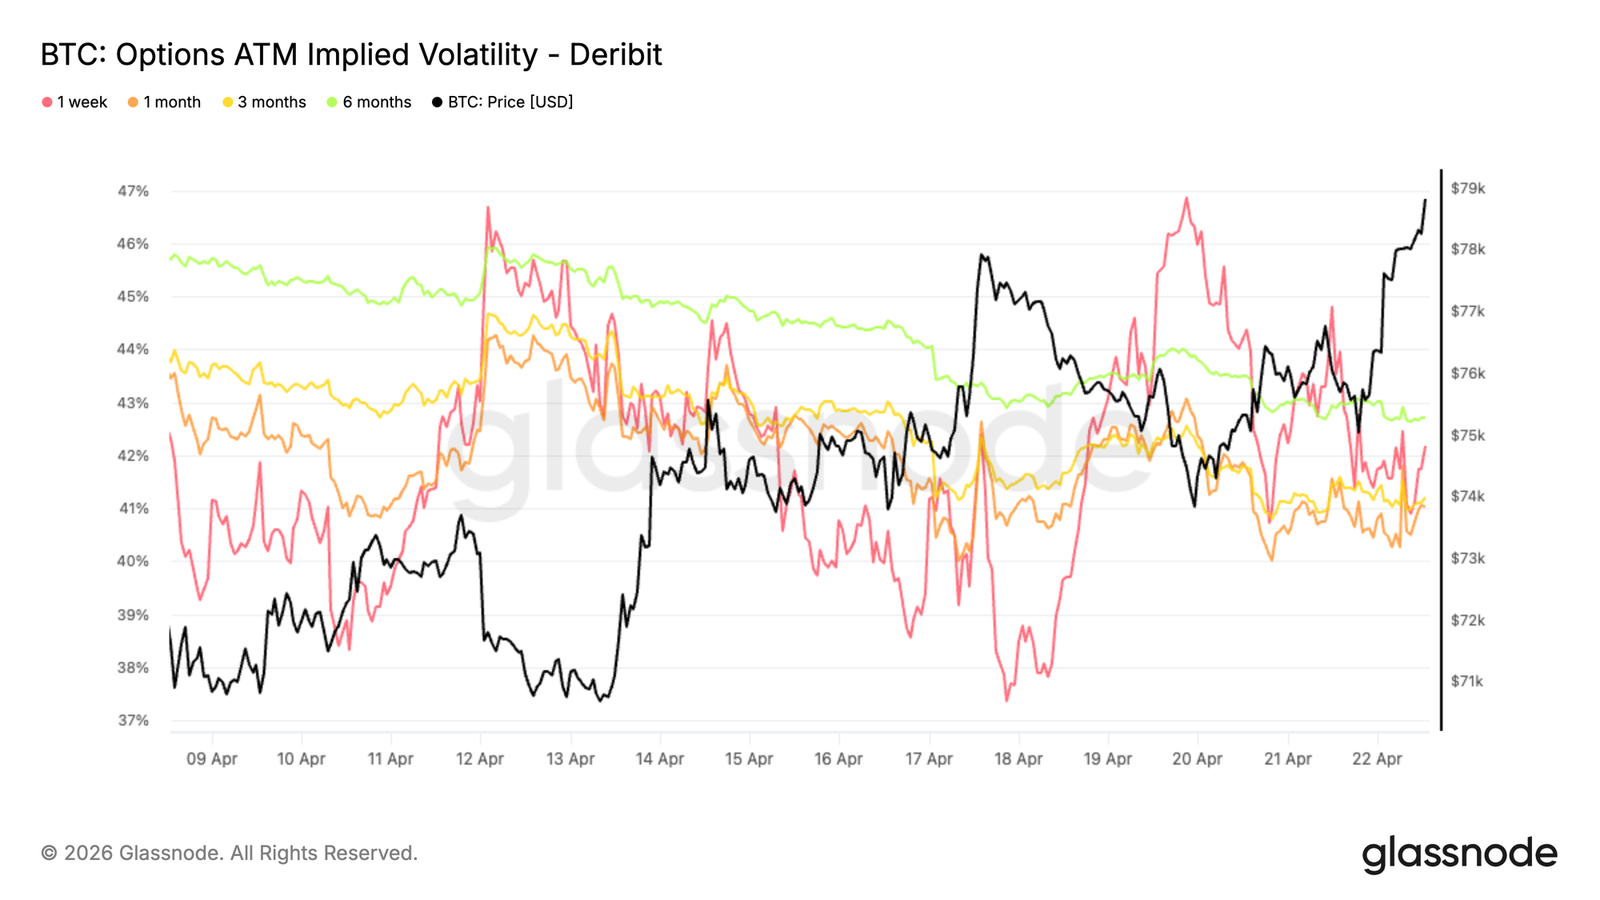
Volatility remains under pressure. Implied volatility continues to decline, with realized volatility also confirming compression, and there is no premium in option pricing.
Skew shows short-term position adjustments, but downward protection remains firmly bought in the further end.
Gamma and funding flows outline the current landscape: Upside faces mechanical resistance near $80,000, while a drop to $75,000 faces higher accelerating risks to the downside.
On-Chain Insights
Breaking Through the Ceiling, but Unclear
Last week, this report identified the True Market Mean of $78,100 as a short-term resistance zone, anticipating that underwater investors' selling pressure would limit any rebound. Bitcoin has since broken this level, and this development holds significant cyclical meaning.
The True Market Mean tracks the cost basis of actively traded supply, and historically recovering this model often indicates a transitional phase from deep bear market conditions to a more constructive market. This breakout represents a significant mean reversion in the current bear market, with the next logical target being the short-term holder cost basis of $80,500.
However, the selling pressure from investors accumulated in the $60,000-$70,000 range is starting to impact momentum, as this group approaches their breakeven point, which incentivizes exit behavior. This dynamic increases the probability of forming a local top in the short term, and while breaking the True Market Mean is constructive, caution remains necessary.
The Next Wall: Short-Term Holder Cost Basis
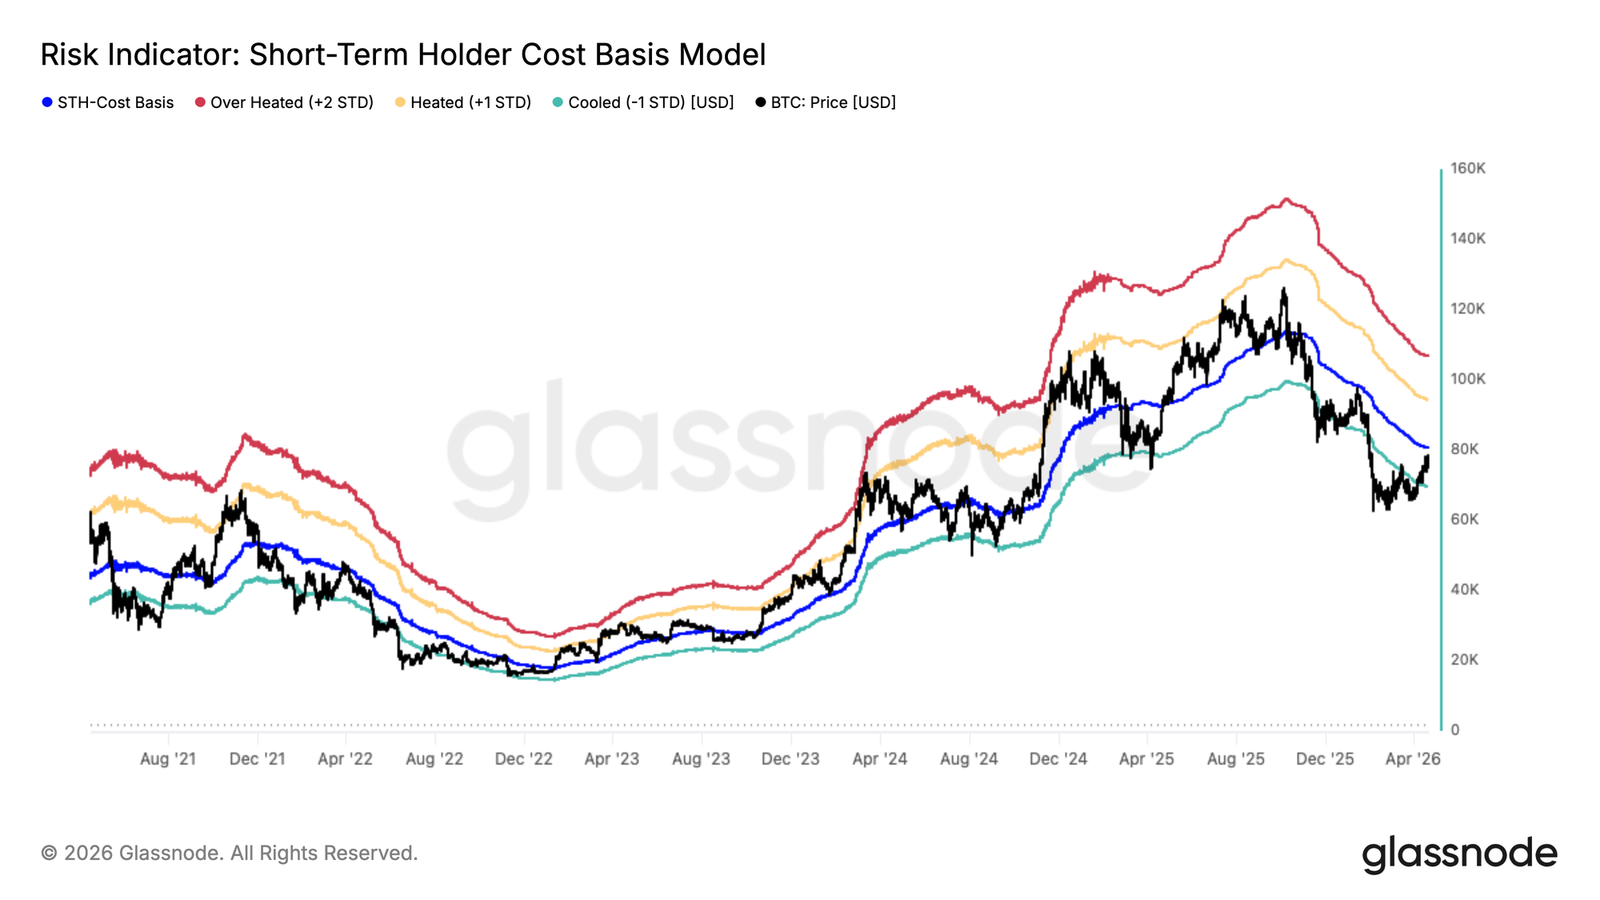
After breaking the True Market Mean, the market now faces a more severe test. The short-term holder cost basis of $80,100 represents the average purchase price for investors who bought over the past 155 days, a group that has historically proven to be the most price-sensitive segment in the market.
As prices approach their breakeven point, the incentive for exit behavior will increase, making this area a natural source of selling pressure. In bear markets, rebounds toward the short-term holder cost basis often require multiple attempts to resolve, with price pulling back to around the -1 standard deviation lower boundary (approximately $69,900) between each attempt. This pattern suggests that the $78,000-$80,100 range constitutes significant short-term resistance, while $70,000 increasingly becomes a developing mid-term support base.
Where Bear Market Rallies Exhaust
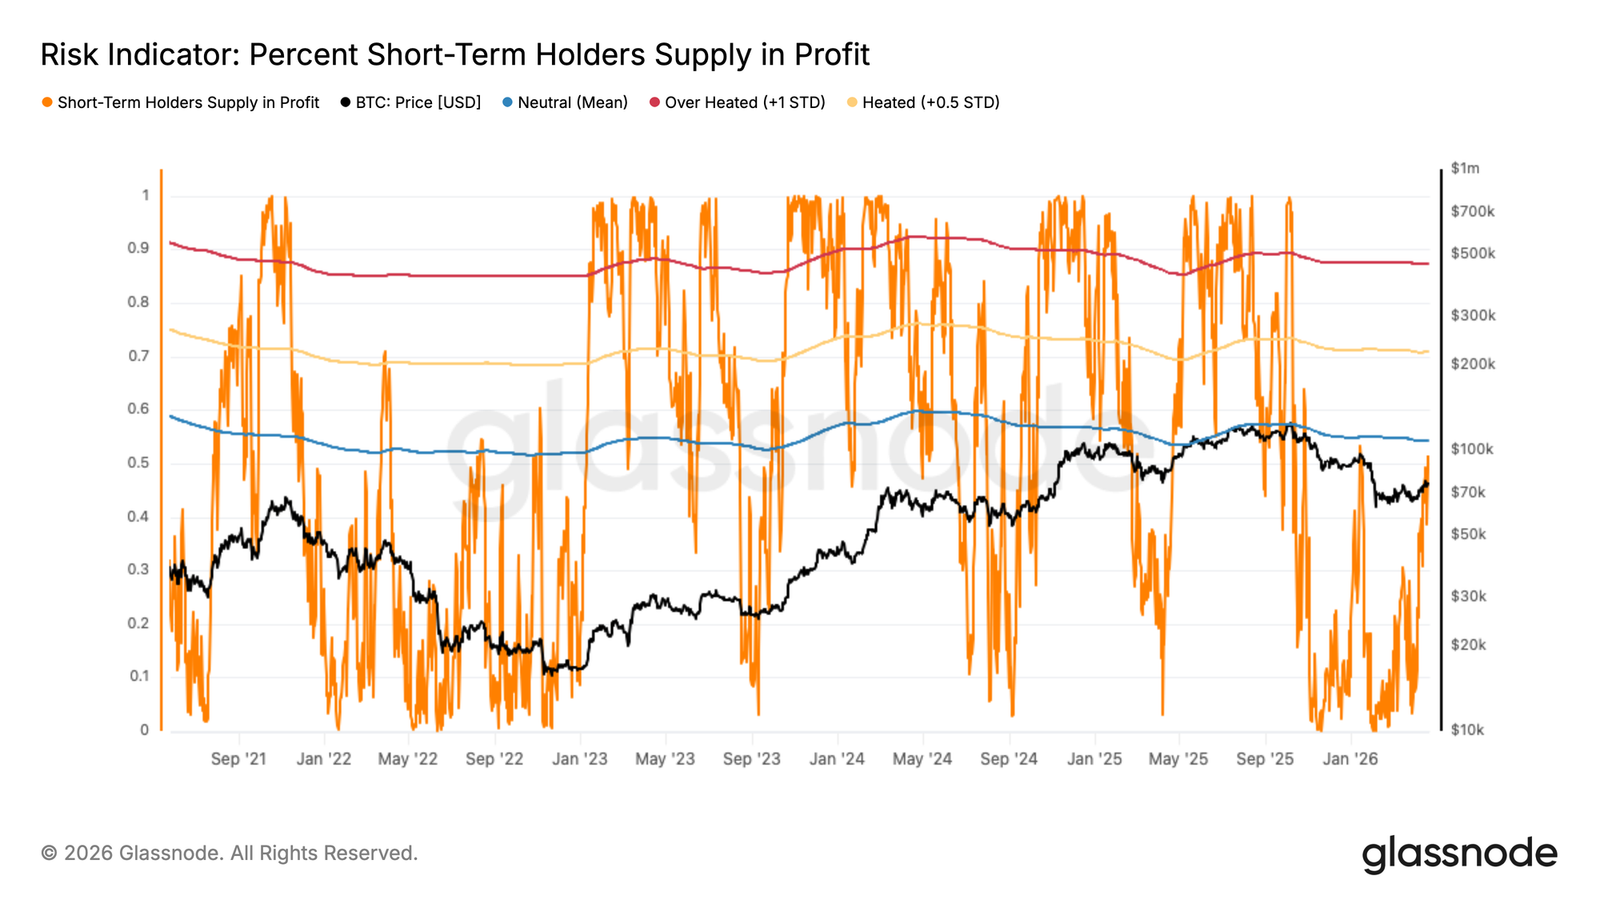
With the short-term holder cost basis of $80,100 becoming the immediate resistance ceiling, the percentage of short-term holder supply in profit offers a complementary perspective, precisely explaining why this level carries such important behavioral significance. This metric measures the proportion of recent buying supply that is currently unrealized in profit; historically, readings above 54% often coincide with peaks of selling pressure in bear market rebounds because the concentration of profitable short-term holders is sufficient to overwhelm demand.
A rebound toward the $80,000 region would simultaneously push this metric over its statistical average of 54%, triggering a profit-taking wave from recent buyers seizing the opportunity to exit near breakeven. Notably, this is not an isolated event within this cycle; this is the second occurrence of such a structure, having appeared previously in the bear market. The repeated touches of this threshold reinforce its reliability as a local top indicator.
Surge in Profit-Taking Confirms Warning
Further reinforcing the aforementioned exhaustion signal, real-time spending behavior among short-term holders is corroborating the structural picture. As prices test the short-term holder cost basis for the second time, more than 50% of recent buyers will be pushed back into the profit zone, with the 24-hour simple moving average of realized profit for short-term holders soaring above $4.4 million.
Placing this reading in context with the year-to-date highlights: Every instance this year where realized profits exceeded $1.5 million per hour has coincided with the formation of local tops, making the current reading nearly three times the historical warning threshold.
In the absence of meaningful demand catalysts to absorb this wave of profit-taking and maintain momentum above $80,000, a decline from the current levels would align completely with the patterns outlined in this report. The combined signals point to caution rather than conviction.
Off-Chain Insights
ETF Fund Flows Turn Positive Again
U.S. spot ETF fund flows have begun to recover, with the 7-day moving average returning to positive territory after a lengthy period of outflows. This marks a significant change in institutional demand, which saw considerable outflows in late January and February.
Recent clusters of inflows indicate traditional investors are reallocating, coinciding with Bitcoin's rebound from around $65,000 to the mid-$70,000 range. While the scale of inflow remains below the peaks seen at the end of 2025, the directional shift is significant, indicating a return of institutional appetite.
Structurally, ETFs remain key marginal buyers in the market. Ongoing positive fund flows will provide a strong demand foundation, helping to absorb selling pressure and strengthen price resilience. However, consistency will be crucial, as past rebounds have struggled to sustain during periods of waning ETF demand.
Spot Demand Returns
Spot CVD has shown a marked shift towards buyer dominance in recent trading days, with significant increases in cumulative volume delta across major exchanges. This indicates that recent price increases are supported by real spot demand rather than purely derivative-driven liquidity.
The dynamics at the exchange level reveal some underlying divergence. Binance's spot CVD has dominated recent buying pressure, while Coinbase's activity has been relatively subdued, indicating stronger participation driven by offshore or retail flows. Nonetheless, the overall CVD trend across all exchanges has turned positive, reinforcing the view that buyers are entering the market with conviction.
Importantly, this revival in spot demand coincides with rising prices, suggesting a more constructive market structure compared to previous rebounds that lacked underlying volume support. If sustained, this shift in spot positioning could provide a more lasting foundation for further upside, particularly against the backdrop of increasing bearish bias in the derivatives market.
Short Positions Build, Funding Rates Remain Negative
Funding rates on perpetual contracts have decisively trended downwards in recent weeks, with major exchanges consistently printing negative territories. This marks a clear shift from the positive regime dominated by long positions in November and December, when traders were willing to pay premiums to maintain exposure.
The current structure reflects an increasing tilt towards short positions, as participants have taken defensive positioning after a significant pullback in early February. Notably, the funding rates remained negative from March to April, indicating that this is not a transient sentiment shift but a more entrenched bearish hedge and speculative short exposure.
From a positioning perspective, this creates a constructive backdrop. Crowded short positions could act as fuel for upside, especially if spot demand reappears or macro conditions stabilize. However, in the absence of strong directional flows, this imbalance may reflect a continued cautious market.
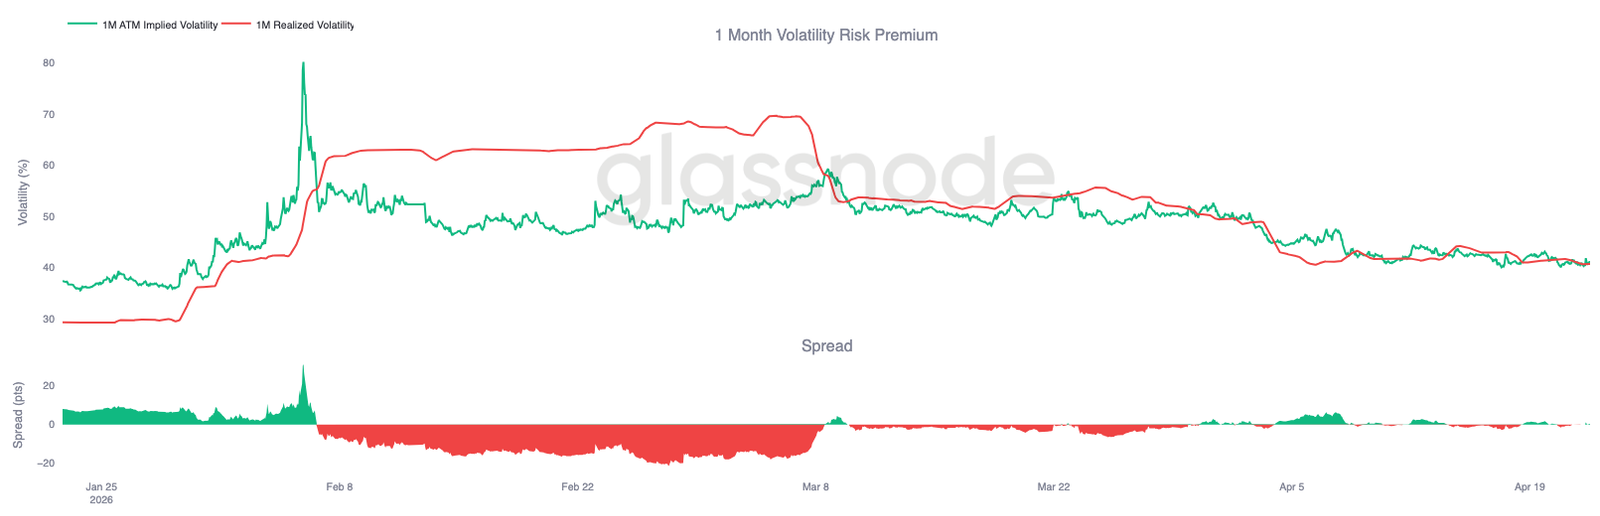
Implied Volatility Continues to Decline
Starting with implied volatility, the dominant trend across all tenors remains downward. 1-month, 3-month, and 6-month tenors have continued to decline over the past two weeks, reflecting a gradual compression of volatility expectations.
The 1-week tenor has reacted more intensely, experiencing sharp spikes to 46%, but these movements have not been sustained, quickly reverting to the broader downward trend. This suggests that the market is unwilling to maintain buying pressure for short-term protection. Instead, volatility has been continuously sold across all tenors.
Even as prices rise, implied volatility has failed to expand, indicating a lack of urgency in hedging and limited willingness to chase upward momentum. The overall structure remains soft, with no clear signs of broader volatility shifts, and sellers continue to exert pressure.
Realized Volatility Confirms Compression
As implied volatility continues to be sold, realized volatility has also moved in the same direction, reinforcing the trend.
Bitcoin's 30-day realized volatility currently stands at 40.7%, down from 49% in early April, as price action remains subdued with limited follow-through. This is important, as realized volatility anchors how options should be priced. When realized volatility remains low, it becomes difficult for implied volatility to maintain any upward movement, as there is no underlying pressure to justify higher premiums.
This is clearly reflected in the volatility risk premium, which is currently close to zero, meaning implied volatility is no longer pricing any meaningful premium over realized volatility. Options are being priced based on what has already occurred rather than what may happen.
The combination of low realized volatility and continuous selling of volatility has kept the overall environment soft, without forcing revaluation pressure for higher volatility.
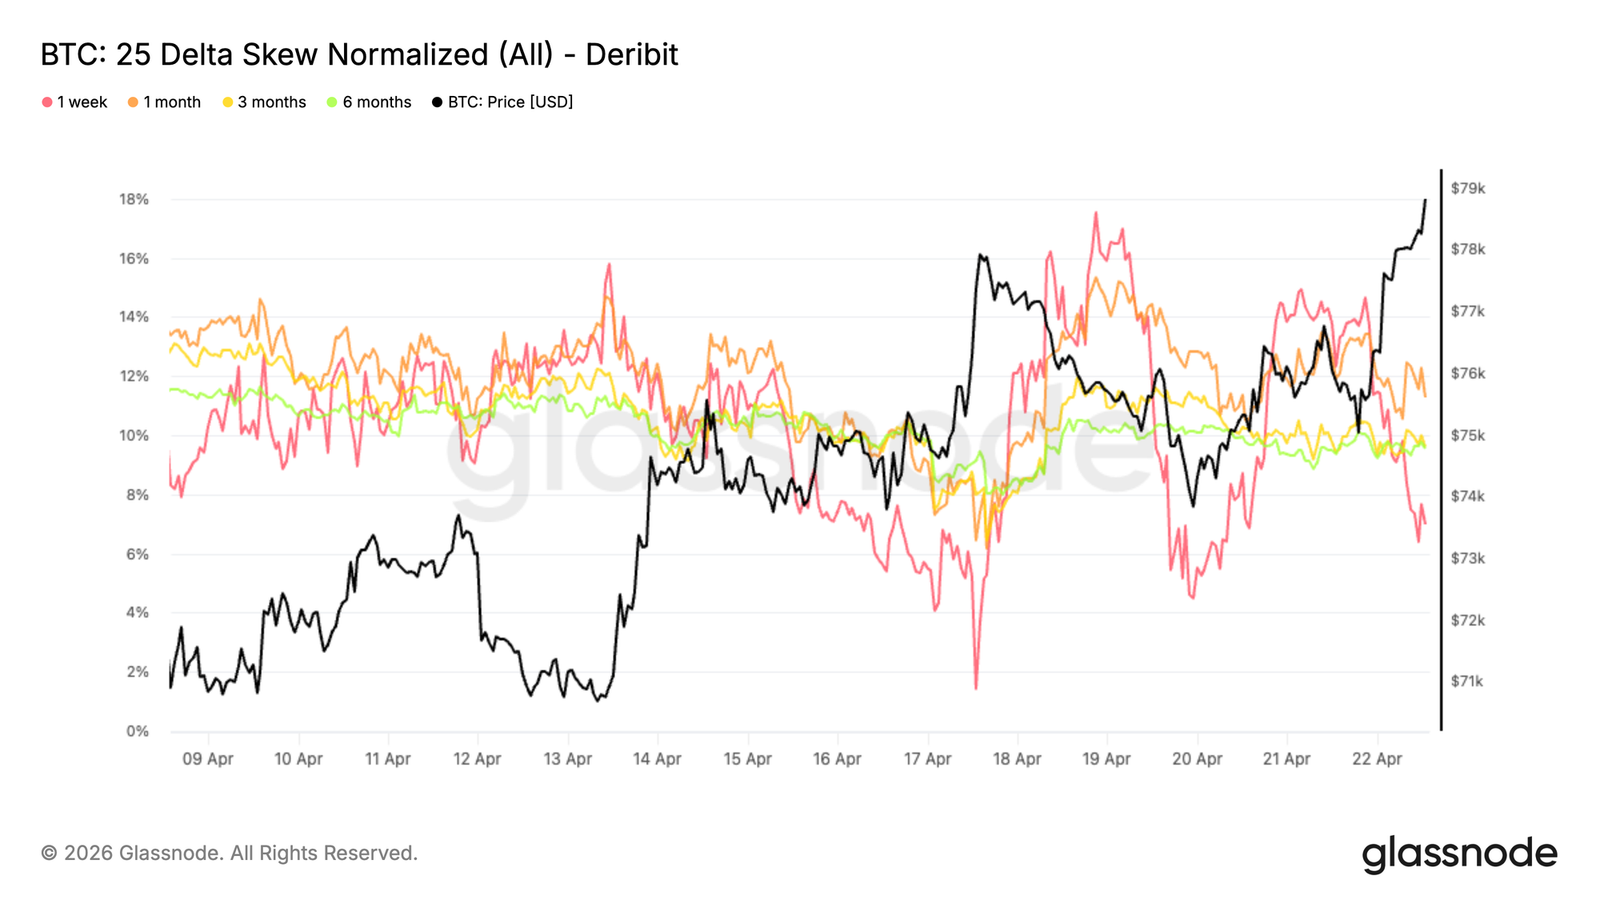
Short-Term Skew Volatility, Broader Structure Maintains
Skew adds more nuance to the picture. The 25 delta skew (the implied volatility of put options minus call options) experienced sharp fluctuations on Friday at the front end, with 1-week put option premiums crashing to 2%, only to rebound above 7% over the weekend.
This rapid back-and-forth highlights the reactiveness of short-term positioning. In contrast, 1-month, 3-month, and 6-month tenors have remained relatively stable over the past two weeks, hovering around 10%-12%, and continue to reflect firm buying interest for downside protection. This divergence indicates that the volatility is driven by short-term positioning, rather than a broader sentiment shift.
The temporary decline points to a brief unbinding of short-term hedges, but the rapid rebound indicates that the demand for protection has not disappeared. The market is undergoing tactical adjustments at the front end while maintaining a cautious stance at the farther end of the curve.
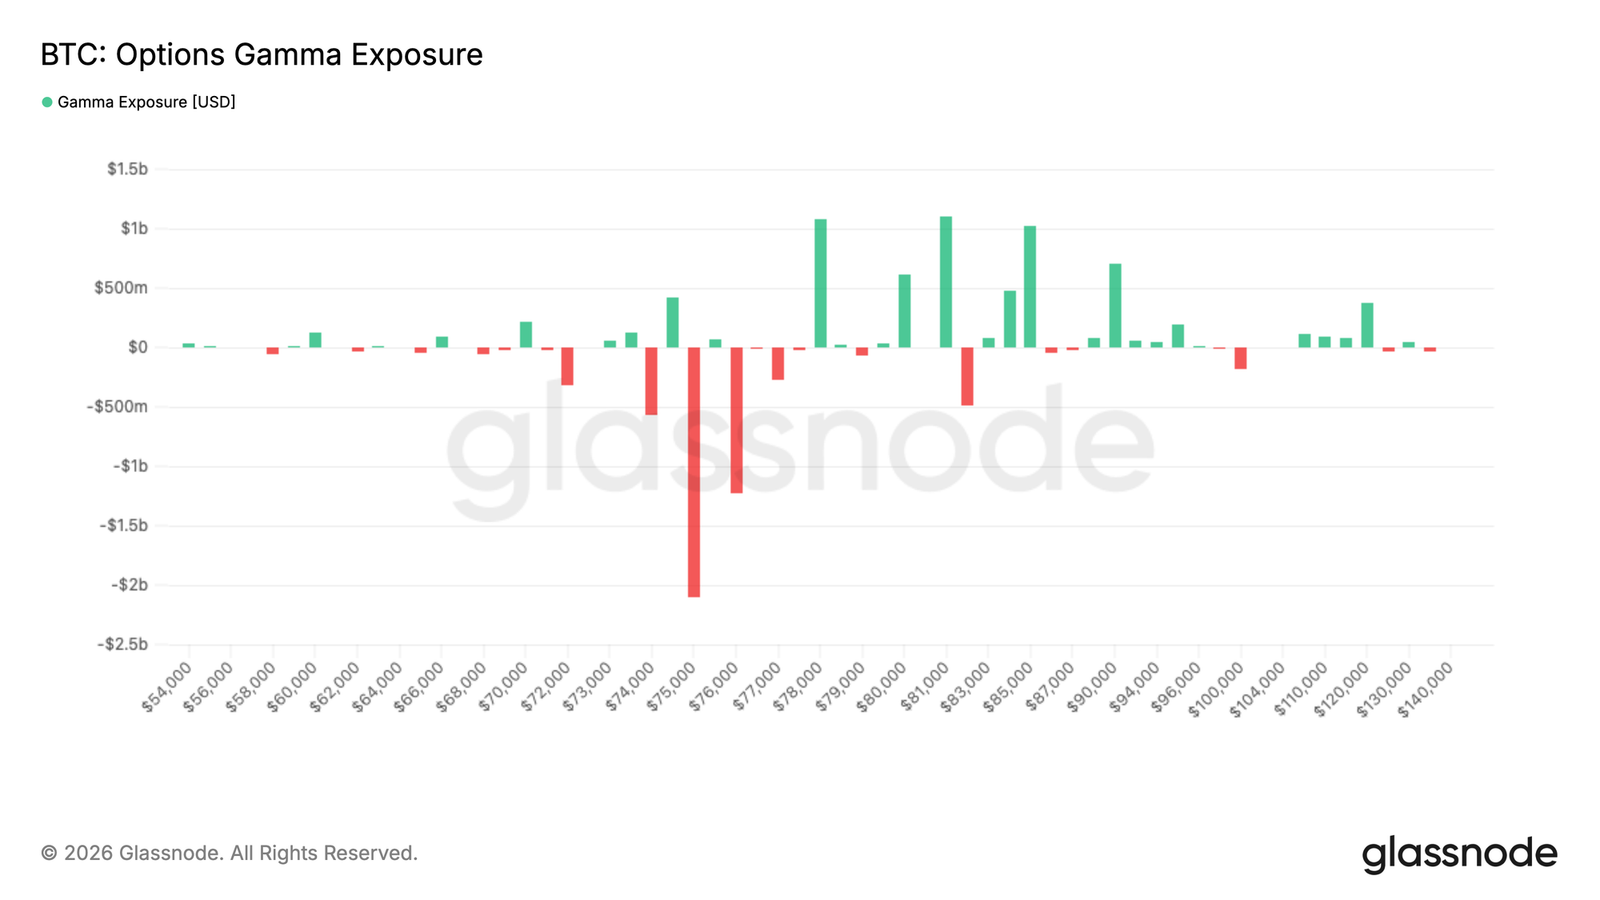
Gamma Positions Outline Short-Term Resistance and Downside Risks
When observing market maker gamma, the positioning picture becomes clearer. A significant concentration of negative gamma exists below the current price, particularly in the $75,000 range, where the exposure reaches extreme levels.
Bitcoin is currently trading around $79,000, with prices above that zone, while immediate upside enters positive gamma territory. Below this range, hedging flows tend to suppress upward movements, creating mechanical resistance as market makers will sell into strength. However, the risk lies below. If prices fall to the midpoint of $75,000, they will enter negative gamma territory, where market makers' hedging could accelerate downward price action.
Recent fund flows add important nuances. Over the past 7 days, call option buying has dominated activity, indicating the market is positioned for upside. However, in the past 24 hours, as spot approaches $80,000, fund flows have shifted towards selling call options, suggesting that upside is being realized rather than chased.
Conclusion
Bitcoin's return to the True Market Mean marks a significant shift in market structure, with prices reclaiming a critical cost basis level that often defines the boundary between bear and constructive markets. This recovery is currently supported by improved spot demand and a preliminary return of ETF fund flows, indicating that retail and institutional participation is beginning to re-engage.
Meanwhile, derivative positions depict a more cautious picture. Ongoing negative funding rates highlight a growing bearish bias, which, if demand continues to strengthen, could become fuel for upside. However, high realized profits and a lack of volatility premium suggest that conviction remains fragile, and traders are still hesitant to actively position for continuation.
Overall, the market appears to be shifting towards a more constructive phase, but confirmation is still needed. Continued breakthroughs beyond the $80,000 level are likely to depend on the sustained absorption of spot and the stability of ETF demand, while failure to maintain current levels could lead to accelerated declines due to the relatively thin liquidity environment.
免责声明:本文章仅代表作者个人观点,不代表本平台的立场和观点。本文章仅供信息分享,不构成对任何人的任何投资建议。用户与作者之间的任何争议,与本平台无关。如网页中刊载的文章或图片涉及侵权,请提供相关的权利证明和身份证明发送邮件到support@aicoin.com,本平台相关工作人员将会进行核查。


