Surfing the Cryptocurrency Waves: April 10 Bitcoin (BTC) Market Analysis Reference:
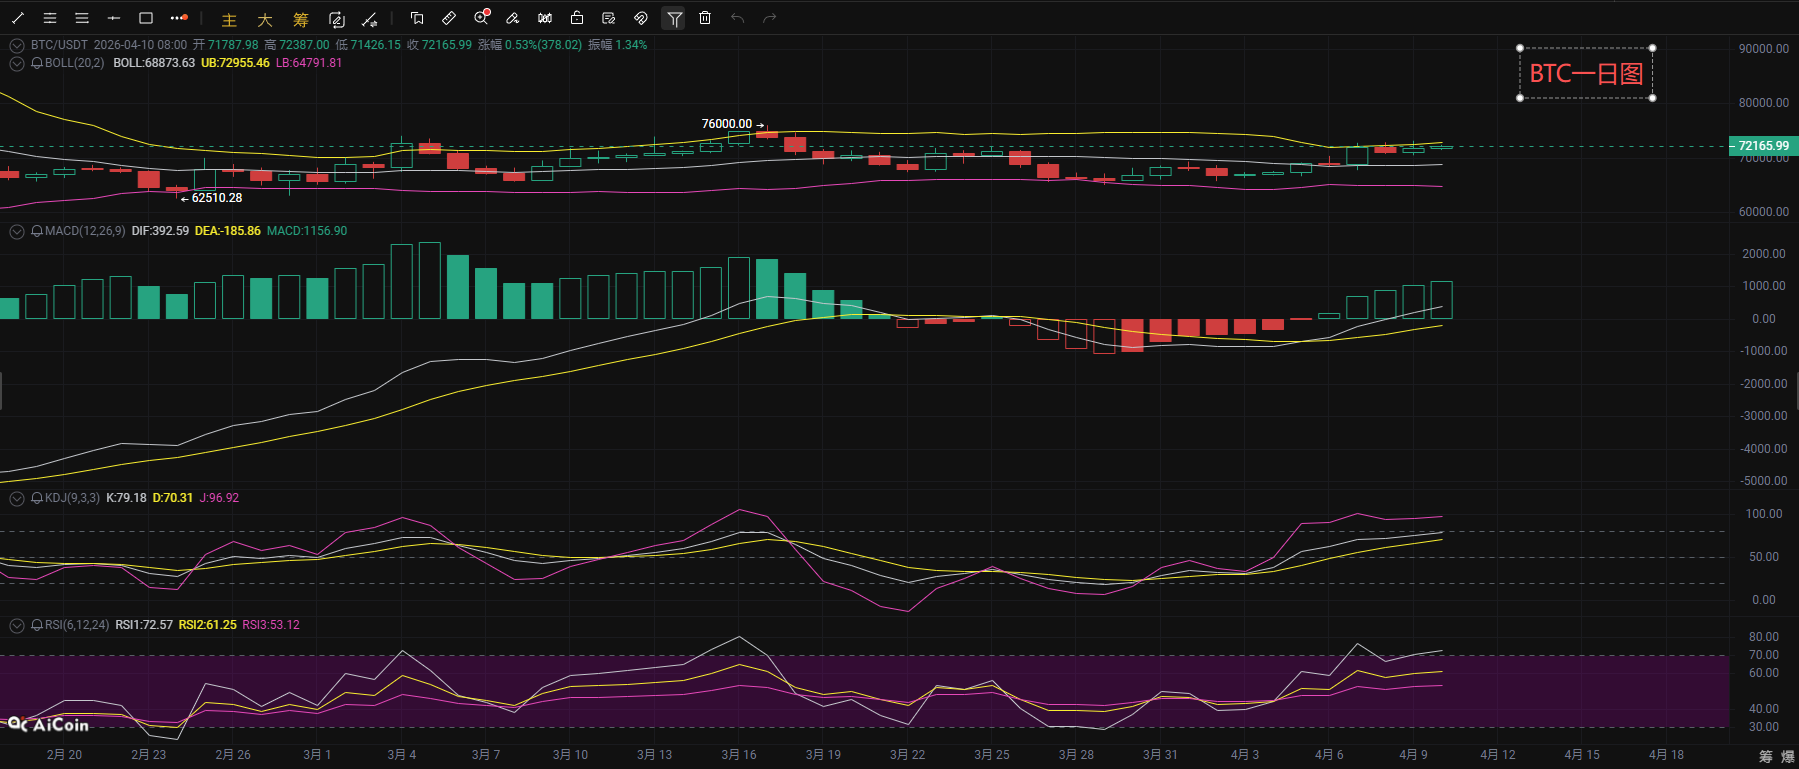
Last night, bulls in Bitcoin made another move upward, testing upper resistance levels. This morning, it rose to around 73100 before facing resistance and retreating, then entering a phase of consolidation at a high level. Observing from the daily chart, the current price is operating between the upper and middle bands of the Bollinger Bands, with the upper band clearly suppressing the price. In the MACD indicator, the DIF and DEA crossed golden after continuously moving upward, and the histogram remains positive while expanding. The RSI indicator is in a moderately strong area above 50, indicating that bullish momentum still dominates, with the overall medium-term trend leaning towards strength; however, the KDJ indicator's J value is already in the overbought range, suggesting a demand for a short-term correction. Overall, the market is likely to first digest the overbought condition with high-level volatility, and once the indicators have repaired and stabilized, the market is expected to launch another attack.
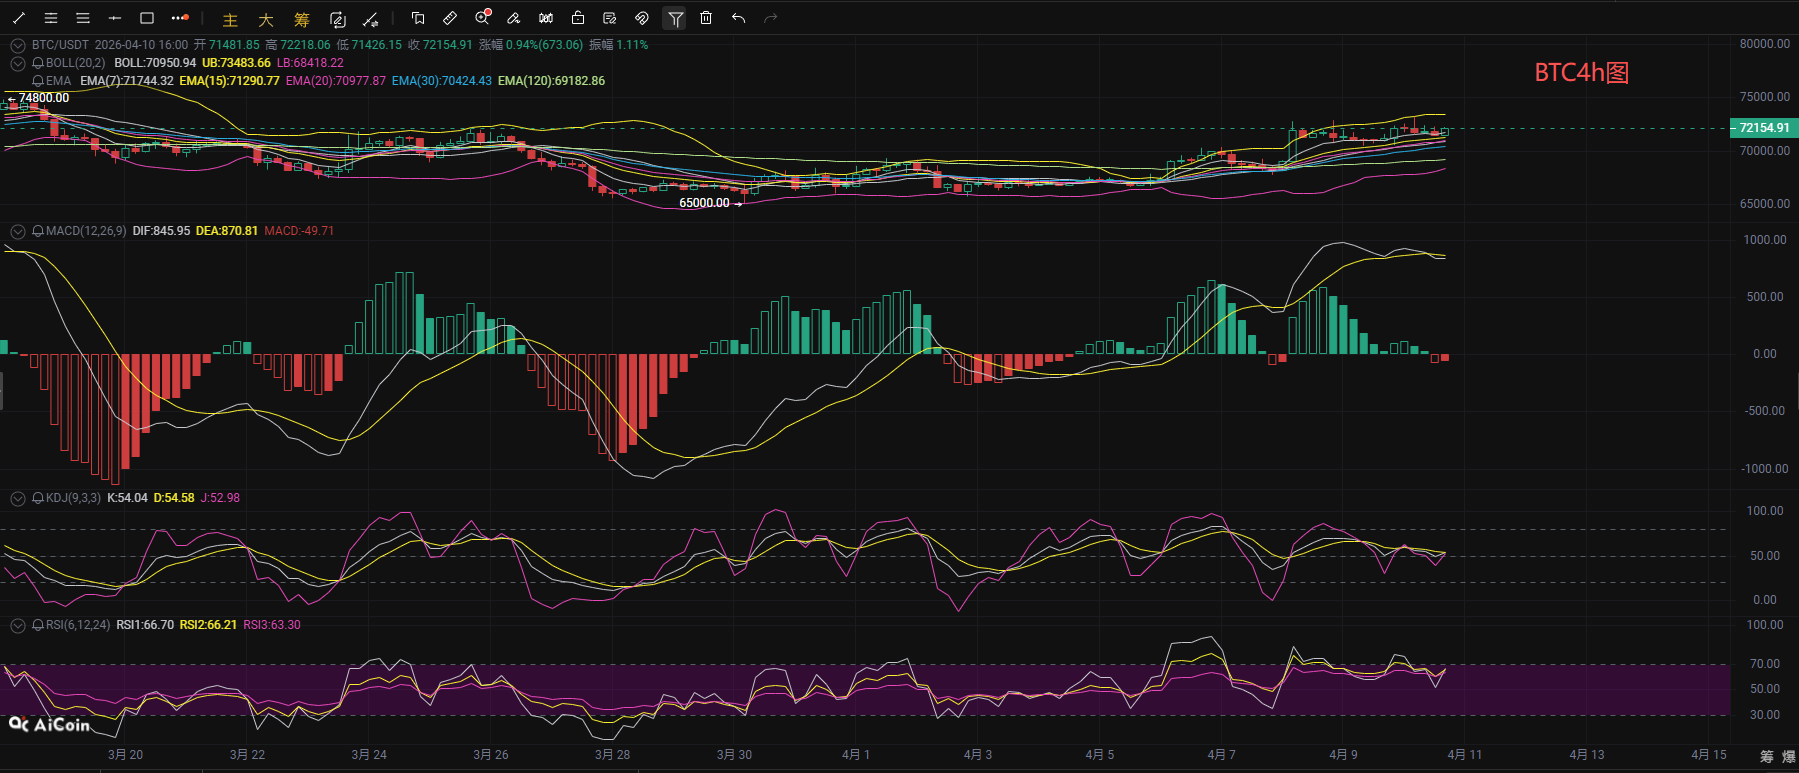
From the short-term hourly chart, the 4-hour Bollinger Bands are opening upward, and the current price is running below the upper band, with the middle band at 70900 providing strong short-term support; the EMA moving averages are arranged in a bullish manner, with short-term moving averages such as EMA7, EMA15, and EMA20 all diverging upward, allowing the price to rise supported by the moving averages, indicating a clear medium-term bullish structure. In the MACD indicator, the fast and slow lines have turned downward above the zero axis to form a death cross, with the MACD histogram continuing to shrink into the negative, indicating a reduction in bullish momentum and insufficient upward driving force in the short term. The KDJ three lines turned down from a high position, with the J value falling to 43, entering a short-term corrective phase; the RSI indicator remains above 60, suggesting that bullish strength still exists but has clearly weakened. Overall, the medium-term bullish trend in Bitcoin on the 4-hour chart has not been completely broken, with the upper Bollinger band acting as strong resistance; however, the short-term signals of the MACD death cross and KDJ turning down are clear, and it is expected that the price will likely maintain volatility in the short term, followed by a corrective move downwards, with the first support near the EMA20 moving average's middle band (70900) and strong support at the 70000 level. If the price stabilizes after a retest, there will still be room for rebound correction; hence, it is not advisable to blindly chase high prices, and entering long positions on dips is more prudent.
Surfing the Cryptocurrency Waves: April 10 Bitcoin Short-term Reference:
Long Position: Buy in the range of 70000-71000, stop loss 500 points, target 71500-72500,
Short Position: Sell in the range of 73500-72500, stop loss 500 points, target 72000-71000,
Surfing the Cryptocurrency Waves: April 10 Ethereum (ETH) Market Analysis Reference:
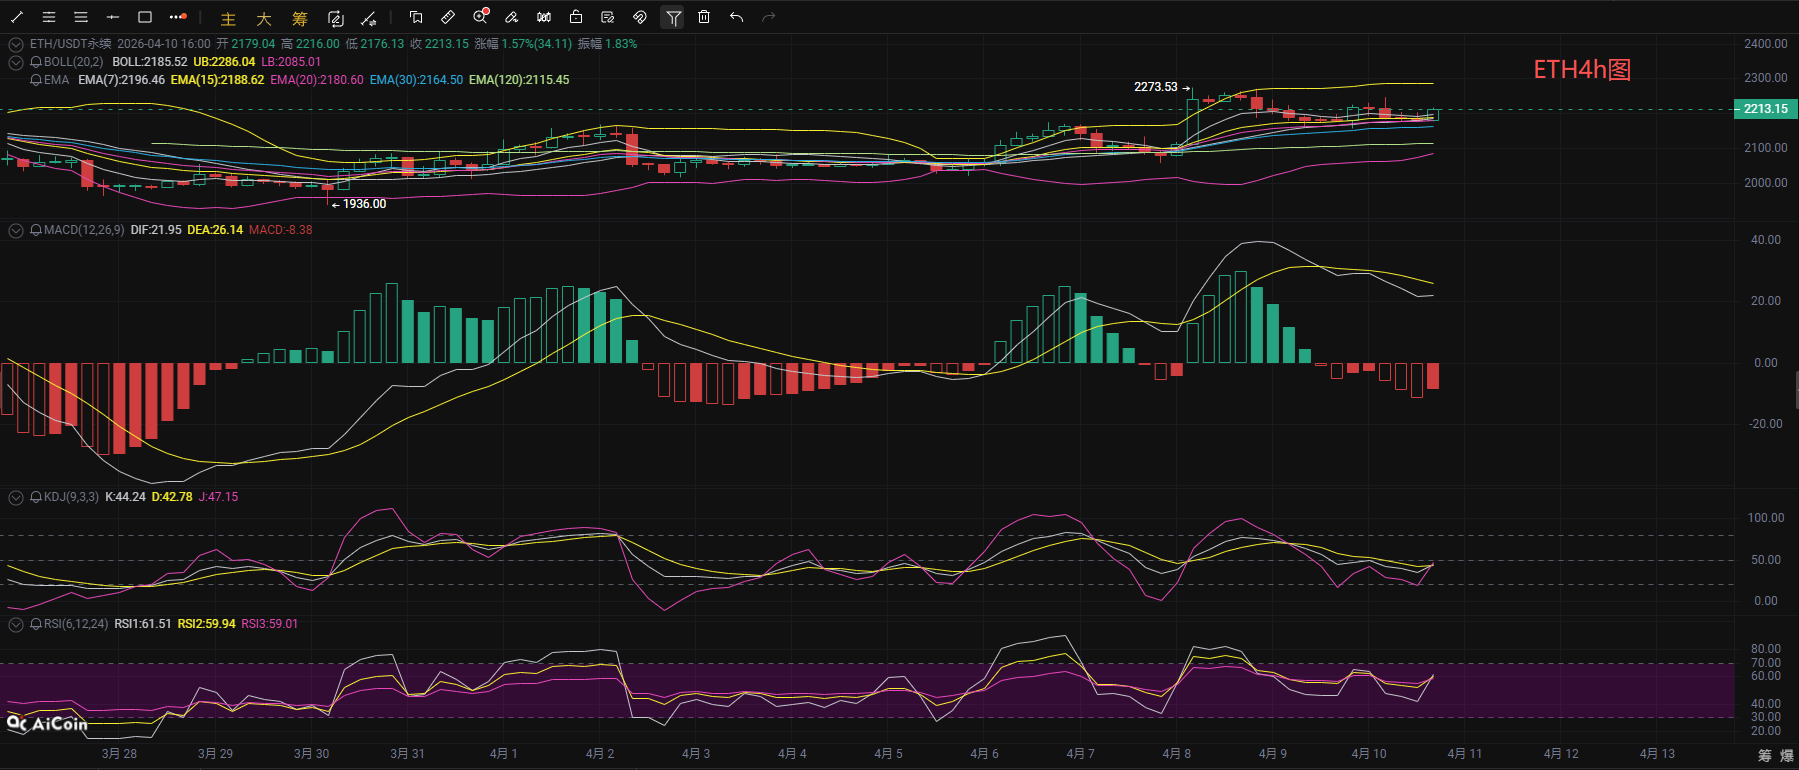
The 4-hour Ethereum Bollinger Bands are showing an upward trend, with the price operating above the middle band; strong resistance still exists near the upper band. The MACD double lines continue downward, and bearish momentum is shrinking. The KDJ three lines are rising from a low position and showing signs of flattening out, while the RSI three lines remain stable in the 50-60 range, indicating that the medium-term adjustment pace has slowed, and the high-level volatility pattern persists. The 1-hour Bollinger Bands are in a flat state, with the price fluctuating narrowly around the middle band. The MACD double lines have formed a golden cross near the zero axis, with the histogram turning positive and slightly increasing in volume, suggesting a short-term recovery of bullish momentum. The KDJ three lines have significantly turned upward, with the J value breaking through 100 into the overbought area, and the RSI rising concurrently, indicating sufficient short-term rebound momentum but a demand for a correction after the overbuying. Overall, the medium-term adjustment pressure on Ethereum has not been eliminated, but the short-term rebound momentum has gradually started, suggesting a strategy of buying low and selling high within the range.
Surfing the Cryptocurrency Waves: April 10 Ethereum Short-term Reference:
Short Position: Sell in the range of 2285-2235, stop loss 30 points, target 2200-2150,
Long Position: Buy in the range of 2145-2195, stop loss 30 points, target 2200-2250,
[The above analysis and strategies are for reference only. Risks are to be borne by yourself. There may be delays in article review and release, making strategies lack timeliness; do not operate blindly.]

This article's content is shared by 【Surfing the Cryptocurrency Waves】, representing personal opinions only. The article may be delayed in delivery and is for reference only; do not operate blindly! Want to receive more daily real-time signals? Then follow my public account. Here, you can learn online market technical skills and gain knowledge about resolving positions and exiting strategies. I have years of research experience in the market, focusing on the overall trends in the cryptocurrency space. I mainly analyze and guide investment operations for BTC, ETH, SOL, BCH, and other coins. Welcome to research and study together.
免责声明:本文章仅代表作者个人观点,不代表本平台的立场和观点。本文章仅供信息分享,不构成对任何人的任何投资建议。用户与作者之间的任何争议,与本平台无关。如网页中刊载的文章或图片涉及侵权,请提供相关的权利证明和身份证明发送邮件到support@aicoin.com,本平台相关工作人员将会进行核查。