Source: TheDeFiReport
Compilation and Organization: BitpushNews
We are currently in the 5.5 months of the latest round of "crypto winter".
The tide has gone out. The animal spirits (speculative frenzy) have dissipated. The tourists have all left.
Naturally, now is the time to roll up our sleeves and get to work. Because a bear market is the moment that distinguishes the wheat from the chaff (quality from mediocrity).
This is the time for clear judgment and formation of beliefs.
In this report, we will conduct a deep analysis of a set of data charts to assess the health of the crypto ecosystem and the trends we believe are shaping the next expansion.
Let's get started.
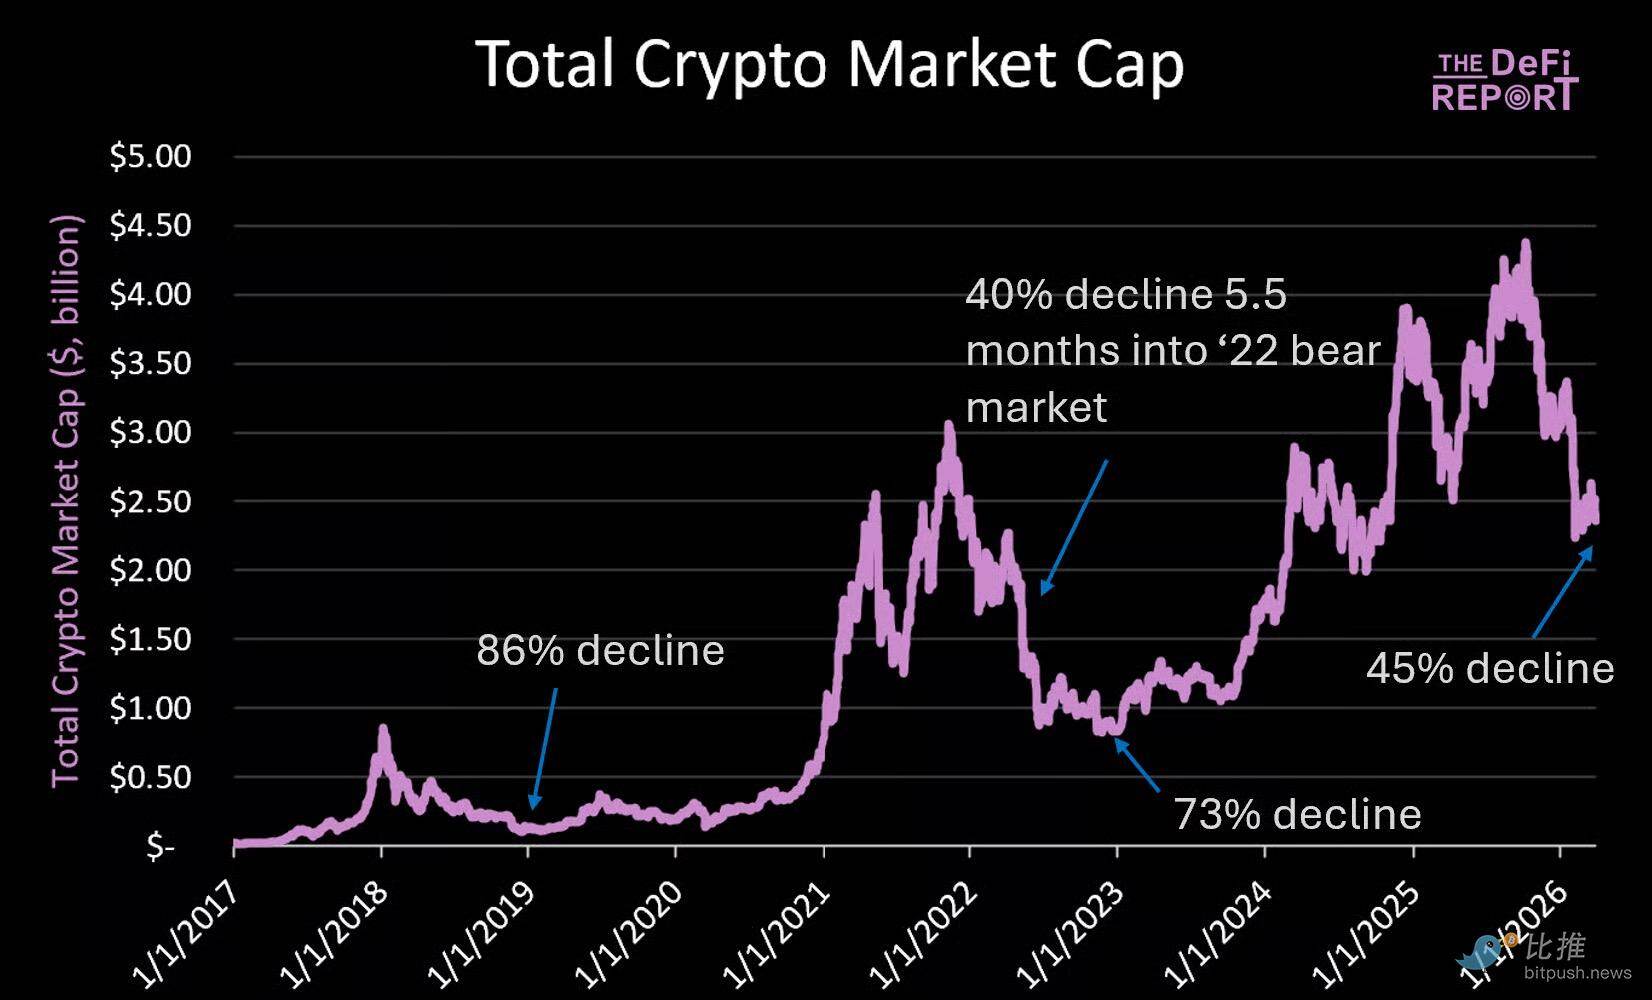
Total Cryptocurrency Market Cap
Current category share breakdown:
- BTC: 57%
- L1s: 25%
- Stablecoins: 14%
- DeFi: 2%
- Others: 2%
Note: Both stablecoin and DeFi categories have generated more revenue than L1—which highlights the persistent monetary premium L1 still receives from market participants.
As shown in the above chart, the current total cryptocurrency market cap is $2.4 trillion—down 45% from its peak ($4.4 trillion), which is roughly in line with what we saw 5.5 months into the last bear market when it had dropped by 40%.
Key Points
- If the decline in total market cap aligns with the relative peak-to-trough decline from 2018 to 2022, we may see the total crypto market cap drop 62% from its peak to $1.67 trillion (an additional 30% drop from current levels).
- During the 2022 bear market, the decline accelerated after stablecoin supply peaked and dropped 5 months later. We are currently in a similar phase of the cycle, as the stablecoin supply peaked on March 16, exactly around 5 months into the bear market, which will be discussed in detail regarding stablecoins.
- Lastly, BTC's dominance typically declines during bear markets (it was 38% at the end of 2022). Currently, this ratio is 57%. We expect the decline in this round of the bear market to be more gradual.
Why?
In this cycle, there are fewer novel and exciting use cases because venture capitalists (VCs) have clearly realized that blockchain is best suited for finance and payments. This has reduced the amount of funds that could flow into non-BTC crypto assets.
For this reason, when the market peaked in October, BTC's dominance was at 60%. In contrast, at the 2021 market peak, BTC's market share was only 43%.
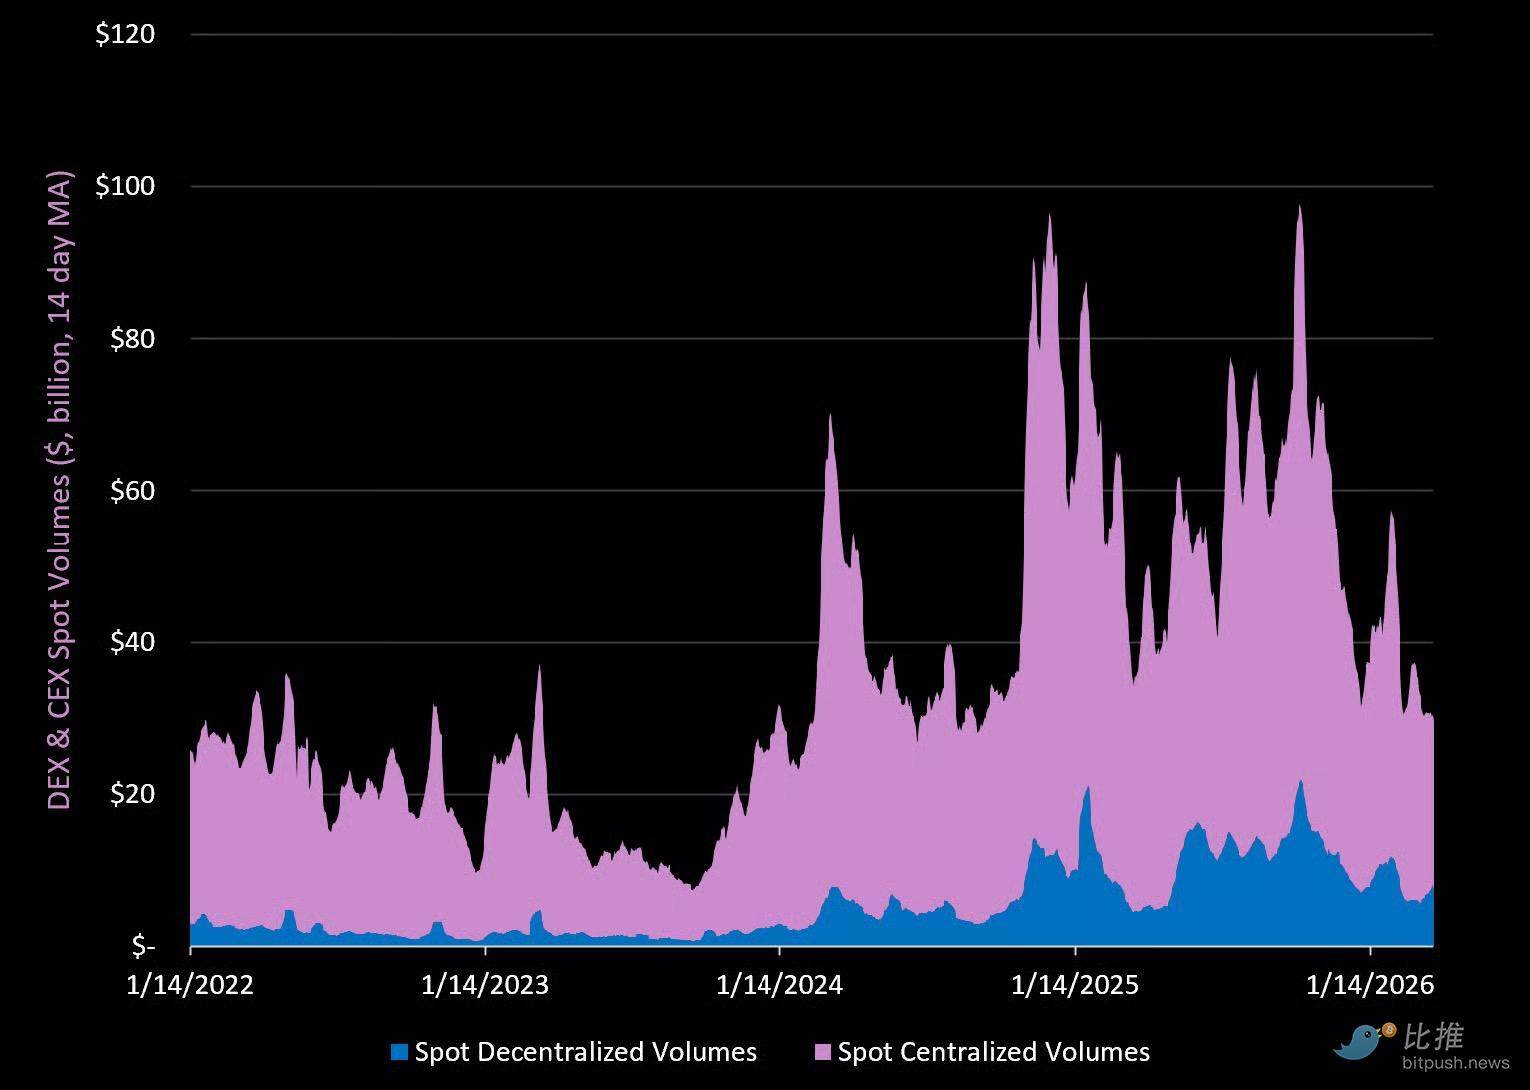
Spot Markets, Data Source: The DeFi Report (Top 10 CEX and DEX)
Key Points
- Total spot trading volume (DEX + CEX) has currently decreased by 70% from the peak at the beginning of Q4 last year. CEX volume decreased by 71%, and DEX volume decreased by 67%.
- CEX spot trading volume has currently increased 1.5 times from the low at the beginning of 2023. DEX trading volume has currently increased 9.1 times from its low at the beginning of 2023.
- DEX trading volume currently accounts for about 25% of CEX trading volume—up from around 5% in 2022. Uniswap leads with a 38% market share, followed by Meteora (Solana) at 22%. Pancakeswap (BNB Chain) ranks third with a 15% share. The most interesting development in the DEX space over the past year has been the rise of private DEXs on Solana, which currently account for 53% of Solana DEX trading volume. HumidiFi is the leading private DEX, currently holding a 3% share across all DEXs.
- Binance still dominates the CEX spot market with a 39% market share. MEXC (11%), Gate.io (8%), Bybit (8%), OKX (7%), and Coinbase (7%) are in a tier below Binance.
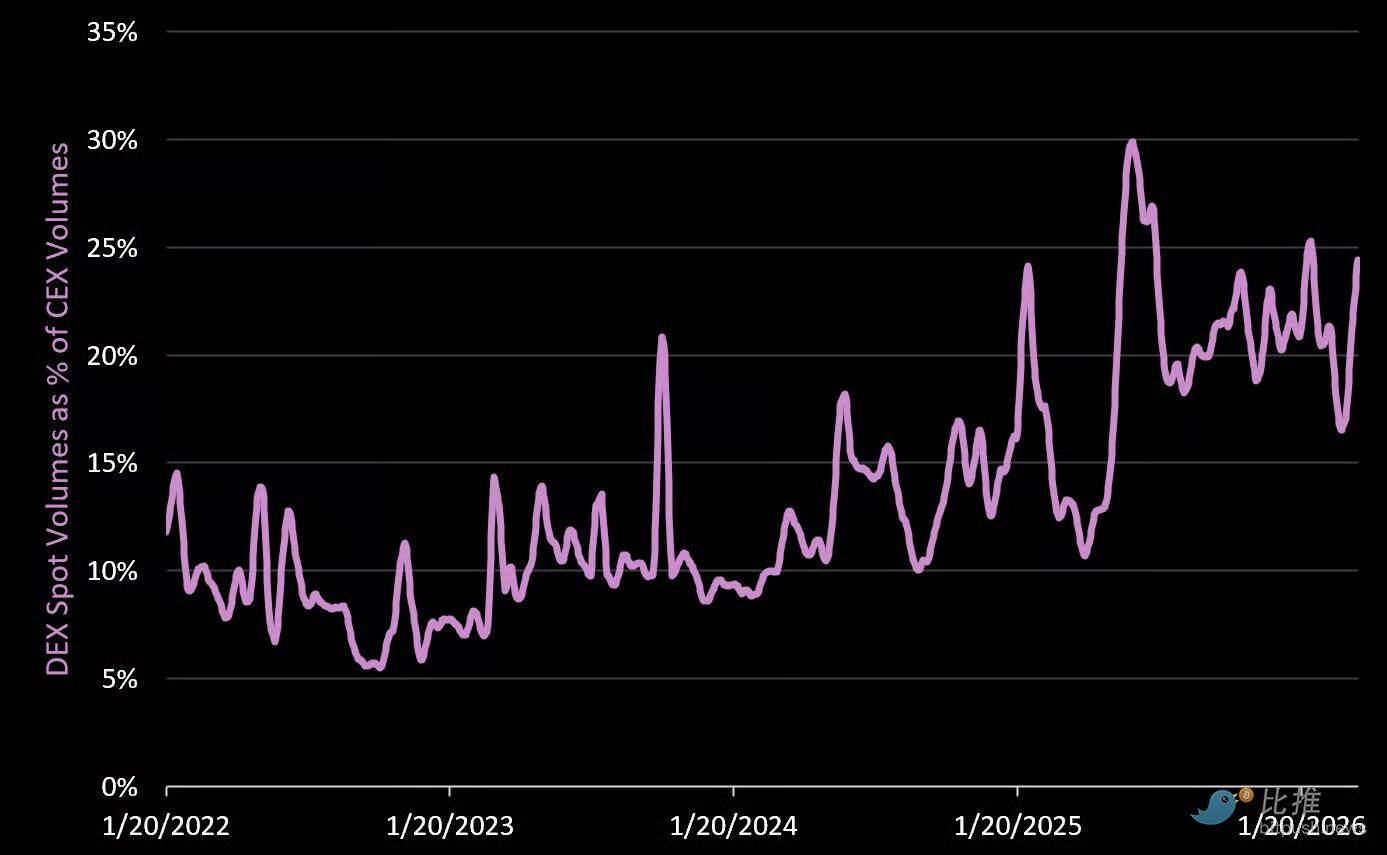
Percentage of Spot DEX Volume Relative to Spot CEX Volume
DEX continues to capture market share from CEX in the current bear market. This is also an indicator that the currently active users are "crypto native"—a phenomenon we expect to see at this stage of the cycle.
More interestingly, DeFi protocols as a category are generating more revenue than Layer 1 blockchains but currently only account for 2% of the total crypto market cap (L1 accounts for about 80%).
Currently, several DEXs listed on The Watch List are trading within our "fair value" and "deep value" ranges.
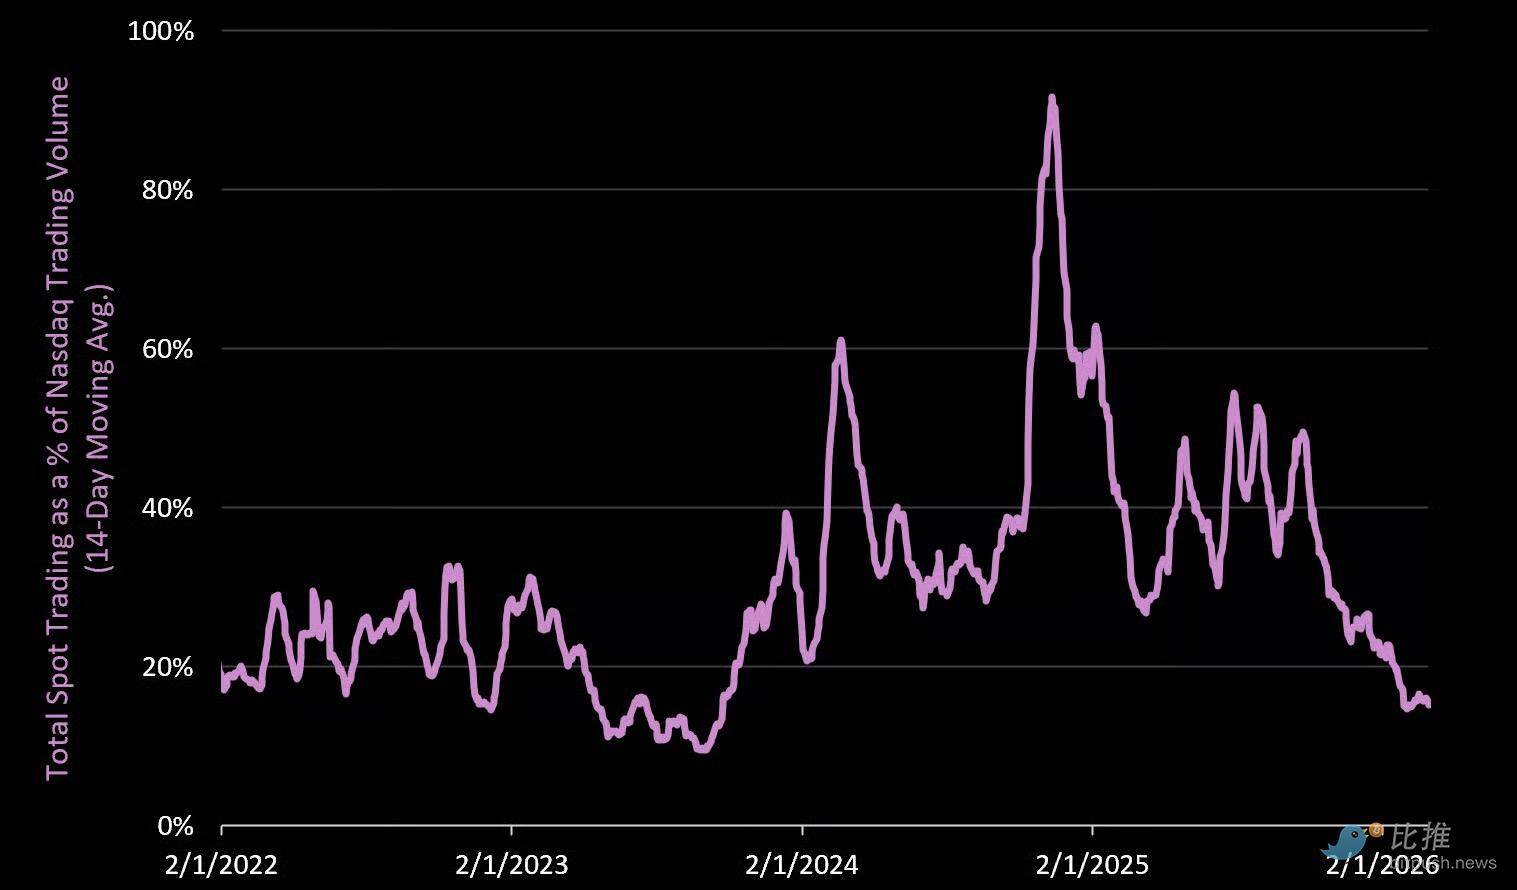
Percentage of CEX + DEX Volume Relative to Nasdaq
One of the lesser-reported events in the last cycle was that during the "meme coin frenzy" in January last year, cryptocurrency trading volume at one point put pressure on Nasdaq—when cryptocurrency volume increased nearly three times to $90 billion per day (representing 90% of Nasdaq's volume at that time).
Today, the trading volume generated by the crypto market is about 20% of Nasdaq's.
Perpetual Futures Market
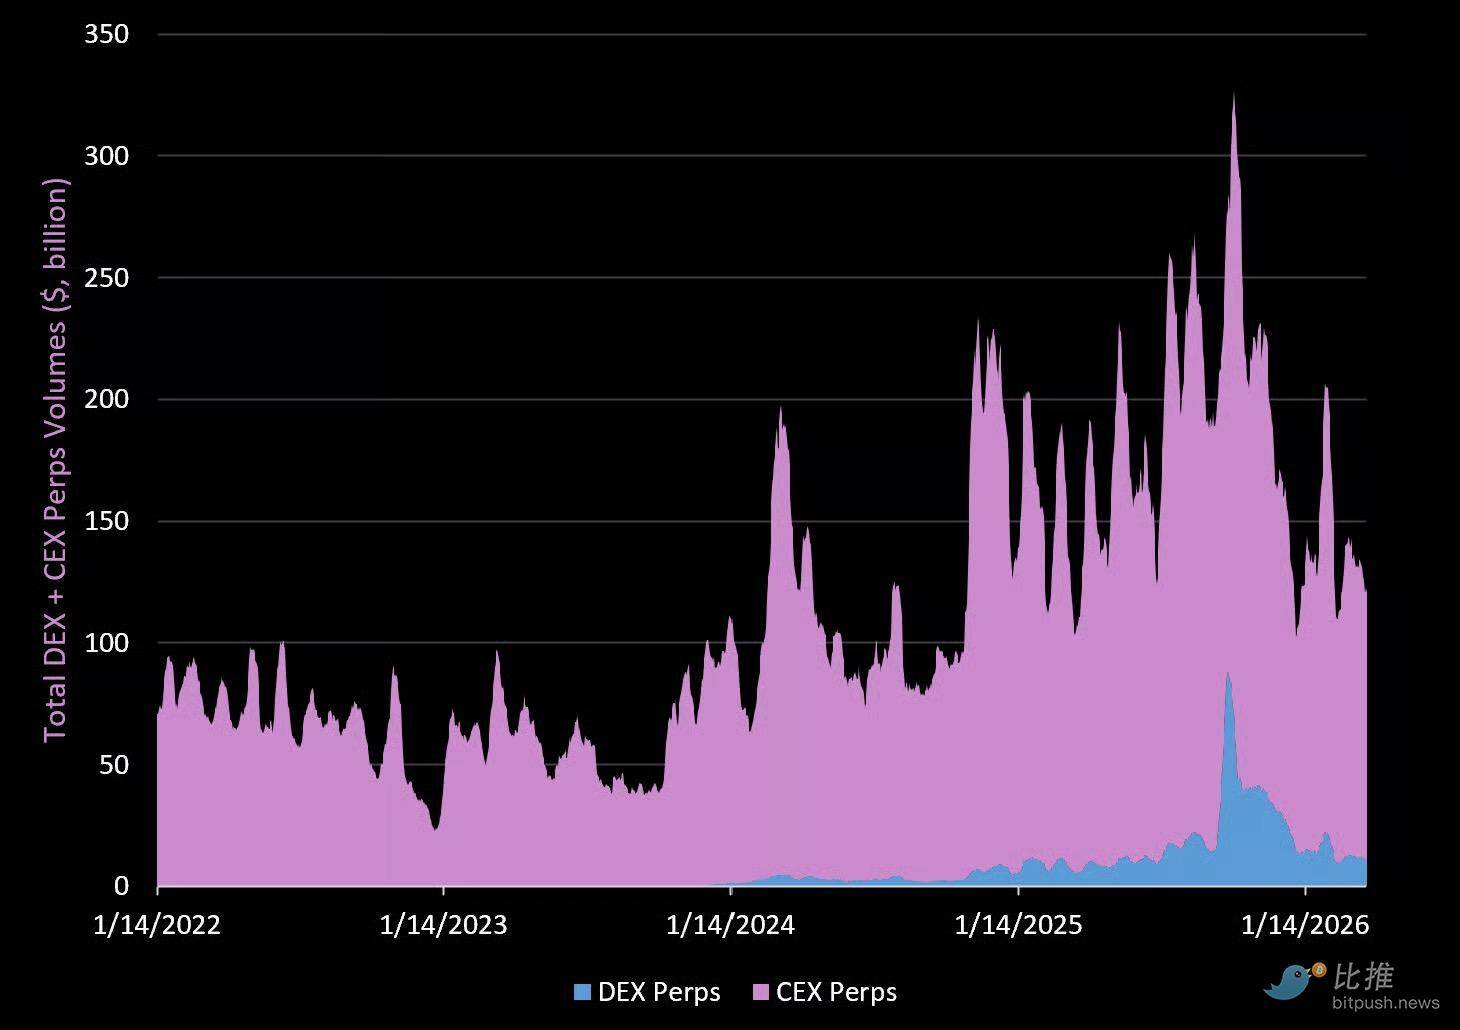
Volume
Key Points
- Total volume for perpetual contracts (Perps) has currently decreased by 63% from the peak set in Q4 last year. CEX perpetual contract volume decreased by 57%, and DEX perpetual contract volume decreased by 84%.
- Perpetual contract volume is currently four times the daily spot volume, highlighting its attractiveness to retail traders.
- DEX perpetual contract volume currently accounts for 9.3% of CEX perpetual contract volume, up from 4% at the beginning of 2023.
- Hyperliquid currently accounts for about 60% of DEX trading volume and 4.6% of total (DEX + CEX) perpetual contract volume.
- In terms of CEX perpetual contract volume, Binance is the king this year with a 43% share. OKX holds 20%, followed by Bybit and Gate (13%) and Coinbase International (5%).
Stablecoins
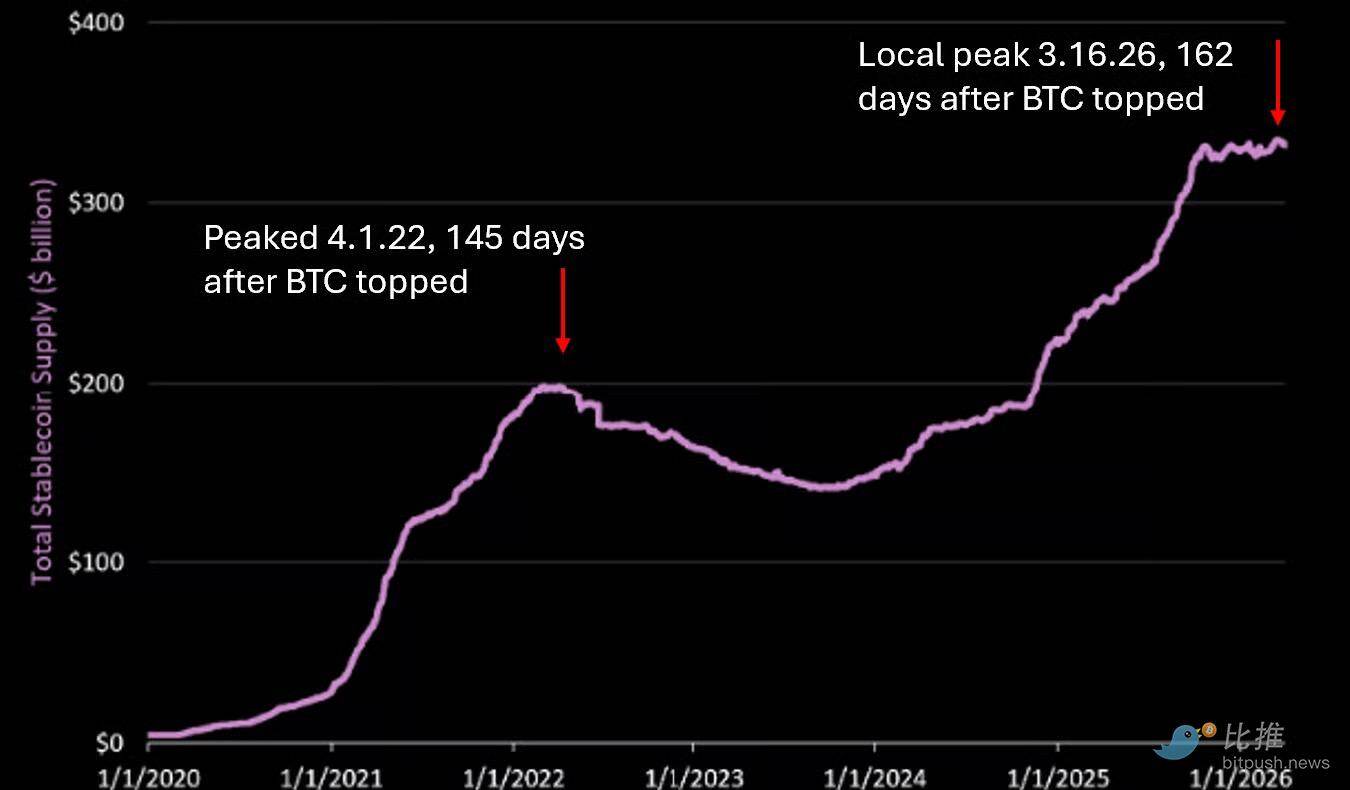
Everyone is optimistic about stablecoins, and so are we. Over the past 2.5 years, the supply has grown by $192 billion (now $333 billion). But we also believe that this chart may temporarily peak.
Why?
- During the 2021 cycle, stablecoin supply peaked on April 1, 2022 (nearly 5 months after BTC peaked and remained flat for over 3 months. USDC didn't peak until July 2022).
- In the current cycle, we peaked locally on March 16, 2026 (again, 5 months after BTC peaked).
- We have stagnated for 5 months for the following reasons:
- Funds flowing into cryptocurrency have stagnated (the market is in a "risk-off" state).
- Leverage is being unwound (real-world payments still account for a very small part of stablecoin transactions).
- Reflexive returns in DeFi have decreased (given on-chain risks, there is no incentive to hold stablecoins).
So far, we have only seen a slowdown in growth (supply has been flat for 5 months).
In our view, the next stage is fiat redemptions.
After peaking in April 2022, it took 2.5 years for stablecoin supply to reclaim that level. No one expects this cycle to see a repeat of that (due to regulatory reasons). However, regulation will not create demand for stablecoins in a "risk-off" environment.
Key Points
- Relying solely on regulation will not create new use cases, applications, banked stablecoins, and new payroll solutions. These will appear later.
- Additionally, the GENIUS Act prohibits stablecoin issuers from sharing profits with holders. This may benefit Circle and Tether's business models, but it does not help end-users in cryptocurrency.
- Based on this, we believe that regulation (within the existing framework) will benefit offshore "yield-bearing stablecoins" like Ethena's USDe in the next round of market expansion.
- Finally, Tether recently hired KPMG, one of the Big Four multinational accounting firms, as its auditor. The company hinted at plans for an IPO, which seems to align with these plans. We also expect Tether to launch a stablecoin compliant with U.S. standards and seek to develop services around it.
- It remains unclear what these services will be. But our view is that the winners of the stablecoin race will win by wrapping "sticky services" around stablecoins. This could include payroll management, payments, remittances, and e-commerce, as well as loans and banking.
New Trading Tokens and Trading App Revenue
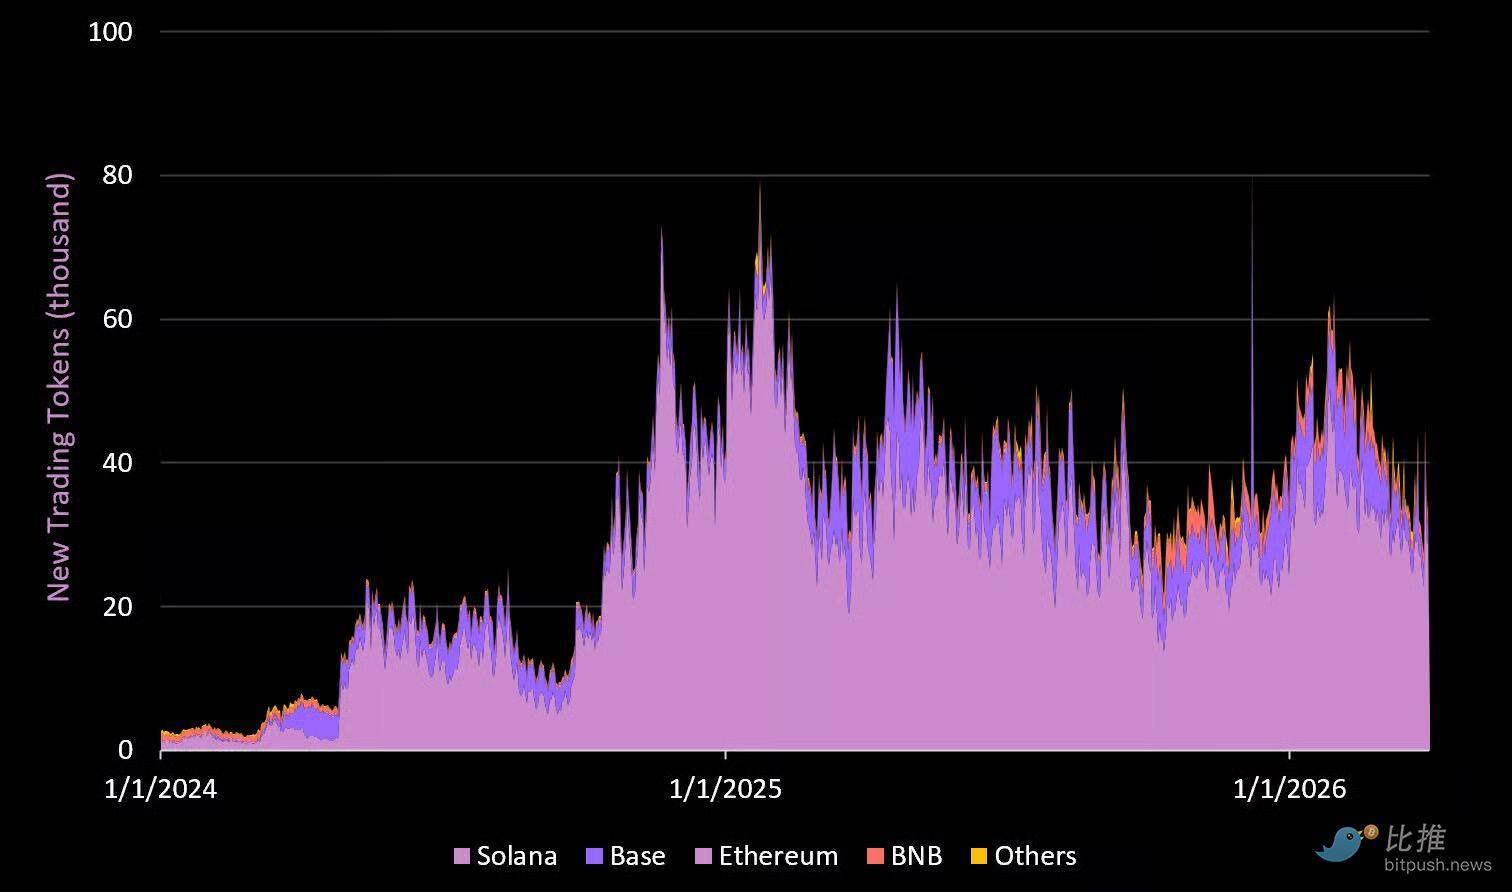
New Trading Tokens by Chain
Key Points
- In each crypto cycle, a new "use case" emerges to help new users enter the crypto space. In past cycles, it was the rise of launchpads on Solana followed by meme coin trading.
- Many people have a strong speculative demand for meme coins. We believe that is a mistake. Our approach is simply to observe the market. We believe there is product/market fit (PMF) here because the market demands the "gamified" experiences provided by top applications.
- The number of new trading tokens has currently decreased by 53% from the peak at the beginning of 2025.
- Solana (through Pump Fun) currently holds an 83% market share, followed by Base at 10%.
- Pump Fun (one of the most profitable applications in the last cycle) has shown relatively stable revenue performance in the bear market. Currently, the app generates approximately $1.2 million daily from Launchpad, DEX, and Padre (trading application). At its peak in the last cycle, its daily revenue was approximately $2.9 billion.
- We believe meme coins and trading applications will not disappear. More information on the latter can be found below.
Trading App Revenue
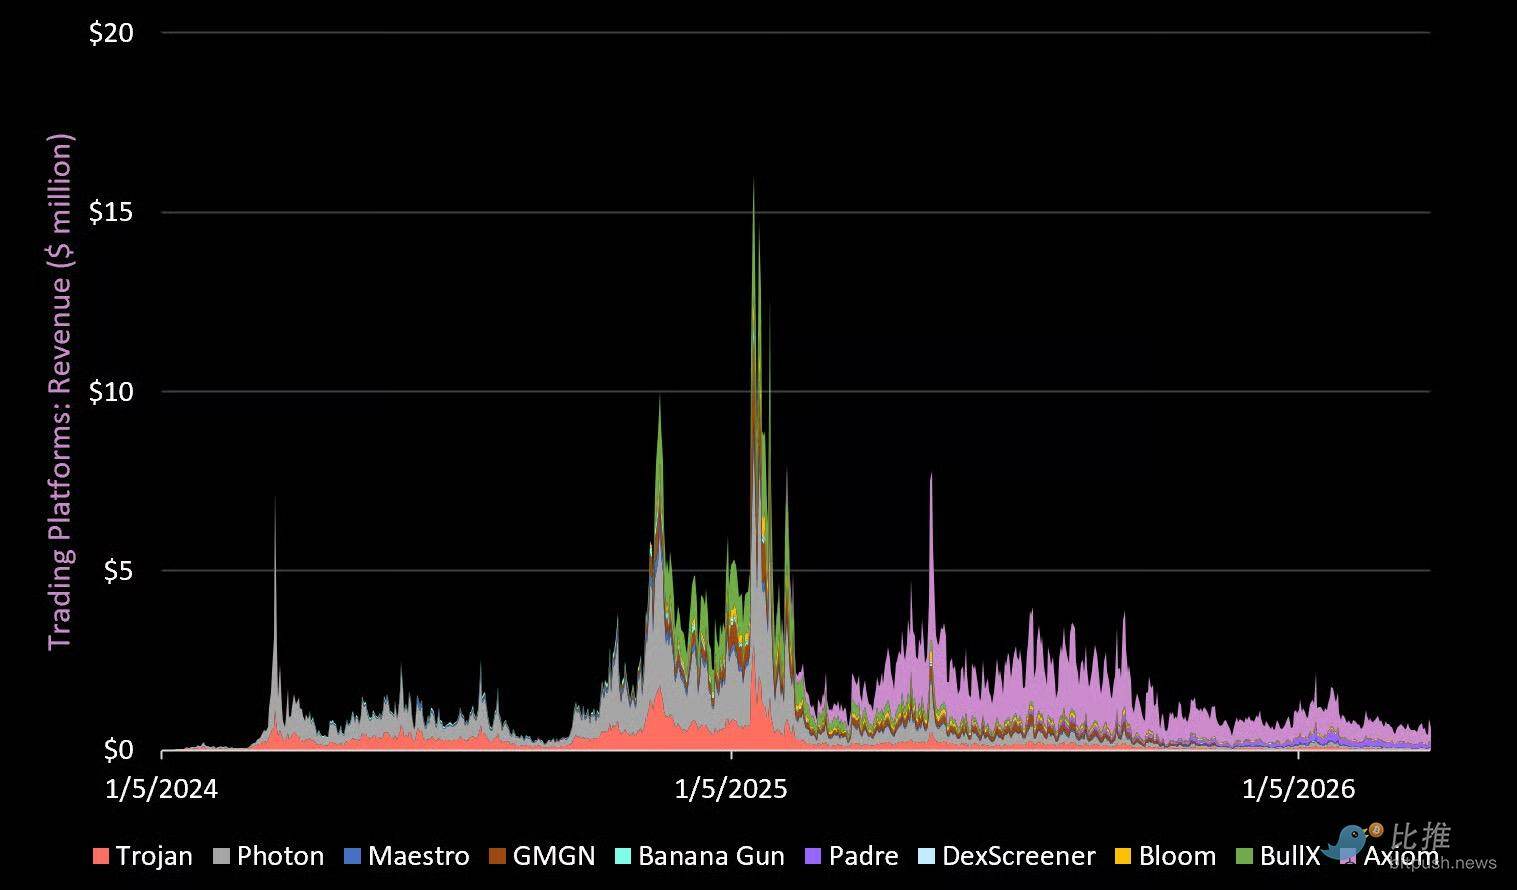
Trading App Revenue
Key Points
- Trading bots/apps were among the most successful applications of the last cycle. At one point, they generated over $10 million in revenue daily. Currently, total revenue has decreased by 94% from the peak at the beginning of 2025.
- In early 2025, Axiom surged, capturing significant market share by integrating wallet, trading, and social experiences into a user-friendly interface (while utilizing underlying decentralized infrastructure).
- Axiom (Q1 revenue of $34 million) currently holds a 68% market share in this category. Padre (acquired by Pump Fun) ranks second with 18%.
- We believe the trading experience built by Axiom is the ultimate "crypto game". In our view, speculative meme coin trading is essentially just that.
- With Pump Fun launching Pump Swap (DEX) last year and acquiring Padre (trading app), it is clear they are attempting to own the entire end-to-end experience in this space.
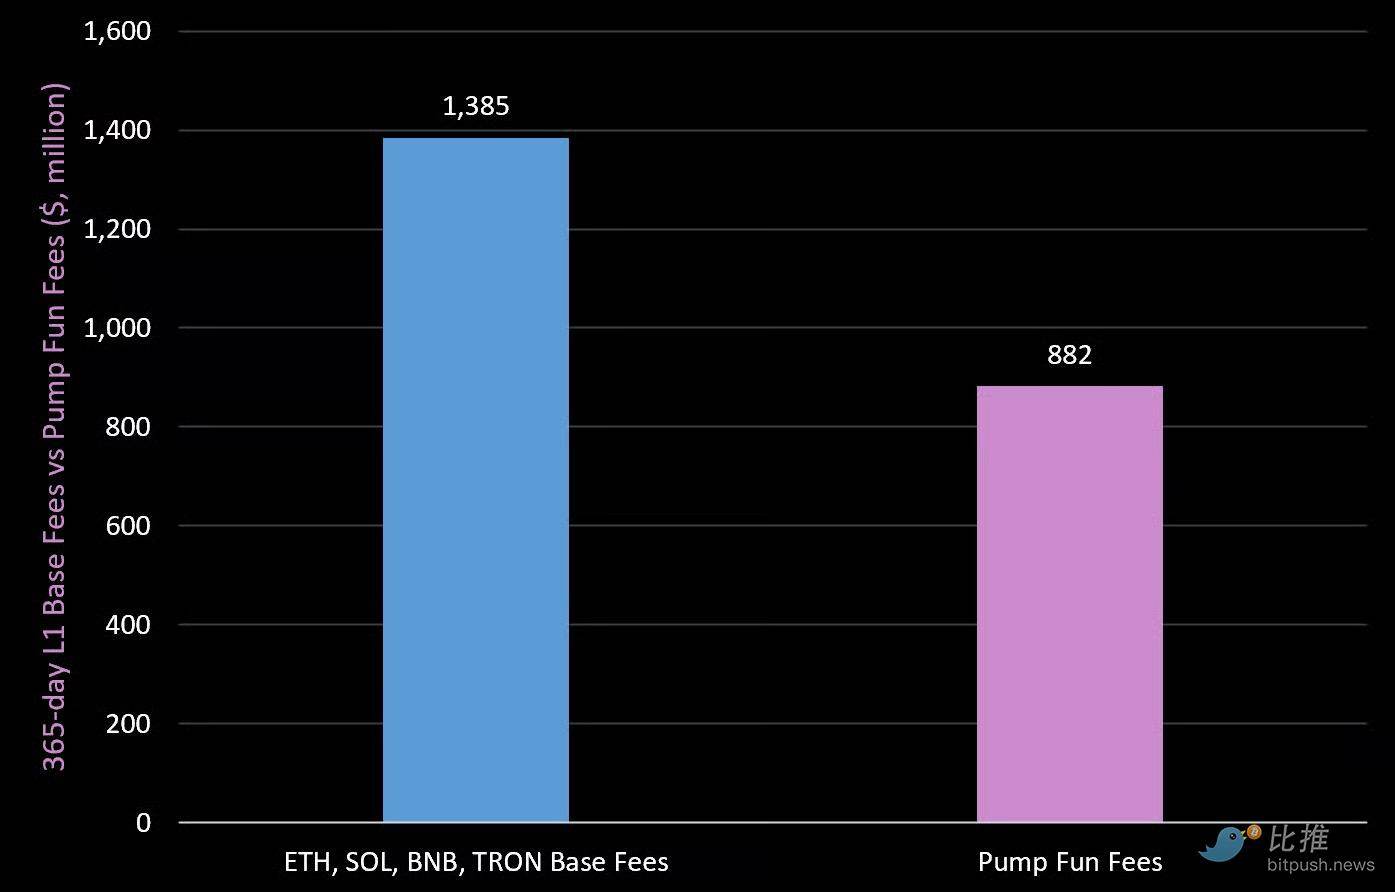
365 Day L1 Base Fees vs Pump Fun Fees
Value is clearly shifting to the upper layers of the tech stack, and we see many applications launched by small teams rapidly scaling to hundreds of millions in revenue. We expect this trend to continue into the next round of market expansion, as top L1s now have the infrastructure and distribution capabilities to help the best builders quickly launch and scale.
Conclusion and Thoughts
The market is down. Sentiment is poor, and participants are taking a breather, while tourists have returned to their original lives.
In other words, the tide has gone out.
This is why now is the best time to analyze the market.
Most crypto assets will never return to their all-time highs. But at the same time, the next 10-20x opportunities are hiding in plain sight. Oversold, forgotten.
Until it bursts forth again.
This is why we are actively conducting some of the most important research. We are doing this work now to prepare for when the next "fat pitch" opportunity arrives.
免责声明:本文章仅代表作者个人观点,不代表本平台的立场和观点。本文章仅供信息分享,不构成对任何人的任何投资建议。用户与作者之间的任何争议,与本平台无关。如网页中刊载的文章或图片涉及侵权,请提供相关的权利证明和身份证明发送邮件到support@aicoin.com,本平台相关工作人员将会进行核查。


