Author: Murphy
When the price of BTC is suppressed by STH-RP, it means that there will be a significant amount of selling pressure when the price touches the short-term cost average line of chips, thus making it unable to break through. This often marks the beginning of a large downward trend (as indicated by the orange arrow in the figure).
Therefore, we take the STH-RP model as an important risk signal!
However, once the downward trend begins, the price of BTC may deviate significantly from STH-RP, and even if there is a rebound thereafter, it will be far from the STH-RP. Therefore, we need to adjust the algorithm to provide a more referenceable value, such as the green line in the figure.
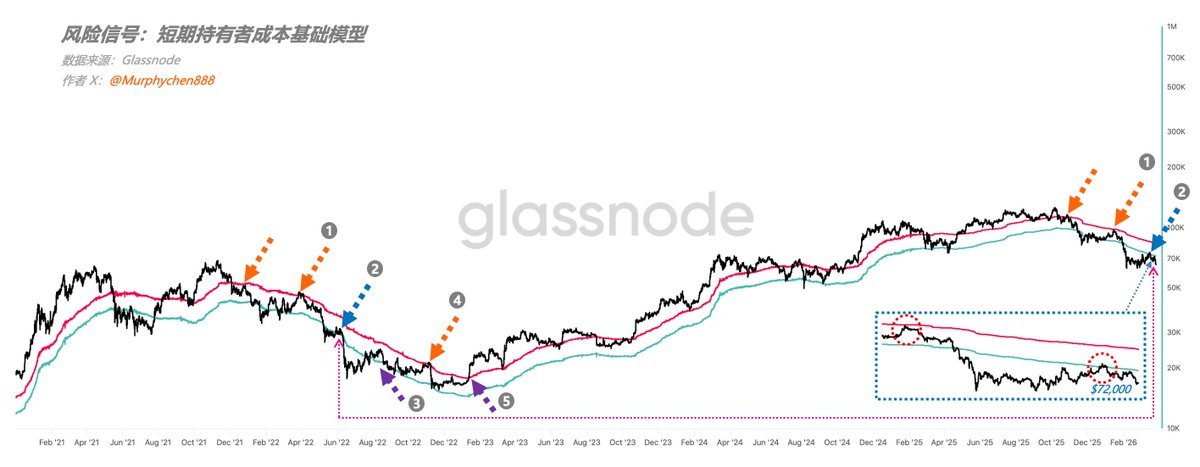
(Figure 1) Risk Signal: Short-Term Holder Cost Basis Model
Thus, we observed a visual process of potential energy decay: 1 Red line meets resistance → 2 Green line meets resistance → 3 Breaks the green line → 4 Red line meets resistance → 5 Breaks the red line, indicating the end of the bear market.
Of course, it is also possible that there is no 4 after 3, and it goes directly to 5, which is usually caused by a small probability event significantly boosting market confidence, instantly reversing the trend.
It is clear that what we currently see is: BTC is at the above-mentioned second stage; that is, it meets resistance at the green line, and both the red line and green line are still on a downward trend. In other words, as long as BTC does not break through the green line, the "rebound height" will become lower and the probability of further decline will be greater.
As of yesterday, the green line position is ——— $72,000.
Let’s switch to another perspective: from a technical indicator standpoint, the segment BTC moved in March has many similarities with January.
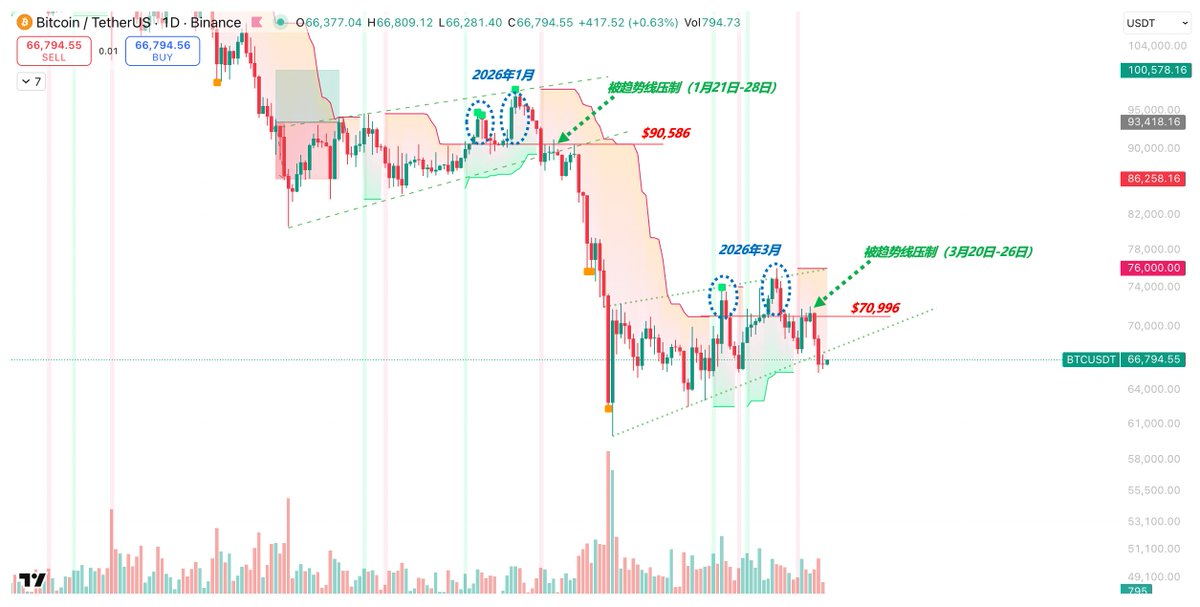
(Figure 2) BTC/USDT Daily Candlestick Chart
Both are suppressed by a downward trend line and both have had two false breakouts at the daily level (inducing longs). After the false breakouts, the trend line indicator was pulled higher, so we need to eliminate this interference and still use the previous trend line position.
For example, during the period from January 21 to 28, BTC continuously failed to break through $90,586 (red trend line) and ultimately chose to continue to decline. This time, from March 20 to 26, it again failed to effectively hold above $70,996 and dropped to $65,548.
Based on the current pattern, the probability of continuing downward far exceeds that of moving upward. This conclusion completely aligns with the results analyzed using the STH-RP risk model.
Finally, we must return to the trading level: if you find it hard to understand or lack confidence, then do not act rashly to avoid making mistakes through increased effort!
For short-term trading, my personal thought is that if the rebound approaches $70,996, I will open a short position to validate my judgment. Avoid high leverage while also allowing possible "false breakout" space, and set a stop loss if it breaks above $72,000.
For those looking to establish long-term positions, consider gradually building positions after entering phase 3 of the STH-RP risk model, until fully positioned in phase 5. This method can ensure that you buy in the relatively low range of the entire bear market; it prevents missing out and allows for controlled costs with high certainty.
免责声明:本文章仅代表作者个人观点,不代表本平台的立场和观点。本文章仅供信息分享,不构成对任何人的任何投资建议。用户与作者之间的任何争议,与本平台无关。如网页中刊载的文章或图片涉及侵权,请提供相关的权利证明和身份证明发送邮件到support@aicoin.com,本平台相关工作人员将会进行核查。


