Trend Analysis
Candlestick Patterns:
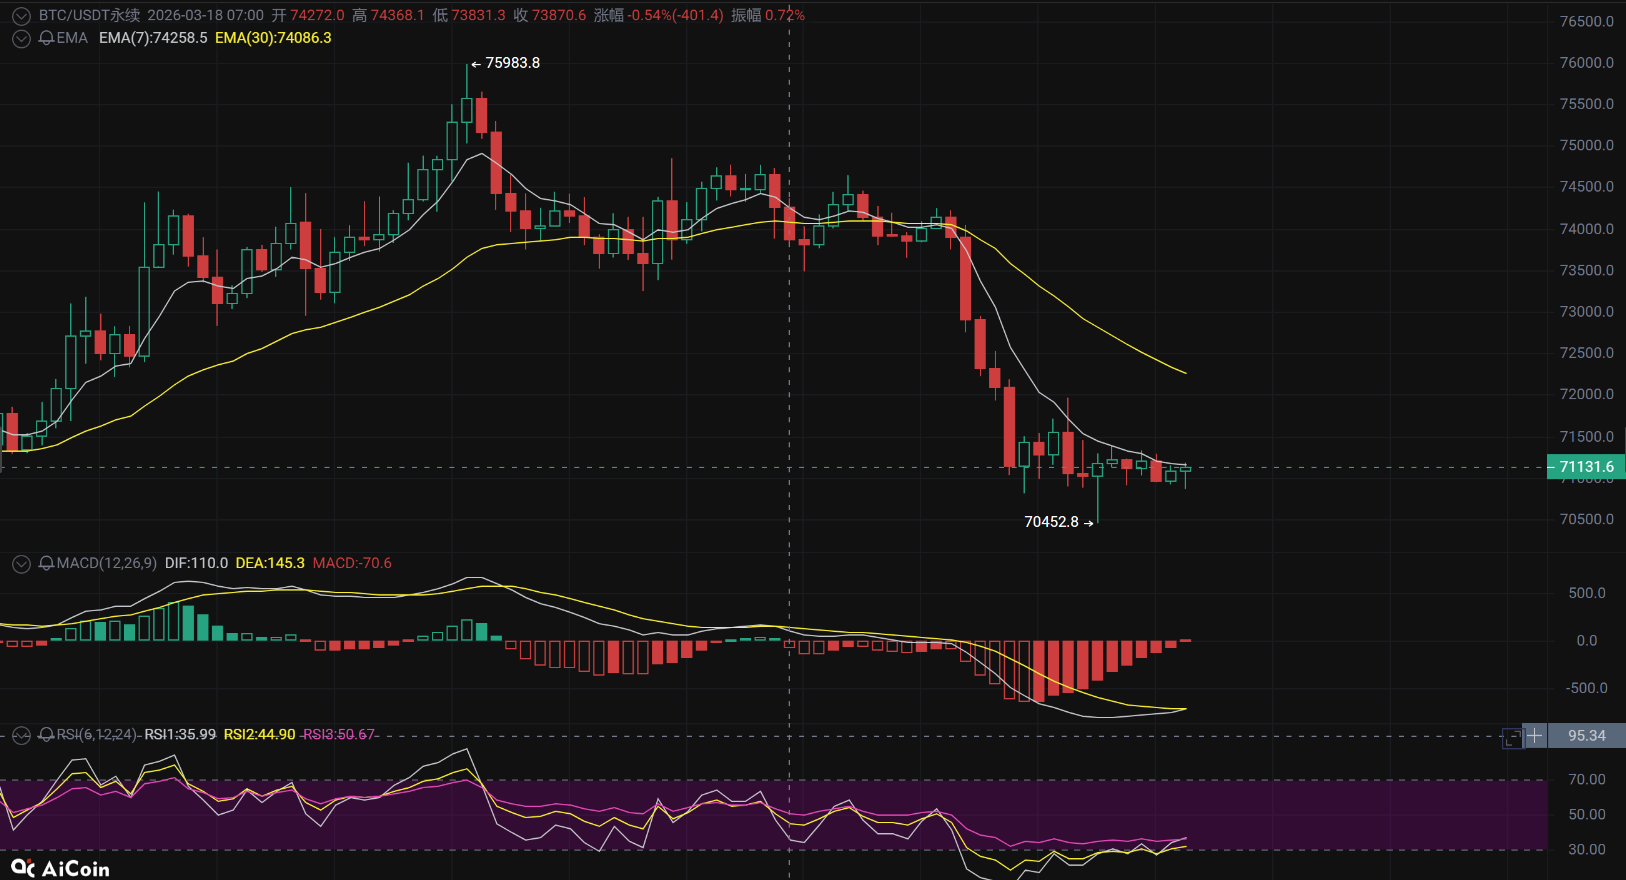
On the daily chart, a sinister dip occurred (a drop of 2662 points on March 18), followed by a volume contraction rebound, forming a continuation pattern in the decline. The hourly chart has continuously tested the 71000 threshold, forming a local double bottom structure.
Technical Indicators:
macd: After a death cross on the daily chart, the negative values continue to expand, with divergence signals appearing on the hourly level.
rsi: The daily position is below the neutral zone at 50; after being oversold on the hourly level, the rebound trend is weakening.
ema: The daily chart has fully broken below the 7/30/120 moving averages, presenting a bearish arrangement. The current price of 71135 is below ema7 (71221) and ema30 (72373), indicating a rapid decline trend.
Volume:
Yesterday showed a drop with increased volume, and today's rebound volume has shrunk. A key support point near 71000 has formed, but it is not firm amidst repeated testing.
Summary: The key level is 71000, acting as support for 4-5 hours, and if the volume does not break below 70500, the trend will change to an upward trend; if the 4-5 hour decline with volume breaks 70500 and can test the 70000 position, it will prove that the 70500 position has been broken, changing the trend to an accelerated decline, potentially reaching around 68000. (Take profit = technique + waiting)
Strategy Suggestions
Long Entry Point: 68500-68600
Stop-Loss Point: 67500-67600
Take Profit Point: 72500-73500
Short Entry Point: 73500-73600
Stop-Loss Point: 74500-75500
Take Profit Point: 70000-70500
(Investment requires caution, trading has risks, and strategy suggestions are for reference only.) Contact, Cooperation Earth Number: g18607105568
免责声明:本文章仅代表作者个人观点,不代表本平台的立场和观点。本文章仅供信息分享,不构成对任何人的任何投资建议。用户与作者之间的任何争议,与本平台无关。如网页中刊载的文章或图片涉及侵权,请提供相关的权利证明和身份证明发送邮件到support@aicoin.com,本平台相关工作人员将会进行核查。