Price Analysis
Candlestick Patterns:
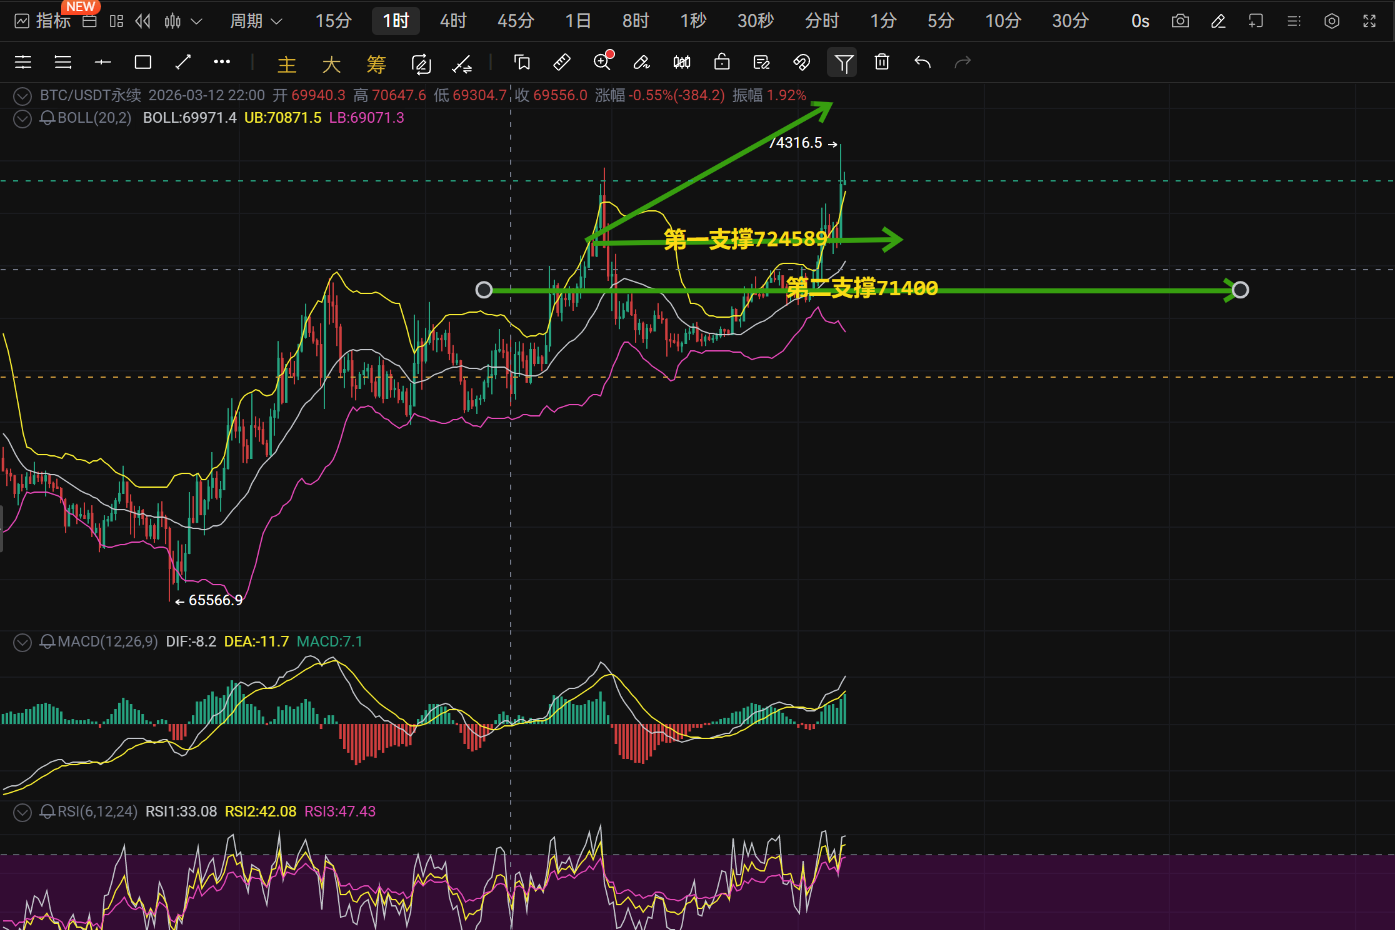
Recently, a long bullish breakout occurred at the 1-hour level (increase of 952.3 points at 8:00), followed by high-level fluctuations, forming a range between 72631-73182 with four consecutive days of gains. On March 16, the single-day increase reached 1526 points, showing an accelerated upward trend. The critical integer level of 74500 has been tested multiple times without breaking, while strong support is formed at the 72400 level.
Technical Indicators:
MACD: At the 1-hour level, the DIF (388) crosses above the DEA (298), with the histogram continuously expanding; daily MACD (1530) accelerates after the golden cross.
RSI: The 1-hour RSI (61.5) has pulled back from the overbought zone, while the daily RSI (54.6) remains in a strong range.
EMA: Weekly, monthly, and quarterly EMAs show an upward trend, with the current price of 72458 firmly above all EMAs.
Trading Volume:
During the key breakout period (today from 10:00-12:00), trading volume surged, with the last hour's volume exceeding $3.2 billion, forming a price gap.
Strategy Points
Long Entry Points: 71400-71600
Stop Loss Points: 70400-70600
Take Profit Points: 74400-74600
Short Entry Points: 74400-74600
Stop Loss Points: 75400-75600
Take Profit Points: 71400-71600
(Let's pay attention together, and strive in the cryptocurrency space, communicate, learn, and trade. Earth ID: g18607105568)
免责声明:本文章仅代表作者个人观点,不代表本平台的立场和观点。本文章仅供信息分享,不构成对任何人的任何投资建议。用户与作者之间的任何争议,与本平台无关。如网页中刊载的文章或图片涉及侵权,请提供相关的权利证明和身份证明发送邮件到support@aicoin.com,本平台相关工作人员将会进行核查。