As the price action moves toward the $1.50 support zone, which is currently a pivotal point of contention between buyers and sellers, XRP is getting close to a crucial technical moment. XRP has finally reached a point where market players must decide whether the asset can stabilize, or if another leg lower is likely after weeks of constant downward pressure.
With XRP trading below important moving averages that are still sloping lower and feeding bearish momentum, the overall trend is still under pressure. Sellers have repeatedly regained control, and recent price recovery attempts have only resulted in brief bounces. According to its current structure, XRP is heading for another test of the $1.50 level, which has previously served as short-term support during recent volatility.
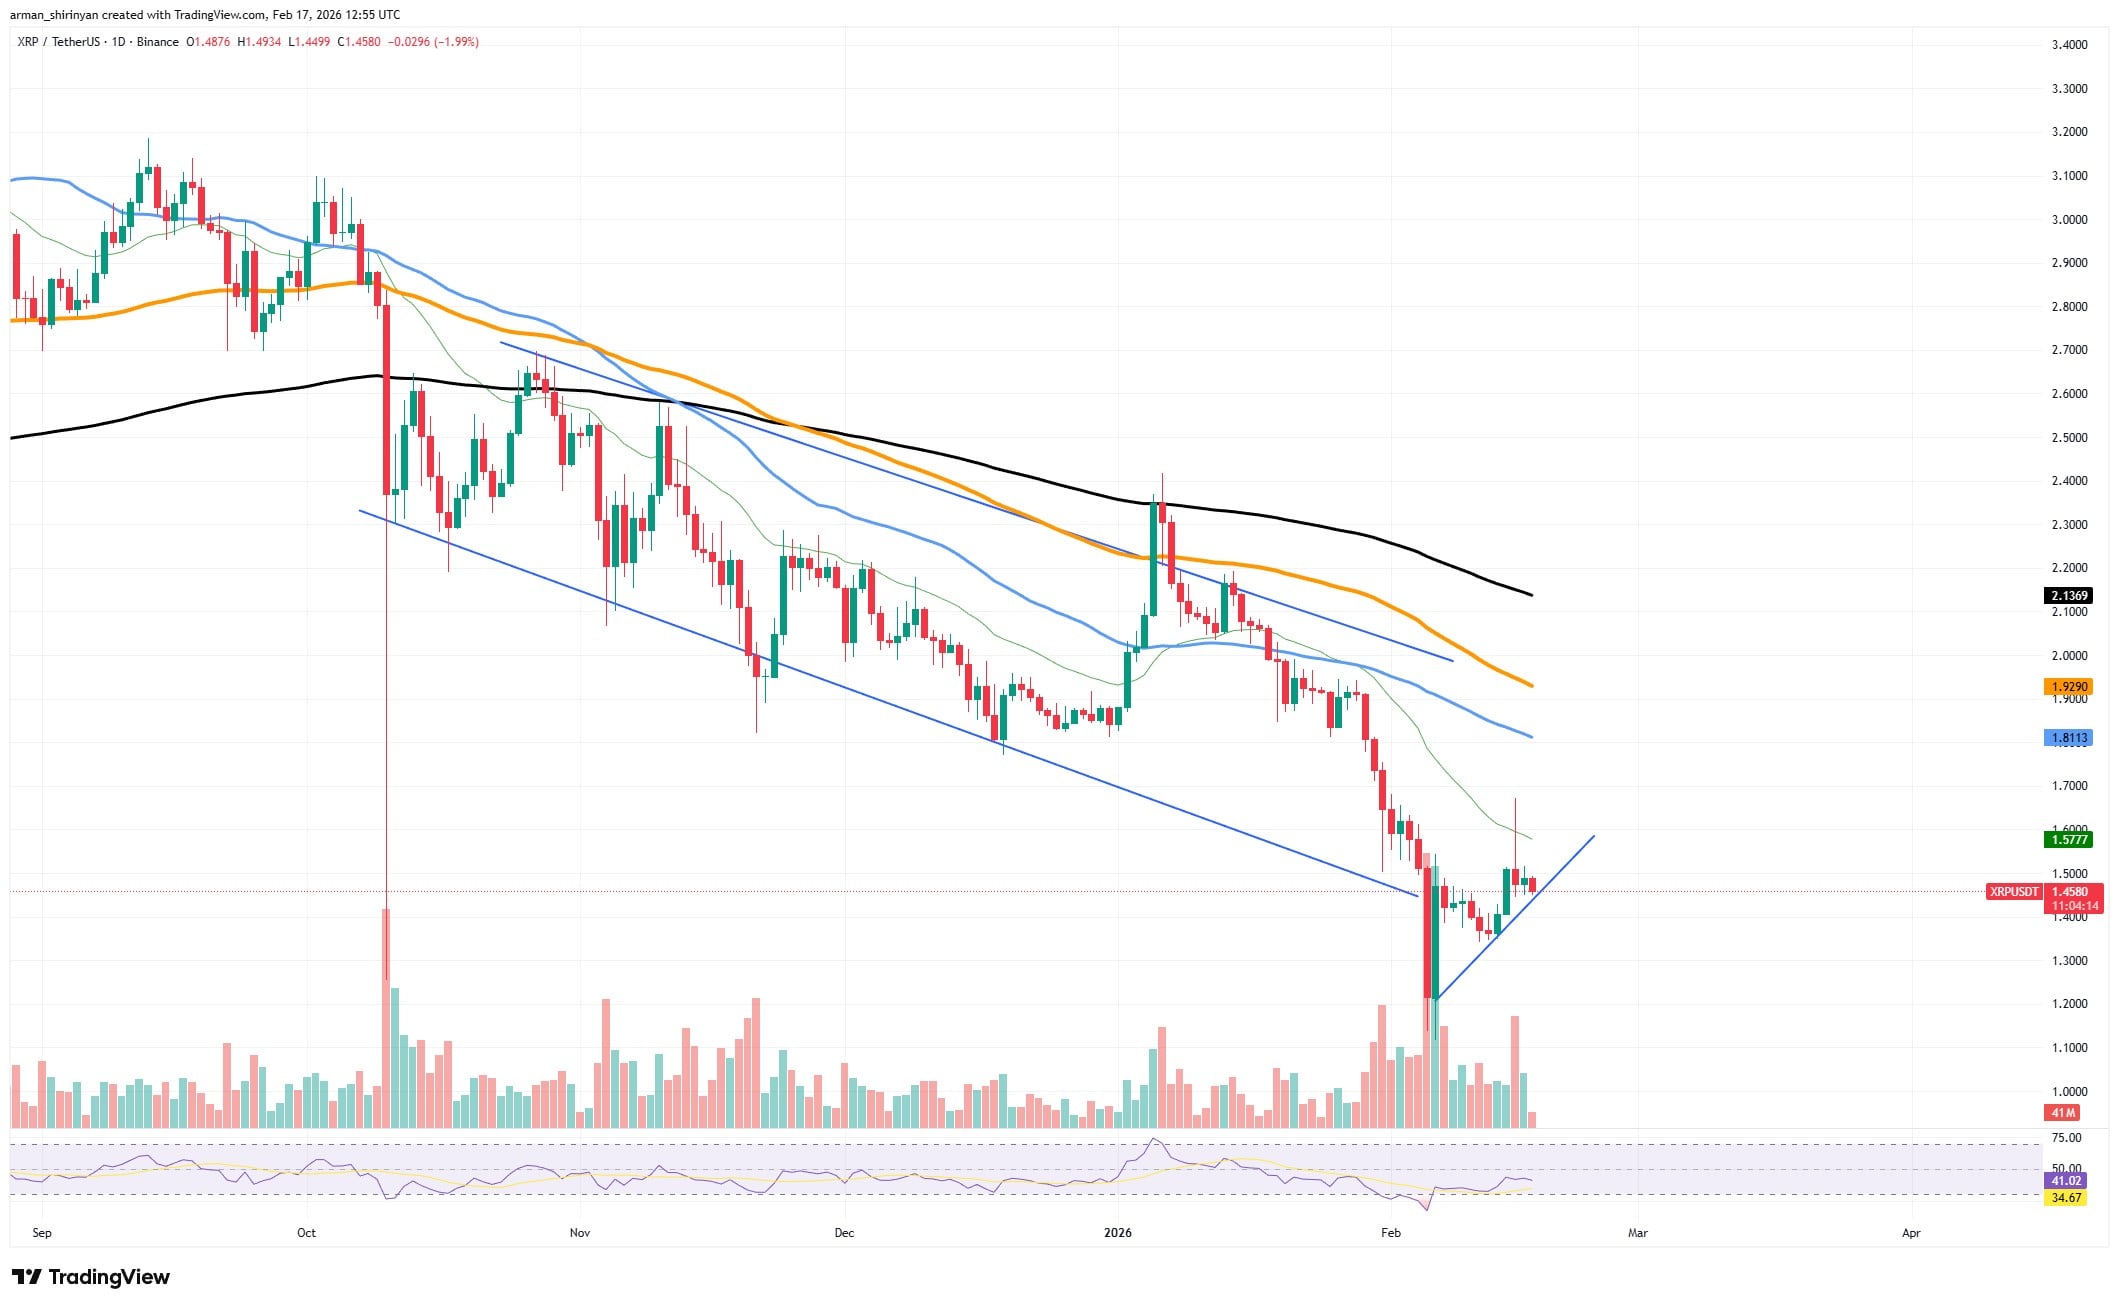
XRP/USDT Chart by TradingView
There is a good chance that this level will not break right away, though even in the face of bearish pressure. Repeatedly tested support zones frequently draw defensive buying, especially from traders hoping to seize relief rallies following protracted declines. Any impending breakdown may be slowed down by volume spikes around recent lows, which also suggest that some participants are actively accumulating at discounted prices.
HOT Stories Saylor: 'We Are in Crypto Winter' Crypto Market Review: XRP at Make-or-Break $1.50, Shiba Inu (SHIB) Enters Oversold Range, Is BTC Triangle Breakout Incoming?
However, the dangers are still high. The response may be quick if XRP is unable to maintain above $1.50 in the next test. A confirmed breakdown would probably lead to stop-loss cascades and fresh selling pressure, which could quickly push the asset toward deeper support zones. When round-number support levels do not hold, market psychology tends to increase volatility.
Overall, momentum indicators are still weak, and although there is a chance for a brief recovery, the overall bearish trend has not yet been altered. Buyers must effectively defend $1.50 and drive the price back above adjacent resistance levels if they want to prevent XRP from plunging too quickly.
Shiba Inu rounding up
After months of consistent downward pressure, Shiba Inu is starting to exhibit early technical indicators that a recovery phase may be developing. On the daily chart, SHIB may be forming a rounded bottom pattern based on recent price action. This formation is frequently linked to slow trend reversals rather than abrupt rebounds.
Selling pressure seems to be waning after a prolonged decline that drove SHIB to steadily lower levels. Price action has begun to flatten rather than make aggressive new lows, with buyers filling in during dips and progressively raising short-term support zones. Rounded bottom formations usually appear in this gradual shift from aggressive selling to cautious accumulation. Although the pattern is still in its early stages, its structure is already apparent.
The price of SHIB has started to rise after forming a base, indicating that market players are gradually moving from distribution to accumulation. Following prior sell-off-related spikes, volume activity also exhibits indications of stabilization, suggesting that panic-driven selling may be abating.
The recovery has not yet been verified, though. Key moving averages continue to serve as overhead resistance, and SHIB is still trading below them. A complete breakout has not occurred because selling pressure has halted recent attempts to move higher. The price must keep making higher lows and eventually retake adjacent resistance zones if the rounded bottom is to result in a long-term recovery.
Additionally, momentum indicators are progressively getting better, edging out of oversold territory and confirming the notion that downside momentum is waning. However, it is still necessary to exercise patience, because rounded bottoms often take some time to fully develop before making a clear upward move.
Will BTC breakthrough commence?
Following a severe sell-off earlier this month that sent the cryptocurrency below multiple important support levels, Bitcoin is now stabilizing. Price action has entered consolidation mode after a decline toward the $65,000-$68,000 range, with sellers still active close to short-term resistance and buyers trying to regain control. Though the pattern is still in its early phases, this force balance is starting to form what may eventually turn into a triangle formation on the daily chart.
Bitcoin is currently trading in a narrow range, making slightly higher lows but consistently failing to regain nearby moving averages. Following the recent panic-driven decline, this slow compression indicates that volatility is cooling. Nevertheless, the triangle that many traders are observing is far from finished. It will take a long time and more swings for the price to fully develop the pattern; only the initial structure is currently taking shape.
You Might Also Like
Tue, 02/17/2026 - 12:24 Shiba Inu Market Update: 15.4 Billion SHIB Inflows and Key EMA LevelsByArman Shirinyan
It would be premature to declare an impending breakout because the structure is still in its infancy. Triangle formations usually need a long period of consolidation before a final move is made. The current price action instead indicates hesitancy as market players process the recent decline and assess whether the worst of the correction is over, or if there is still a chance for another leg down.
This cautious approach is supported by volume behavior. After a sharp increase during the decline, trading activity has since leveled off, exhibiting neither aggressive accumulation nor fresh capitulation. Additionally, momentum indicators remain neutral, showing a lack of strong directional conviction and, instead, a sense of uncertainty.
Bitcoin would need to overcome adjacent resistance zones and regain short-term trend indicators, which currently limit recovery attempts, in order for a bullish breakout scenario to be credible. If the emerging higher-low structure is not maintained, on the other hand, downside risk toward earlier support zones may reopen.
免责声明:本文章仅代表作者个人观点,不代表本平台的立场和观点。本文章仅供信息分享,不构成对任何人的任何投资建议。用户与作者之间的任何争议,与本平台无关。如网页中刊载的文章或图片涉及侵权,请提供相关的权利证明和身份证明发送邮件到support@aicoin.com,本平台相关工作人员将会进行核查。


