Author | Jeff Park (Chief Information Officer of Bitwise)
Translation | Odaily Planet Daily (@OdailyChina)
Translator | Dingdang (@XiaMiPP)
Editor’s Note: On February 5, the crypto market experienced another sharp decline, with a liquidation scale exceeding $2.6 billion in 24 hours, and Bitcoin briefly crashing to $60,000. However, the market seems to lack a clear consensus on the causes of this drop. Bitwise Chief Information Officer Jeff Park_ provides a new analytical framework from the perspective of options and hedging mechanisms. 
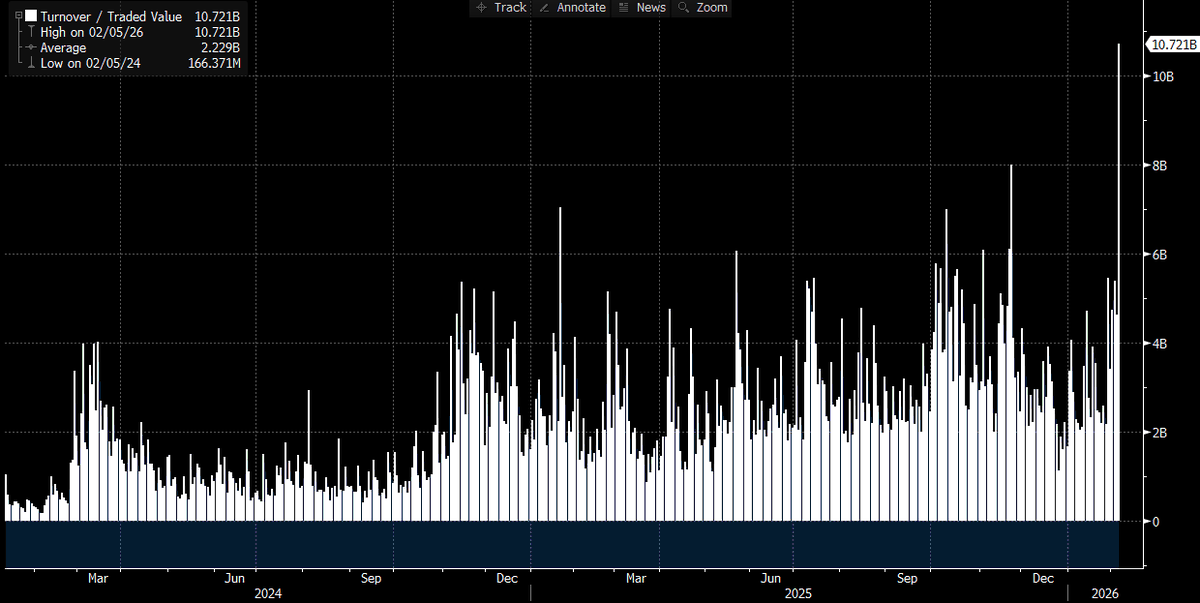
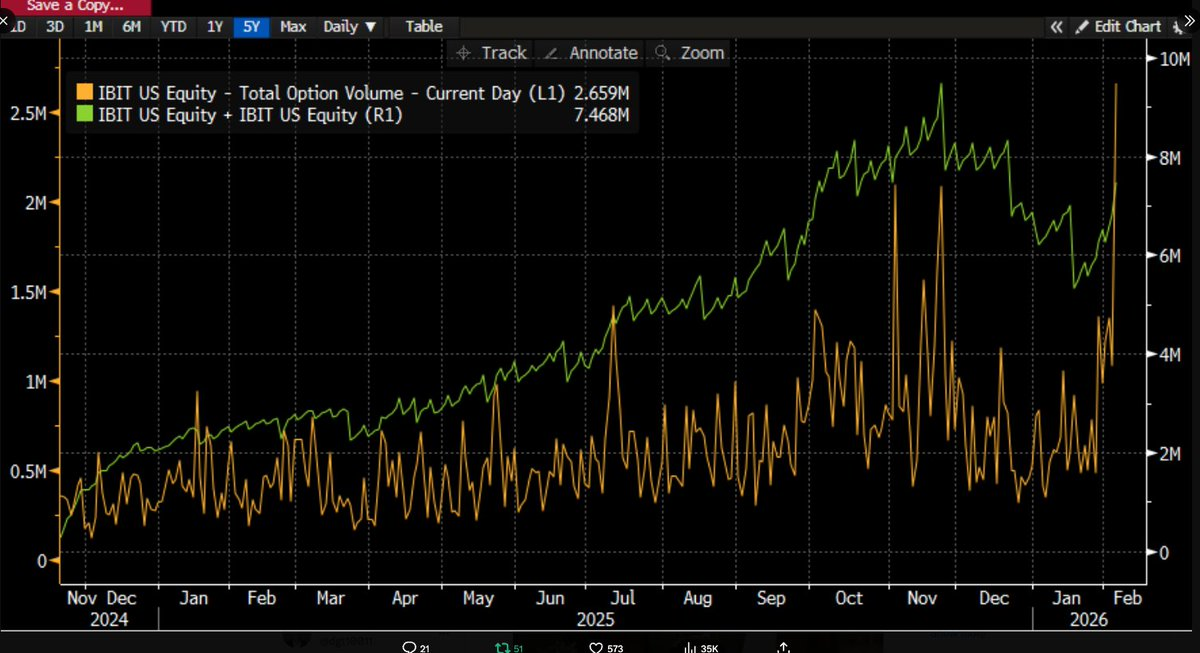
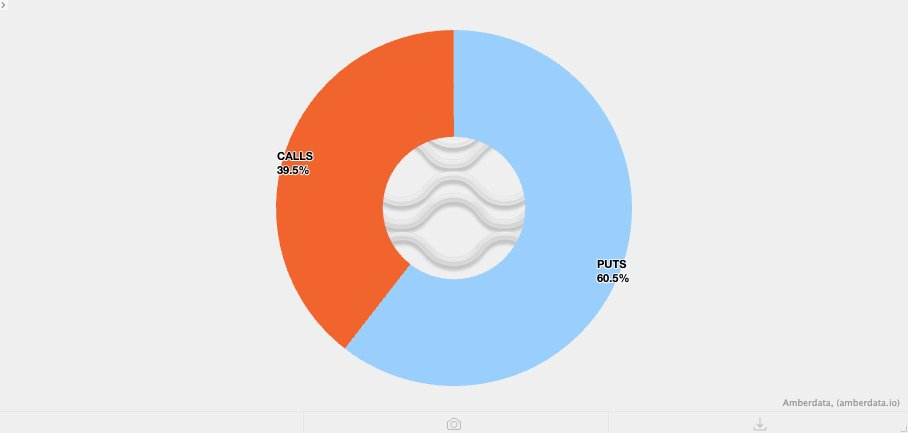
As time goes on and more data is disclosed, the situation is becoming clearer: this severe sell-off is likely related to the Bitcoin ETF, and that day was also one of the most volatile trading days in capital markets in recent years. We can draw this conclusion because the trading volume of IBIT reached a historic high that day—over $10 billion, which is twice the previous record (indeed an astonishing number). At the same time, the options trading volume also set a record (see the chart below for the highest contract volume since the ETF's launch). What is somewhat unusual compared to the past is that the structure of the trading volume indicates that this time options trading was clearly dominated by put options rather than call options (this will be further elaborated later).
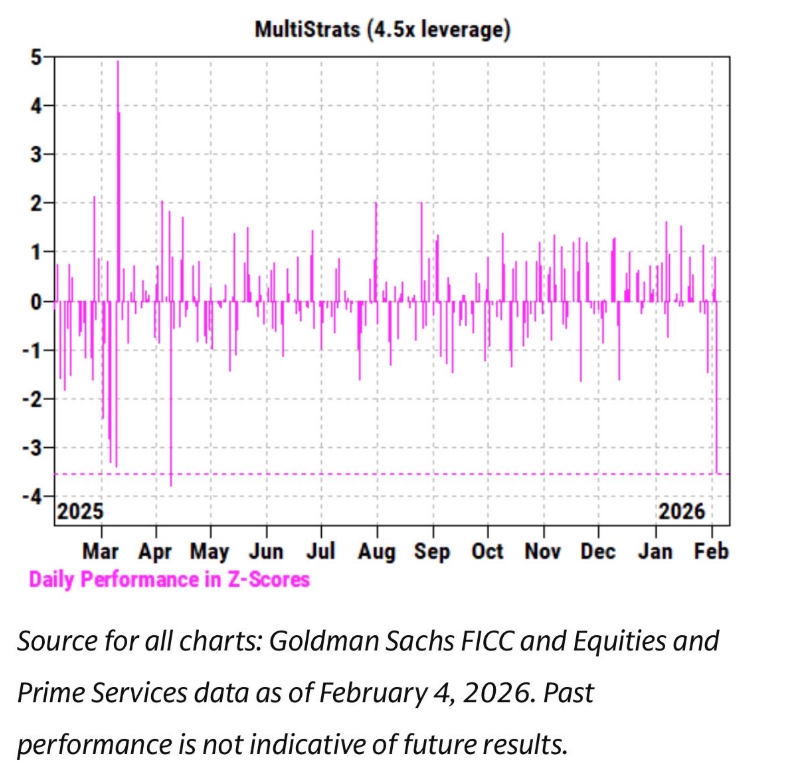
Meanwhile, over the past few weeks, we have observed that the price movements of IBIT have shown an extremely close correlation with software stocks and other risk assets. Goldman Sachs' prime brokerage (PB) team also released a report indicating that February 4 was one of the worst single days on record for multi-strategy funds, with a Z-score as high as 3.5. This means it was an extreme event with a probability of only 0.05%, ten times rarer than a 3-sigma event (the classic "black swan" threshold, with a probability of about 0.27%). It can be said that this was a catastrophic shock. Typically, after such events, risk managers of multi-strategy funds (pod shops) quickly intervene, requiring all trading teams to immediately, indiscriminately, and urgently deleverage. This explains why February 5 also turned into a bloodbath.
Given the numerous records being broken and the clear downward price direction (a single-day drop of 13.2%), we initially expected to see net redemptions from the ETF. This judgment is not far-fetched when referencing historical data: for example, on January 30, after IBIT dropped 5.8% the previous trading day, there was a record redemption of up to $530 million; or on February 4, IBIT experienced approximately $370 million in redemptions amid continuous declines. Therefore, in a market environment like that on February 5, expecting at least $500 million to $1 billion in outflows was entirely reasonable.
However, the reality was quite the opposite—we saw widespread net subscriptions. IBIT added approximately 6 million shares that day, corresponding to an increase of over $230 million in assets under management. Meanwhile, other Bitcoin ETFs also recorded inflows, with the entire ETF system attracting over $300 million in net inflows.
This result is somewhat perplexing. Theoretically, one could barely imagine that the strong price rebound on February 6 somewhat alleviated redemption pressure, but to shift from "potentially reduced outflows" directly to "net inflows" is an entirely different matter. This suggests that multiple factors may be at play simultaneously, but these factors do not form a single, linear narrative framework. Based on the information we currently have, several reasonable preliminary hypotheses can be proposed, and on these hypotheses, I will provide my overall conclusions.
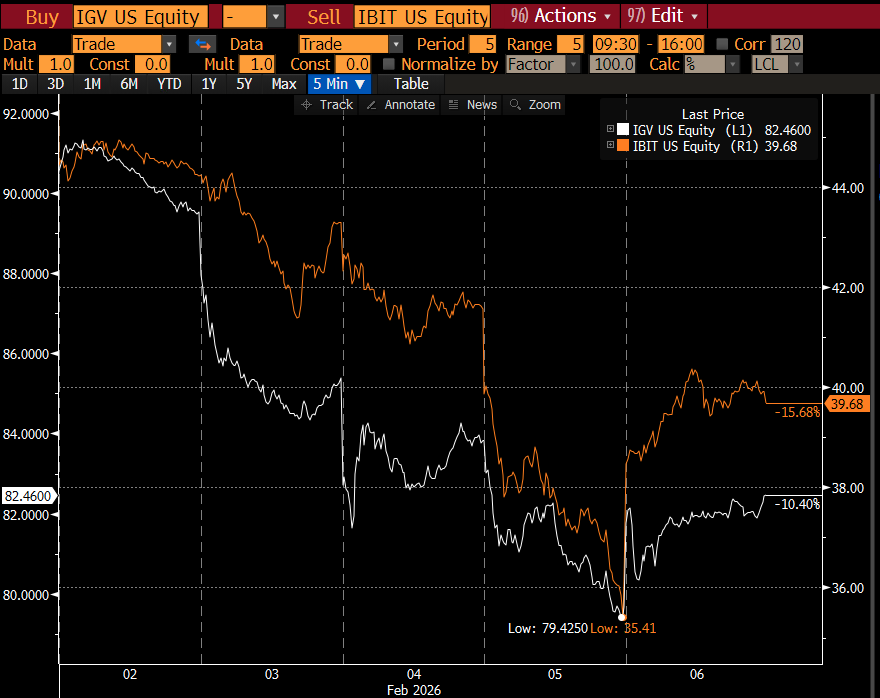
First, this round of Bitcoin sell-off likely touched upon a type of multi-asset investment portfolio or strategy that is not purely crypto-native. This could be the multi-strategy hedge funds mentioned earlier, or it could be funds like BlackRock's model portfolio business that allocate between IBIT and IGV (software ETFs) and are forced to automatically rebalance under severe volatility.
Second, the acceleration of the Bitcoin sell-off is likely related to the options market, especially the options structure related to the downside.
Third, this sell-off did not ultimately translate into capital outflows at the asset level for Bitcoin, which means that the main driving force behind the market came from the "paper money system," namely the position adjustments dominated by dealers and market makers, which are overall in a hedged state.
Based on the above facts, my current core hypotheses are as follows.
- The direct catalyst for this sell-off was a widespread deleveraging triggered by multi-asset funds and portfolios reaching statistically abnormal levels of correlation with risk assets.
- This process subsequently triggered an extremely fierce deleveraging, which also included Bitcoin risk exposure, but a significant portion of this risk was actually in "Delta neutral" hedged positions, such as basis trading, relative value trading (like Bitcoin relative to crypto stocks), and other structures typically used by dealers to "box" remaining Delta risk.
- This round of deleveraging then triggered a negative Gamma effect, further amplifying the downward pressure, forcing dealers to sell IBIT. However, due to the severity of the sell-off, market makers had to net short Bitcoin without considering their own inventory. This process, in turn, created new ETF inventory, thereby reducing the market's original expectations of large-scale capital outflows.
Subsequently, on February 6, we observed positive capital inflows into IBIT, with some IBIT buyers (the question is, what type of buyers these are) choosing to allocate on dips after the decline, further offsetting the small net outflows that might have occurred.
First, I personally tend to believe that the initial catalyst for this event came from the sell-off of software stocks, especially considering the high correlation between Bitcoin and software stocks, even higher than that with gold. Please refer to the two charts below.
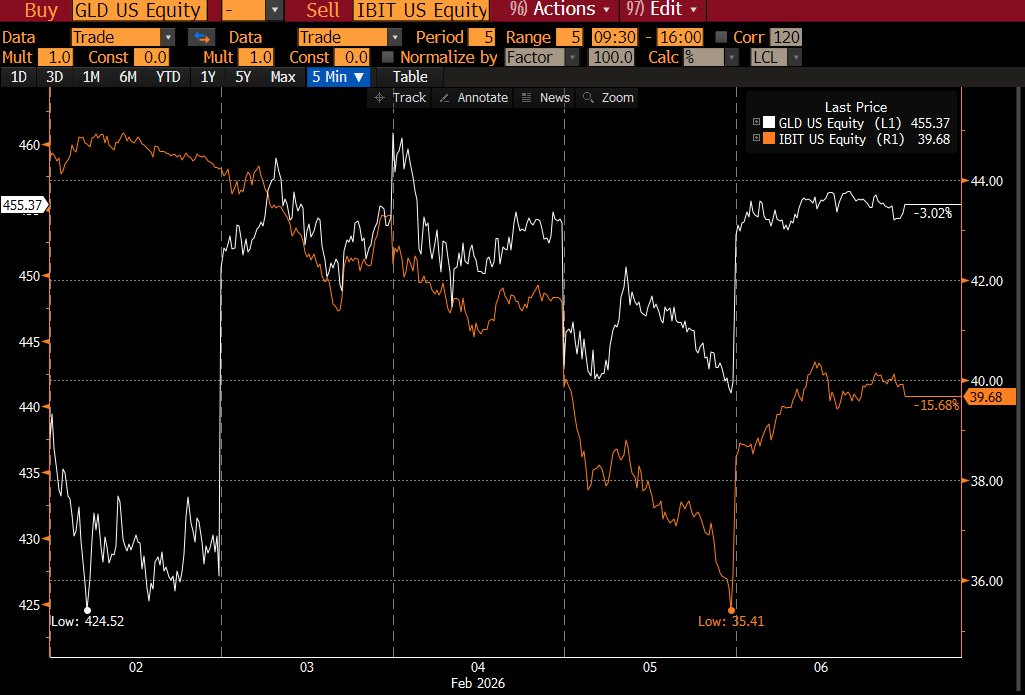
This is logically valid because gold is not typically a heavily held asset by multi-strategy funds participating in financing trades, although it may appear in RIA model portfolios (a pre-designed asset allocation scheme). Therefore, in my view, this further corroborates the judgment that the center of this turmoil is more likely within the multi-strategy fund system.
The second judgment thus becomes even more reasonable, namely that this fierce deleveraging process indeed included Bitcoin risk in a hedged state. Taking CME Bitcoin basis trading as an example, this has long been one of the most preferred trading strategies for multi-strategy funds.
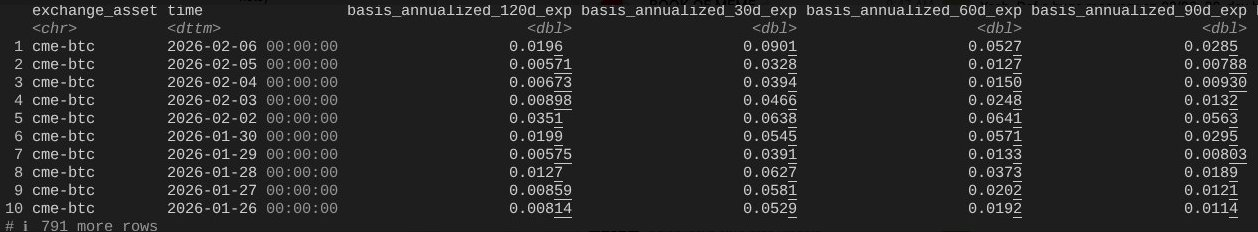
From the complete data from January 26 to yesterday, covering the CME Bitcoin basis trends for 30, 60, 90, and 120 days (thanks to top industry researcher @dlawant for the data), it is clear that the near-month basis surged from 3.3% to as high as 9% on February 5. This is one of the largest jumps we have personally observed in the market since the ETF's launch, almost clearly pointing to one conclusion: basis trading was forcibly liquidated on a large scale under orders.
Let’s imagine institutions like Millennium and Citadel, being forced to forcibly close basis trading positions (selling spot, buying futures). Considering their size in the Bitcoin ETF system, it is not hard to understand why this operation would cause a severe shock to the overall market structure. I have previously written my analysis on this point.
Odaily Planet Daily adds: Currently, a large amount of this indiscriminate domestic selling in the U.S. likely comes from multi-strategy hedge funds. These funds often employ delta hedging strategies or run some form of relative value (RV) or factor-neutral trading, and these trades are currently widening spreads, possibly accompanied by growth stock equity correlation spillover.
A rough estimate: about one-third of Bitcoin ETFs are held by institutional types, and approximately 50% (possibly more) are believed to be held by hedge funds. This is a considerable flow of fast money, and once financing costs or margin requirements rise in the current high-volatility environment, risk managers intervene, these funds can easily capitulate and liquidate, especially when the basis yield no longer justifies the risk premium. It is worth mentioning that today MSTR's dollar trading volume is one of the highest in its history.
This is why the biggest factor that makes hedge funds most likely to fail is the notorious "common holder risk": multiple seemingly independent funds hold highly similar exposures, and when the market declines, everyone rushes to the same narrow exit, causing all downside correlations to trend towards 1. Selling in such poor liquidity is a typical "closure risk" behavior, and we are seeing this phenomenon today. Ultimately, this will be reflected in the ETF fund flow data. If this hypothesis holds, once all this liquidation is over, I suspect prices will quickly reprice, but afterwards, rebuilding confidence will still take some time.
This brings us to the third clue. Since we have understood why IBIT was sold off in the context of widespread deleveraging, the question becomes: what exactly is accelerating the decline? One possible "accelerant" is structured products. Although I do not believe the scale of the structured products market is sufficient to trigger this sell-off on its own, when all factors align in an extraordinarily and perfectly abnormal way beyond any Value at Risk (VaR) model's expectations, they could very well become an acute event that triggers a chain liquidation.
This immediately reminds me of my experience at Morgan Stanley. There, structured products with knock-in put barriers (where the option only "activates" into a valid put option when the underlying asset price touches/crosses a specific barrier level) often had devastating consequences. In some cases, the change in option Delta could even exceed 1, a phenomenon that the Black-Scholes model does not even consider—because under the standard Black-Scholes framework, for ordinary vanilla options (the most basic European call/put options), the option's delta can never exceed 1.
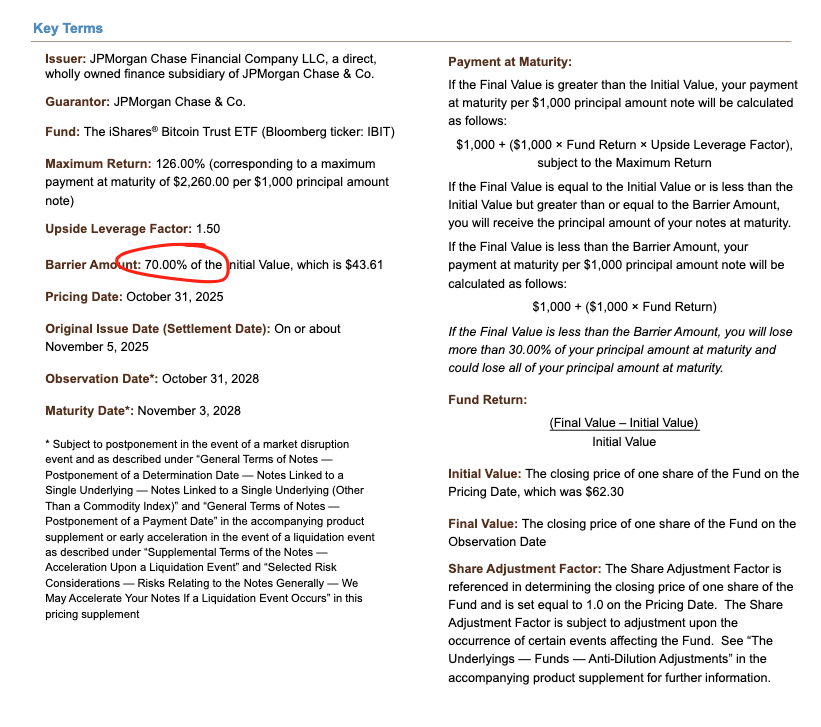
For example, a note priced by JPMorgan last November had its knock-in barrier set precisely at 43.6. If these notes continued to be issued in December while the Bitcoin price dropped by 10%, one can imagine that a large number of knock-in barriers would accumulate in the 38–39 range, which is what is referred to as the "eye of the storm."
In the event that these barriers are breached, if dealers hedge the knock-in risk by selling put options, then under negative Vanna dynamics, the speed of change in Gamma would be extremely rapid. At this point, as a dealer, the only viable response would be to aggressively sell the underlying asset as the market weakens. This is precisely what we observed: implied volatility (IV) collapsed to near 90% of historical extremes, reaching a nearly catastrophic squeeze state, in which dealers had to expand their short positions in IBIT to the extent that it ultimately created net new ETF shares. This part does require a certain degree of extrapolation, and it is difficult to fully confirm without more detailed spread data, but considering the record trading volume that day and the deep involvement of authorized participants (APs), this situation is entirely possible.
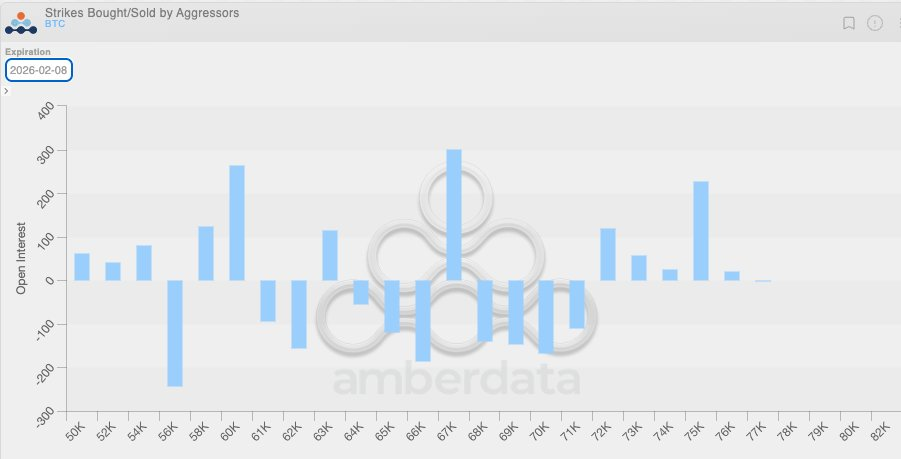
Combining this negative Vanna dynamic with another fact makes the logic clearer. Due to the overall low volatility in the previous period, clients in the crypto-native market generally tended to buy put options in the past few weeks. This means that crypto dealers were inherently in a short Gamma state and had underestimated the potential for extreme volatility in the future. When a significant market movement actually occurred, this structural imbalance further amplified the downward pressure. The position distribution chart below clearly shows this, with dealers primarily concentrated on short Gamma positions in put options in the $64,000 to $71,000 range.
This brings us back to February 6, when Bitcoin completed a strong rebound of over 10%. At this time, a noteworthy phenomenon is that the expansion rate of CME's open interest (OI) was significantly faster than that of Binance (thanks again to @dlawant for aligning hourly data to 4 PM Eastern Time). From February 4 to 5, it is clear to see the significant collapse of CME OI, which again confirms the judgment that basis trading was forcibly liquidated on a large scale on February 5; while on February 6, this portion of positions may have been reestablished to take advantage of higher basis levels, thereby offsetting the impact of capital outflows.
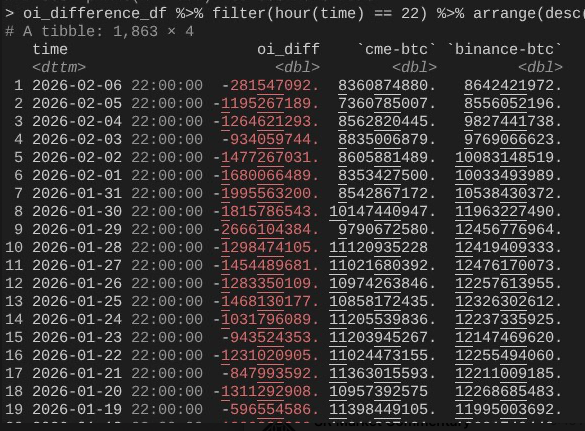
At this point, the entire logical chain closes: IBIT is roughly balanced at the subscription and redemption level because CME basis trading has resumed; however, the price remains low because Binance's OI has experienced a significant collapse, indicating that a considerable portion of the deleveraging pressure comes from short Gamma positions and forced liquidations in the crypto-native market.
This is my best explanation for the market performance on February 5 and the subsequent February 6. This extrapolation is based on several assumptions and is not entirely satisfying, as it does not point to a clear "culprit" to blame (like the FTX incident). But the core conclusion is this: the trigger for this round of sell-off came from traditional financial de-risking behavior in non-crypto domains, which coincidentally pushed Bitcoin prices into a range where short Gamma hedging behavior would accelerate the decline. This drop was not driven by directional bearishness but triggered by hedging demand, ultimately reversing rapidly on February 6 (unfortunately, this reversal primarily benefited market-neutral funds in traditional finance rather than directional strategies in the crypto-native space). While this conclusion may not be thrilling, at least it provides some reassurance: the sell-off the previous day likely had nothing to do with the 10/10 event.
Yes, I do not believe that what happened last week was a continuation of the 10/10 deleveraging process. I read an article suggesting that this turmoil might stem from a non-U.S. fund based in Hong Kong, which participated in a yen carry trade and ultimately failed. However, this theory has two obvious flaws. First, I do not believe there would be a non-crypto prime broker willing to service such a complex multi-asset trade while also providing a 90-day margin buffer, and not having already fallen into insolvency as risk frameworks tightened. Second, if the carry trade funds were "rescued" by purchasing IBIT options, then the decline in Bitcoin prices itself would not accelerate risk release—these options would simply become out-of-the-money, and their Greeks would quickly approach zero. This means that the trade itself must contain real downside risk. If someone is simultaneously long the USD/JPY carry trade while selling IBIT put options, then such a prime broker frankly does not deserve to continue existing.
The next few days will be extremely critical, as we will obtain more data to determine whether investors are using this decline to establish new demand; if so, that would be a very bullish signal. For now, I am quite excited about the potential capital inflows into ETFs. I still firmly believe that true RIA-style ETF buyers (as opposed to relative value hedge funds) are discerning investors, and at the institutional level, we are seeing significant and profound progress, which is evident throughout the industry's advancement and among my friends at Bitwise. Therefore, I am particularly focused on net inflows that have not been accompanied by the expansion of basis trading.
Finally, all of this again indicates that Bitcoin has integrated into the global financial capital markets in an extremely complex and mature way. This also means that when the market stands on the side of reverse squeezes in the future, upward movements will be steeper than ever before.
The fragility of traditional financial margin rules is precisely Bitcoin's anti-fragility. Once the price rebounds—something I see as inevitable, especially after Nasdaq raised the limits on options open interest—it will be an extraordinarily spectacular market.
免责声明:本文章仅代表作者个人观点,不代表本平台的立场和观点。本文章仅供信息分享,不构成对任何人的任何投资建议。用户与作者之间的任何争议,与本平台无关。如网页中刊载的文章或图片涉及侵权,请提供相关的权利证明和身份证明发送邮件到support@aicoin.com,本平台相关工作人员将会进行核查。


