On the Bitcoin price chart, a Fibonacci retracement line starting from the 2024 low and extending to the 2025 historical high is becoming the focus of global investors.
The cryptocurrency market is undergoing a deep adjustment since the end of 2024, with Bitcoin having fallen below the 50% retracement level, approaching the critical 61.8% Fibonacci retracement level.
Meanwhile, the mainstream coin market is becoming increasingly polarized, with most crypto tokens continuing to decline since December 2024, and ordinary tokens losing up to 79% of their value, while Bitcoin has only dropped about 6% in 2025, indicating a significant change in market structure.
1. Convergence Trend of Historical Retracements
Bitcoin's historical bull market cycles have always been accompanied by deep retracements, but data shows that the magnitude of these retracements is systematically converging. According to market analysis, the maximum retracement in Bitcoin's four bull markets since 2008 shows a clear decreasing trend.
● The first bull market (2011) saw a drop from a high of $33 to a low of $2, with a retracement of up to 94%, reflecting the extremely poor liquidity and limited participation of geeks in the early market.
● Entering the second bull market in 2013, Bitcoin fell from a high of $1,150 to a low of $150, with a retracement reduced to 87%. During this period, Bitcoin first entered the public eye, but the exchange system was not yet mature, and the market structure remained fragile.
● By the time of the third bull market in 2017, the ICO bubble burst, and leverage and junk assets flooded the market, with Bitcoin dropping from a high of $19,000 to a low of $3,200, further converging the retracement to 84%.
● The most recent bull market in 2021 witnessed institutional entry, the formation of spot ETF expectations, and the maturation of mining, with Bitcoin retracing from a high of $69,000 to a low of $15,000, reducing the retracement to 77%.
2. Key Technical Levels and Current Market Position
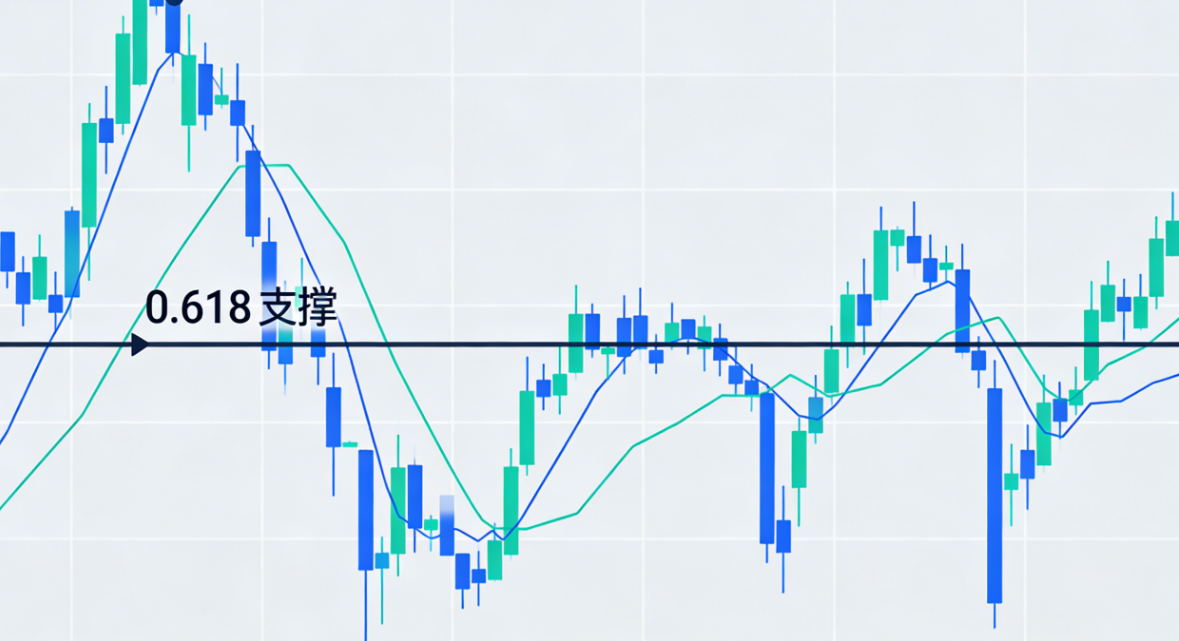
● The current Bitcoin price trend is testing multiple key technical support levels. According to market data, Bitcoin hit a low of $72,945 in early February 2026, the lowest level since early November 2024. This price point is significant as it is close to the 61.8% Fibonacci retracement level drawn from the low of $49,000 in August 2024 to the historical high of $126,199 in October 2025.
● Technical analysts point out that Bitcoin's price has fallen below the 61.8% Fibonacci retracement level of $78,490, and if it continues to decline, it may extend down to the critical psychological level of $70,000, and could even test the $58,000-$60,000 range.
● More pessimistic analyses suggest that if Bitcoin follows historical patterns, there is a possibility of a further drop of 25%-30% from current levels, which would bring the price to the $58,000 to $60,000 range, aligning with the 0.618 Fibonacci retracement level of approximately $126,000 at the 2025 peak.
This area is seen as the "OG" support zone and is also the starting point of the first breakout in 2024.
3. Market Polarization and Altcoin Dilemma
● A significant feature of the current cryptocurrency market is the extreme polarization. According to Pantera Capital's 2026 outlook report, the total market capitalization of crypto tokens excluding Bitcoin, Ethereum, and stablecoins has plummeted by about 44% from the peak at the end of 2024 to the end of 2025.
● There are huge performance discrepancies among different asset classes: Bitcoin closed down about 6% in 2025, Ethereum down about 11%, SOL down 34%, while other tokens excluding these three have collectively dropped nearly 60%.
● Most shockingly, ordinary tokens have lost about 79% of their value, with Pantera describing 2025 as a "highly concentrated market," where only a few tokens have seen gains.
● This polarization partly stems from changes in market fundamentals. Pantera points out that the current downward drivers are less related to traditional fundamentals and are more driven by policy changes, tariff concerns, and shifts in risk tolerance.
● The massive forced sell-off that occurred in October 2025 liquidated over $20 billion in positions, exceeding the scale of the Terra/Luna and FTX collapse periods.
4. On-Chain Data and Derivatives Market Signals
● On-chain data provides deeper insights into the current market adjustment. Ethereum's derivatives market shows that open interest has fallen by over 50% from a historical high of $70 billion, directly evaporating $35 billion in positions.
● In contrast, Bitcoin's retracement has only been 38%, indicating that Ethereum has faced greater pressure at the derivatives level. However, on-chain fundamental data remains relatively stable. The total locked value of Ethereum has maintained around $70 billion, and the total collateral value has remained above $36 million since mid-November 2025.
● This state of "price deep adjustment while fundamentals remain relatively stable" reflects that the market is experiencing a thorough risk release rather than a systemic collapse.
● For Bitcoin, Glassnode's data shows that although extreme sell pressure usually accompanies sharp rises in bull markets, as the market size expands, the severity of market retracements during each bull market rebound is gradually decreasing.
The deepest retracement of this cycle occurred on August 5, 2024, with a magnitude of 32%, and in most retracements, Bitcoin's price only fell 25% from local highs, indicating that the volatility of this cycle is at historically low levels.
5. Institutional Perspective and 2026 Outlook
● From the perspective of institutional investors, the current market adjustment may create conditions for recovery in specific areas. Pantera Capital believes that the duration of the current decline has matched that of previous crypto bear markets, and if fundamentals improve and the market can expand beyond Bitcoin, better investment conditions may emerge in 2026.
● Notably, Pantera does not predict specific prices but describes 2026 as a year of shifting investment flows. If the environment stabilizes and investor risk tolerance increases, Bitcoin, stablecoin infrastructure, and crypto investments linked to equities will benefit first.
● Paul Veradittakit points out that the company expects 2026 to be dominated by institutional adoption, with growth concentrated in areas such as tokenization of real assets, AI-driven blockchain security, bank-issued stablecoins, integration of prediction markets, and an increase in the number of crypto companies going public, rather than a broad recovery in speculative token trading.
● This shift in institutional perspective reflects the maturation process of the cryptocurrency market, moving from purely speculative trading to more integration with traditional finance and the expansion of practical application scenarios.
When Bitcoin's price fell below the key Fibonacci support level of $78,490 in early February 2026, a clear technical signal appeared on the trading chart: the daily Relative Strength Index (RSI) reading dropped to 25, entering the extremely oversold zone.
At the same time, the Moving Average Convergence Divergence (MACD) indicator showed a bearish crossover on January 20, with the red histogram continuing to rise below neutral levels.
These technical indicators resonate with the market data in the Pantera report—a mainstream coin market that has evaporated 79% of its value, starkly contrasting with Bitcoin's mere 6% decline.
Join our community to discuss and grow stronger together!
Official Telegram community: https://t.me/aicoincn
AiCoin Chinese Twitter: https://x.com/AiCoinzh
OKX benefits group: https://aicoin.com/link/chat?cid=l61eM4owQ
Binance benefits group: https://aicoin.com/link/chat?cid=ynr7d1P6Z
免责声明:本文章仅代表作者个人观点,不代表本平台的立场和观点。本文章仅供信息分享,不构成对任何人的任何投资建议。用户与作者之间的任何争议,与本平台无关。如网页中刊载的文章或图片涉及侵权,请提供相关的权利证明和身份证明发送邮件到support@aicoin.com,本平台相关工作人员将会进行核查。


