Author: 0xWeilan
With the mainstreaming of consensus and the influx of Wall Street capital, BTC has gradually become "a leading indicator of global liquidity and risk appetite changes." This means that its price trends and even cycle patterns will further be constrained by the attitudes and actions of global risk capital, represented by the United States.
The internal movements of the BTC market, shaped by the four-year halving cycle, still exist and are jointly shaping the market trends and cycle patterns of this emerging asset alongside new risk capital.
Regarding the continuous decline of BTC since November, in the December 2025 monthly report, we proposed two observational frameworks: "deep bear market" and "cooling bear market," and outlined the formation conditions and temporal-spatial expressions of the final trends for both forms.
As of the end of January 2026, with the final confirmation of the new Federal Reserve chair, global risk capital's risk appetite expectations have further declined. BTC's price has fallen below the low point of November 21. Combined with the multi-dimensional judgments of the "BTC Cycle Multi-Factor Assessment Model," we believe the probability of this round of decline being classified as a "deep bear market" has further increased and may be confirmed in the near future.
Based on this judgment, EMC Labs believes that the depth and duration of the current adjustment, which began in October, will exceed the three "cooling bear markets" since January 2023, aligning more closely with the "deep bear market" of the previous four-year halving cycle. Whether the adjustment depth exceeds 70% and whether the decline duration approaches 12 months will depend on the vulnerability and clearing time of on-site institutions, changes in U.S. macro liquidity, and the progress of relevant U.S. industrial policies.
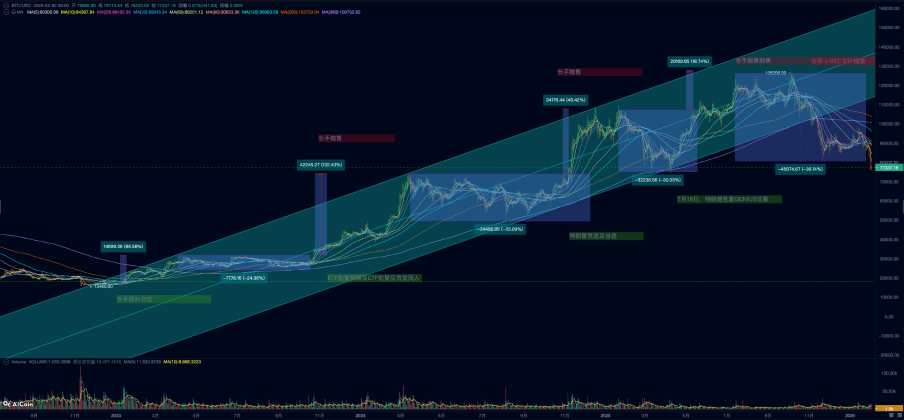
BTC Price Daily Chart
Macro Liquidity: New Federal Reserve Chair Triggers Sudden Change in Expectations
On December 23, the U.S. reported a Q3 annualized quarter-on-quarter real GDP growth of 4.3%, significantly exceeding the expected 3.3% and the previous value of 3.8%. The Q3 core Personal Consumption Expenditures (PCE) price index was also released, showing an annualized quarter-on-quarter increase of 2.9%, higher than the previous value of 2.6%, and far from the Federal Reserve's target of 2%.
Subsequent non-farm payroll data also indicated a cooling but relatively stable U.S. job market.
These data necessitate an expansion of the previously mainstream "soft landing/hard landing" dichotomy, as the probability of a "hard landing" decreases while the weight of the "no landing" scenario increases. This suggests that economic growth is relatively strong, inflation is resistant to decline, and the Federal Reserve's monetary policy cannot smoothly transition to easing, with rate cuts potentially occurring later and more slowly. In fact, economic overheating may lead to a re-discussion of rate hikes, which aligns with the Federal Reserve's dot plot indicating only one rate cut in 2026.
If the risk of "no landing" rises, the market will adjust the "terminal rate/maintaining high rates duration/term premium," leading to an increase in discount rates and high financing costs, especially when real interest rates strengthen alongside the dollar. High-duration assets like tech stocks and BTC will face valuation pressure.
However, the market did not immediately react significantly, with the Nasdaq showing sideways consolidation.
On January 30, U.S. President Trump officially nominated Kevin Warsh to serve as the Federal Reserve Chair.
Regarding the Federal Reserve's direction, Kevin Warsh wrote in a Wall Street Journal article last November titled "The Federal Reserve's Broken Leadership." In the article, he pointed out that inflation primarily stems from the Federal Reserve's own policy decisions (such as excessive money supply), rather than purely from supply chain or geopolitical factors. The widespread adoption of AI technology will significantly enhance productivity, allowing the economy to grow robustly without triggering inflation, thus creating space for substantial rate cuts by the Federal Reserve.
Rate cuts would lower corporate financing costs and reduce pressure on U.S. fiscal spending, aligning with Trump's preferences. However, he also presented another stark viewpoint in the article and subsequent interviews— that the Federal Reserve's massive balance sheet (QE policy) distorts market pricing and should be corrected through "balance sheet reduction" (QT policy) to reclaim liquidity, using this as a "cover" or compensation for lowering the benchmark interest rate.
With Kevin Warsh winning the Federal Reserve Chair race, the stock market and commodity market risk capital began pricing in a potential new round of "balance sheet reduction" by the Federal Reserve. If balance sheet reduction is restarted, the yield on ten-year U.S. Treasuries may continue to rise, further compressing the pricing of high-duration assets.
Following the announcement, on January 30, the already crowded gold and silver markets experienced violent declines of 8.35% and 25.5%. BTC, which had already broken down on January 29, continued to decline on Friday and over the weekend, fully reflecting its characteristic as "a leading indicator of global liquidity and risk appetite changes."
In addition to the new expectations pricing brought by the new Federal Reserve Chair, the slowdown in Treasury spending and the rise in account balances, along with the decline in reserves at Federal Reserve deposit institutions, have led to a renewed tightening of U.S. liquidity.
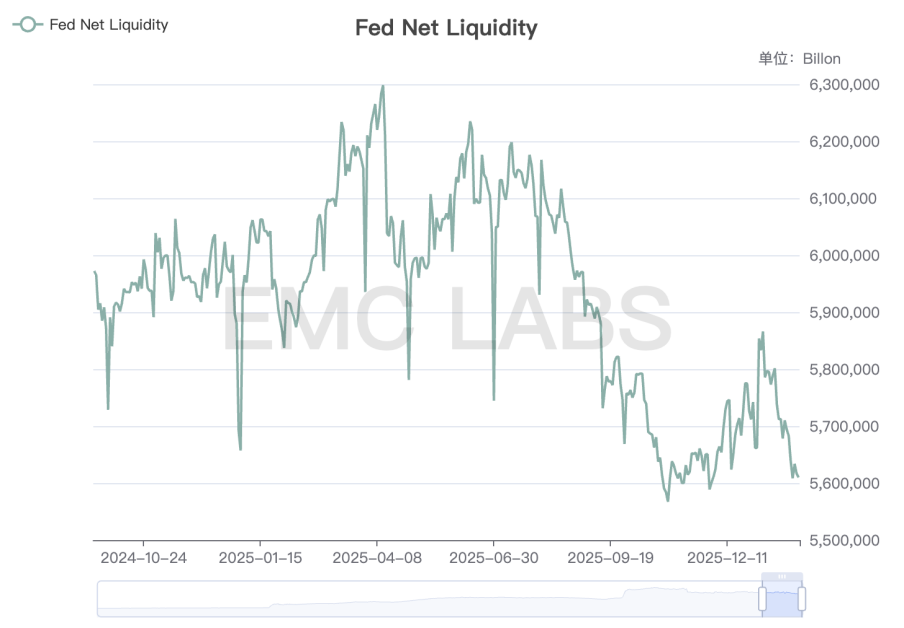
Fed Net Liquidity
The decline of BTC in January was also influenced by the "Cryptocurrency Market Clarity Act" (CLARITY Act), as voting on it was postponed due to analysis involving Coinbase and traditional banks. In fact, the main rebound of BTC this month was driven by positive voting news regarding the CLARITY Act, but after the voting was paused, it fell back to around $90,000. Until the night before the Federal Reserve Chair's announcement, macro liquidity and risk appetite expectations had once again become the main pricing factors, leading BTC into a new round of decline, reaching a low of $75,644.15.
Cryptocurrency Market: Liquidity Loss Further Deteriorates
Following the recovery of capital inflows into the cryptocurrency market in December, BTC stabilized around the $90,000 mark and rebounded to nearly $98,000. However, in January, there was a significant outflow from stablecoins and BTC ETF channels, with approximately $2.868 billion flowing out throughout the month, comparable to the $2.922 billion outflow in November.
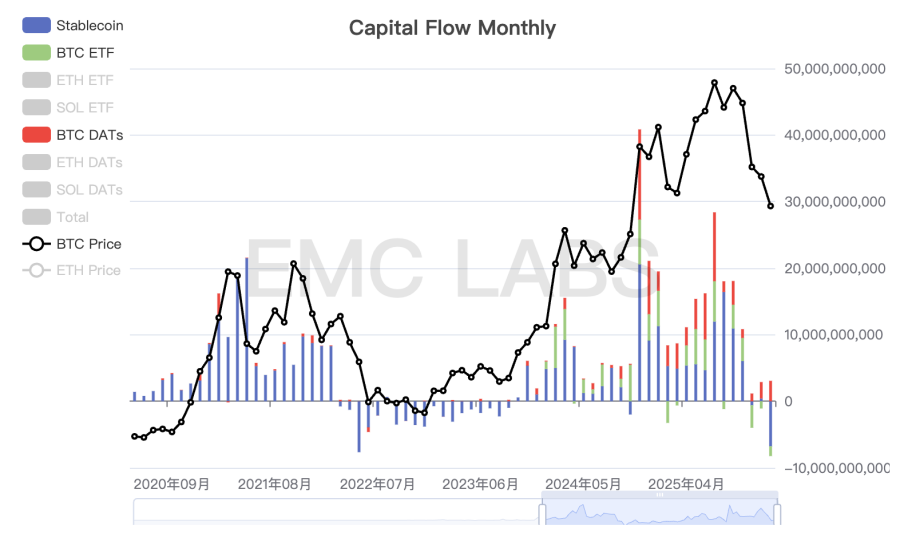
Monthly Flow Statistics of Cryptocurrency Market Funds
The outflow structure is also deteriorating.
In November, the outflow was primarily from BTC ETF channels, with only a small amount of stablecoins flowing out; during the December rebound, there was a slight inflow of stablecoins, while BTC ETF channels continued to see outflows. This month, stablecoins experienced a significant outflow of up to $6.768 billion, marking the second-largest outflow month of this cycle, only behind the $7.648 billion outflow in May 2025. Additionally, the funds from BTC ETF channels, which have been the most important driving force in this cycle, have seen outflows for three consecutive months, setting a record for the longest outflow in this cycle.
The simultaneous outflow of on-site funds and BTC ETF channel funds indicates that the liquidity loss triggered by deteriorating liquidity expectations in the BTC ETF channel has spread to the internal funds of the cryptocurrency market. It also means that currently, there is only one remaining buyer in the market, DAT company.
For assets lacking free cash flow and buybacks, the price increase of BTC primarily comes from enhanced macro liquidity and increased allocation driven by consensus diffusion. The new Federal Reserve Chair's advocacy for both "rate cuts" and "balance sheet reduction" is unlikely to be friendly to BTC, an asset lacking intrinsic cash flow. The loss of liquidity in both BTC ETF channel funds and stablecoins may just be beginning.
Cycle Stage: Probability of "Deep Bear Market" Increases Significantly
BTC is currently undergoing a historical turnover process from early investors to mature investors, and this special stage makes it very difficult to judge the cycle shape, duration, and space of the new phase.
At present, we tend to prioritize the "long-short" internal movements of the "old cycle" (i.e., the four-year halving cycle) as the main axis, overlaying macro liquidity changes, on-site fund movement patterns, on-chain profit and loss states, and other multi-dimensional indicators for comprehensive assessment.
First, let's look at the long-short internal movements.
Long-Short Position Statistics
Price peaks are often caused by turning points in macro liquidity. During the price rise, early long positions continuously sell their chips to short-term traders (short positions) and long positions that enter the market later. The more early long positions sell, the looser the market chips become, leading to greater market volatility. When liquidity expectations change, short position buying weakens, unable to absorb the selling pressure from long positions, triggering a price decline. Subsequently, short positions join the selling pressure, pushing prices further down. If there is no external force to buffer, allowing the market to fall, prices often reach the cycle bottom only after long positions that entered in the mid to late stages also join the selling. As the bear market progresses, long positions show a downward trend, followed by a gradual upward trend.
Currently, long positions are still selling, but the chips held by long positions remain at historically high levels and have not yet resumed accumulation, indicating that the bear market is likely still in its early stages.
Next, let's look at the supply of funds.
A bear market is a dual destruction of confidence and funds, especially a "deep bear market." Funds can be seen as an expression of the overall participants' emotions, showing a clear trend. Once a bear or bull market is established, the trend of outflow or inflow is often difficult to end in a short time.
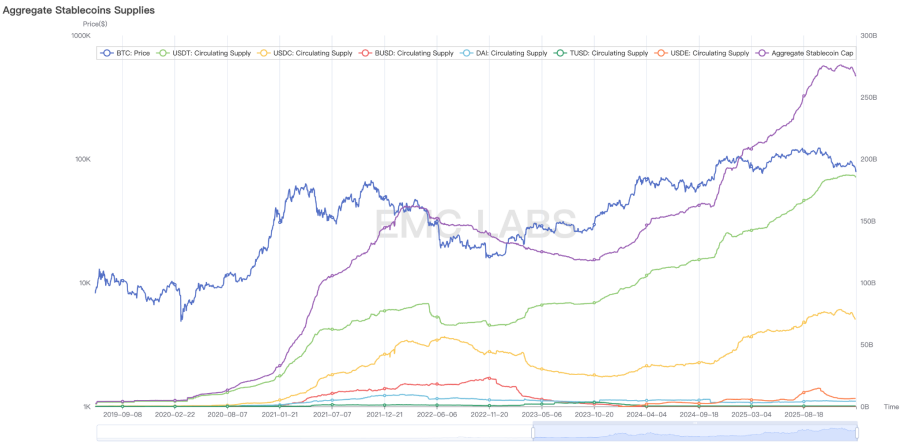
Stablecoin Supply
We select stablecoin channel funds as a representative observation. Due to historical chip distribution reasons, BTC price increases require continuous capital inflows. Once the inflow slows or stops, it often leads to the formation of a cycle top. The stablecoin channel funds in this cycle have stopped growing since October 2025, and in January this year, there was an outflow of $6.8 billion, seemingly establishing a trend turning point, approaching the stages of April or May 2022. This also indicates that the current market is in the early stages of a bear market. If funds continue to withdraw, it will inevitably push prices further down. The transition from outflow to inflow often takes more than a year, and it is only after the market experiences a bottom and recovery that an upward trend is re-established, leading to an overall positive inflow of funds.
Finally, let's look at the on-chain profit and loss status.
Due to the transparency of the Bitcoin network, we can glimpse the cost price and profit and loss status of all UTXOs, allowing us to observe whether a "deep bear market" has been established and to what stage it has reached.
We do not observe the profit status of a specific group but instead use a macro perspective to gain insight by statistically analyzing the profit and loss status of all UTXOs, judging the overall pressure borne by market participants and their "surrender" (stop-loss) status under immense pressure.
In the early stages of the cycle, during the recovery phase, MVRV gradually rises, crossing the midline to form a bull market, with the market overall in a profitable state until it crosses the upper line. As long positions take profits and sell more, market pressure increases, leading to price declines. During the final price peak, there may be several mid-term adjustments, and MVRV may revisit the midline until the selling pressure and buying power dynamics reverse, making it difficult for the midline to support MVRV, causing the market overall to begin transitioning to losses.
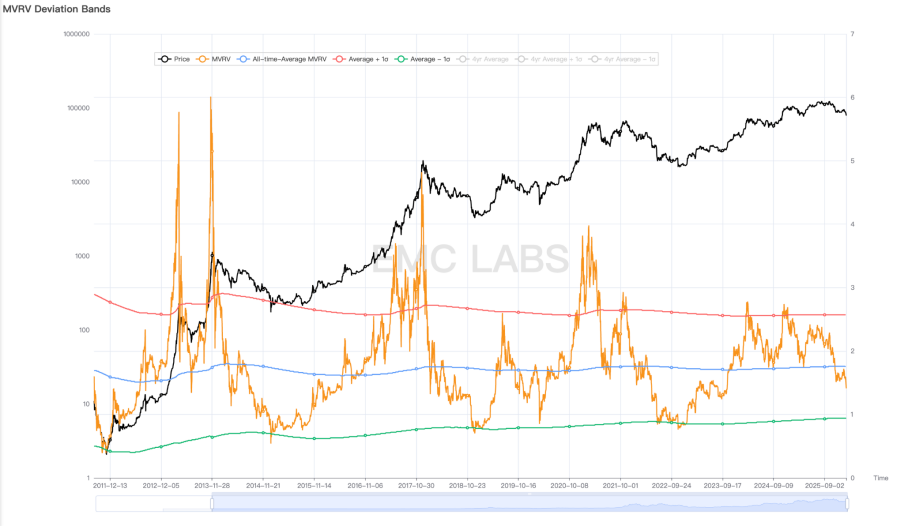
MVRV Deviation Band
After the market fell below the midline in November, MVRV attempted to recover the midline in mid-January but has now failed and fallen below the November low. This breakdown may be repeated, but once it is confirmed to be far from the midline, a "deep bear market" can be clearly established.
According to historical experience, this breakdown may attempt to recover multiple times, ultimately leading to more holders giving up resistance and turning to stop-loss, pushing the MVRV value further down until it reaches the lower bound, entering the cycle bottom through chip exchange.
Finally, let's look at the "cyclical law" of seeking a sword in a boat.
The formation of the cyclical law stems from BTC's four-year halving cycle and its close correspondence with macro finance. The birth of BTC was a response from the crypto community to the massive monetary easing following the 2008 subprime crisis, combined with its design of a four-year issuance halving. Over the past 17 years, these two points have jointly shaped BTC's cyclical pattern. With the changes in the current U.S. rate-cutting cycle and the influx of BTC ETF funds, many voices in the market believe that the traditional "cyclical law" may become ineffective. However, as of now, we see that it is still functioning, possibly because a large number of BTC holders in the crypto community still adhere to this "ideological stamp," and trade accordingly.
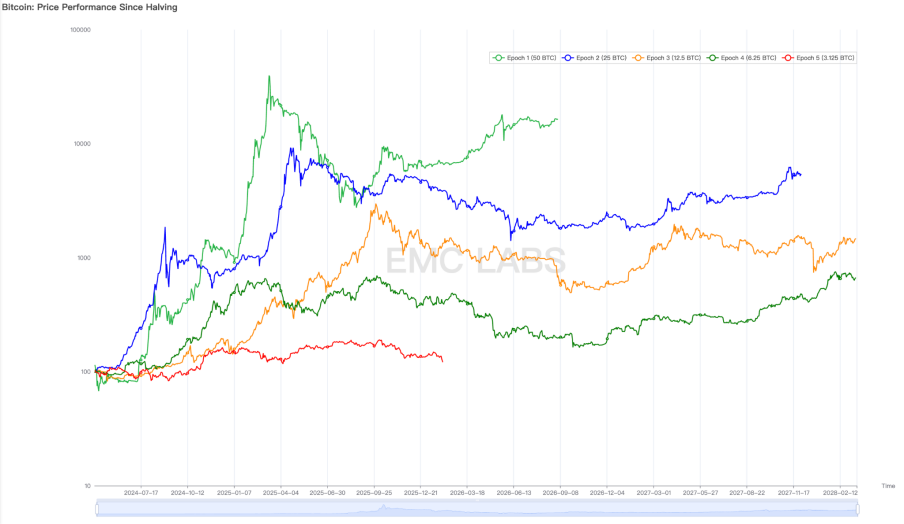
Comparison of BTC Price Trends After Each Halving
As of now, the peak and downward trend of BTC in this cycle correspond closely to the peak time points of the previous and the one before that cycles. If the subsequent trends continue to correspond, then the "deep bear market" may soon be confirmed, and a larger decline may occur, taking a longer time to gradually reach the market bottom in the second half of 2026.
Of course, the cyclical law is just an experience, but its degree of alignment makes it impossible for us to ignore.
In summary, we have examined the current market decline through four dimensions: "long-short market movements," "fund supply," "on-chain profit and loss status," and "cyclical law," to determine whether it belongs to a "cooling bear market" in the new cycle or a "deep bear market" in the old cycle. Almost all indicators have already completed or are about to complete the confirmation of a "deep bear market." Therefore, we believe that we are likely in the early stages of a deep bear market, and the market is likely to experience painful declines, liquidations, and even institutional bankruptcies in the next six months before reaching the bottom and restarting a new cycle.
Conclusion
Based on our analytical framework and statistical data, we believe that a "deep bear market" is a highly probable event. However, the market could still change this conclusion through a shift in Federal Reserve policy, changes in market risk appetite, sudden changes in industrial policy, or large-scale capital inflows.
In the future, we will closely monitor changes in macro finance and market structure, as well as market movements, and share our findings through reports.
Since its inception 17 years ago, BTC has experienced countless crises and has undergone multiple declines of over 70%, ultimately becoming a widely accepted new mainstream asset in this cycle.
Cycles repeat, and each time is the same. We believe that after undergoing this baptism, BTC and crypto assets will enter a larger development space.
免责声明:本文章仅代表作者个人观点,不代表本平台的立场和观点。本文章仅供信息分享,不构成对任何人的任何投资建议。用户与作者之间的任何争议,与本平台无关。如网页中刊载的文章或图片涉及侵权,请提供相关的权利证明和身份证明发送邮件到support@aicoin.com,本平台相关工作人员将会进行核查。